
Real-world feasibility, accuracy and acceptability of automated retinal photography and AI-based cardiovascular disease risk assessment in Australian primary care settings: a pragmatic trial
作者:He, Mingguang
Introduction
Cardiovascular disease (CVD) is the leading cause of mortality in Australia, accounting for approximately 25% of all deaths in 20211. It is also the leading cause of disease burden in the country, with 600,000 hospitalisations in 2020–21 and 116 million prescriptions of CVD related medications in 2021–221. However, it has been estimated by the World Health Organisation (WHO) that almost 80% of premature CVD events are preventable2. CVD risk assessment is a key step in CVD prevention as it helps to identify high risk patients at an early stage and allows for timely intervention3. There are a number of CVD risk assessment tools that have been derived from epidemiological studies. These include the Framingham risk score and the pooled cohort equations (PCE) for American populations4,5, the QRISK3 and SCORE2 for European populations6,7, and the WHO risk prediction charts for 21 global regions3. Despite the availability of these well-validated CVD risk assessment tools, the real-world uptake of CVD risk assessment is suboptimal8. The existing risk assessment tools are limited by the requirement for demographic information, clinical test results and often blood tests, which are not usually part of a standard initial primary care consultation. The collection of this risk information can be time-consuming and resource-demanding in real-world practice9.
The retina is a unique organ that allows in vivo visualization of microvasculature, which is indicative of systemic vascular health10. The value of the retina in predicting cardiovascular health has long been validated in epidemiological studies, ranging from gross structural signs such as cotton-wool spots, arterio-venular nicking and microhemorrhages, to quantitative vessel geometry measurements such as retinal vessel calibre, tortuosity, fractal dimension and branching angle10,11,12,13. The development of artificial intelligence (AI) algorithms for CVD risk prediction utilises retinal images to detect retinal changes that are indicative of cardiovascular health. Numerous algorithms based on retinal images have been developed to predict CVD risk-related outcomes, including single risk factors, CVD imaging biomarkers, CVD risk scores and CVD events14,15,16,17,18,19,20,21. Most of these algorithms were trained using retinal images without manual feature annotation to allow risk assessment that is not constrained by existing knowledge of associations between retinal features and CVD risk. Studies have indicated that retina-based CVD risk prediction algorithms have achieved reasonably good performance in experimental settings, however it is not known if similar performance is achieved in real-world contexts14,15,16,17,18,19,20,21.
The translation of technology from bench to bedside requires contextualisation in clinical settings. This includes hardware and digital infrastructure considerations, technical proficiency of care providers and an acceptance of AI applications by patients and health professionals alike. Technology also needs to be compatible with clinical workflows for adoption22. To investigate the clinical applicability of a retinal photographic CVD (rpCVD) risk assessment algorithm we conducted a pragmatic trial in Australian primary care settings to investigate the real-world feasibility, accuracy and acceptability of the technology.
Results
Study population
A total of 361 participants (mean age 59.3, 48.8% female) without a history of CVD were included in the analysis. The baseline characteristics of the participants are shown in Table 1.
Feasibility of rpCVD screening in primary practice
Of the 361 participants, 339 had a photograph of at least one eye that met the quality standards of the algorithm, giving a 93.9% imaging success rate (Table 2). Images of satisfactory quality were acquired at the first attempt for 65.9% of participants. The remaining 34.1% of participants required repeat imaging. The median (interquartile range [IQR]) time taken to complete the session - from the initiation of the automated image capture until the printing of the QR code for accessing the report - was 1 min 47 sec (1 min 30 s – 3 min 21 s).
Real-world performance of the algorithm
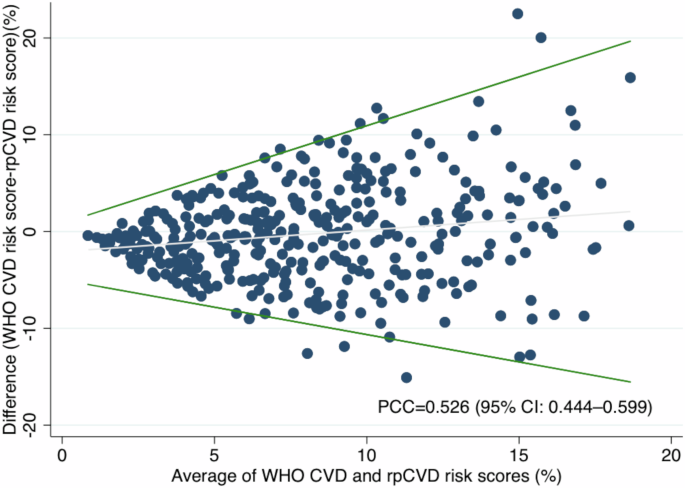
The distributions of rpCVD and WHO CVD risk scores for the 339 participants are shown in Supplementary fig. 2. The Pearson correlation coefficient (PCC) between rpCVD risk score and WHO CVD risk score was 0.526 (95% CI: 0.444–0.599) (Fig. 1 and Supplementary Table 3). The mean (standard deviation [SD]) difference between WHO CVD and the rpCVD risk scores was −0.316% (5.02%). As shown in the Bland-Altman plot (Fig. 1), the limits of agreement increased with the average (A) of WHO CVD and rpCVD risk scores (−0.57A −4.98 to 1.01A + 0.85).

Bland-Altman plot for the agreement between WHO CVD risk score and rpCVD risk score. The Bland-Altman plot depicted the difference between WHO CVD and rpCVD risk scores with the regression-based limits of agreement, over the mean of WHO CVD and rpCVD risk scores. The Pearson correlation coefficient (PCC) between rpCVD and WHO CVD risk score was 0.526 (95% CI: 0.444–0.599).
When categorised into low, moderate and high CVD risk, the agreement between rpCVD and WHO CVD was 63.4% among the participants with gradable image(s) (Table 3). 17.1% of the participants were assigned a higher risk category by the rpCVD compared to the WHO CVD risk score (overestimated), while 19.5% of the participants had a lower classification by the rpCVD compared to the WHO CVD risk score (underestimated). The characteristics of the participants, classified as underestimated, overestimated and well-estimated, are presented in Supplementary Table 4. Overall, older males who smoke and have diabetes tend to have an underestimated risk score while younger, non-smoker females without diabetes tend to be overestimated.
Subgroup analyses were performed by stratifying the sample by age group, sex, and the WHO CVD models. The results for subgroup analyses are shown in Supplementary Table 3. RpCVD showed higher correlation with the WHO CVD risk score in participants less than 60 years old than in those 60 years and above (PCC: 0.506 vs 0.339), in females relative to males (PCC: 0.439 vs 0.264), and in participants with a WHO CVD risk score calculated using the non-laboratory-based model compared to the laboratory-based model (PCC: 0.519 vs 0.545).
Sensitivity analyses showed that PCC between the rpCVD derived from the worse eye and WHO CVD was 0.478 (0.392–0.556) and the mean (SD) difference between WHO CVD and rpCVD was −1.98% (5.68%). In comparison, the PCC between rpCVD derived from the better eye and WHO CVD was 0.523 (0.441–0.597) and the mean (SD) difference was 1.35% (5.01%).
Predictive accuracy of rpCVD and WHO CVD for 10-year CVD events
A total of 27,595 participants without CVD at the baseline were included in the analysis. During the median follow-up of 11.4 (interquartile range: 11.3–11.5) years, 921 (0.38%, rpCVD) and 814 (0.35%, WHO CVD) participants in the low-risk group and 638 (0.96%, rpCVD) and 745 (0.98%, WHO CVD) participants in the moderate-high-risk group developed CVD (CHD and stroke) (Supplementary Table 5, 6). As shown in Table 4, the predictive value of rpCVD alone for predicting 10-year incident CVD (CHD and stroke) was 0.672 (95% CI: 0.658–0.686), which is comparable to the WHO CVD risk score (AUC = 0.693 [95% CI: 0.680–0.707]). The predictive values of 10-year coronary heart disease or stroke alone are also comparable for rpCVD and WHO CVD.
Participant acceptance of the rpCVD risk assessment system
Participant acceptance of the rpCVD risk assessment system was summarised in Fig. 2. In brief, 95.0% of participants agreed that the automated system was easy to use. 92.8% agreed that the real-time report was easy to understand and 93.6% of participants found that the management plan on the report was clear. Overall, 92.5% of participants were satisfied with the automated system. 89.4% of participants reported that they would use this system again and 90.8% would recommend the test to a friend.

Likert scale demonstrating participant acceptability regarding the rpCVD risk assessment system.
Supplementary Tables 7–10 summarised the results from the qualitative data from participant satisfaction survey reporting their suggestions on how to improve the system if they disagree with the statements. The major suggestions on how to increase the ease of use of the system were improving image capture, requirement of assistance, addressing the discrepancy between voice instruction and camera operation, customising the voice instructions for individuals with certain needs, and improving the grading accuracy. In terms of the report, participants suggested a more detailed explanation about how results were achieved and improvement of the grading accuracy. For participants with no results due to non-gradable images, we need to improve the workflow through, for example, adopting a dilation-if-needed protocol. Participants suggested the management plan to be more customised, required more reading time during the session, and suggested improvement in wording, overall readership, and a clearer layout of the management plan. For participants who reported not likely to recommend this system to a friend, the major reasons were concerns over the immaturity of the test, and not being qualified to recommend or not a relevant topic discussed.
Clinician acceptance of the rpCVD risk assessment system
The clinicians’ acceptance of the rpCVD risk assessment system was demonstrated in Fig. 3. Overall, 87.5% of the GPs were either satisfied or very satisfied with the system. 62.5% and 25.0% of the GPs agreed that the availability of the rpCVD system would likely or very likely to increase their willingness to perform a comprehensive CVD risk assessment. All of the participating GPs agreed that they are likely or very likely to continue using the rpCVD risk assessment system if this were integrated with their routine clinical workflow (Fig. 3a).

a Likert Scale demonstrating clinician acceptability regarding the rpCVD risk assessment system. b The barriers perceived by the participating general practitioners to implementing the rpCVD risk assessment system. c Participating general practitioners’ preference of the CVD risk assessment models.
The participating GPs reported three greatest barriers they perceived to the inclusion of retina-based CVD risk assessment screening service in primary care settings. As shown in Fig. 3b financial cost of using and purchasing the technology was the most frequently reported potential restriction, followed by patients’ lack of confidence in “machine”-calculated risk, technician/nurse lack of time to take the fundus photos, patients’ lack of confidence in CVD risk prediction from fundus photos. Technician/nurse lack of skill to take fundus photos and concerns over reduced physician-patient interaction were reported twice respectively. The other barriers mentioned once in the survey included the procedure being time-consuming if image capture fails, clinicians’ lack of confidence in “machine”-predicted CVD risk, clinicians’ concern over habitual reliance on technology leading to deskilling, and patients’ concerns over personal data security.
Figure 3c illustrated the participating GPs’ preference of CVD risk assessment models. The laboratory-based model was considered as the most preferred model by 75.0% of the participating GPs, and the rest of the GPs considered it as the second preferred model. In comparison, the rpCVD model was considered as the most preferred model by 25% of the GPs. 62.5% ranked it as the second-preferred model, and the remaining 12.5% considered it as the least preferred model. In contrast, 87.5% of the GPs of considered the non-laboratory-based model was the least preferred model, with 12.5% ranked it as the second-preferred model.
Discussion
In this prospective pragmatic trial, we found that the automated retinal photography and AI-based rpCVD risk assessment system is a feasible tool that is well-accepted by participants and GPs in Australian primary care settings. Despite the moderate association between rpCVD and WHO CVD risk score, rpCVD provides a faster, easier and non-invasive approach with comparable performance in predicting future CVD events.
To the best of our knowledge, this is the first pragmatic trial evaluating the real-world applicability of an AI-based retinal photography CVD risk assessment tool. Numerous algorithms for CVD risk prediction using retinal photography have been developed previously, achieving reasonably good performance and suggesting potential utility in CVD primary prevention23. However, previous algorithms were often limited in their clinical utility, as they focused on predicting standalone CVD risk factors, such as age, sex, smoking status17,18,19. Additionally, the validation of algorithms predicting CVD risk scores or CVD events in external datasets was limited16,20,21,23. Reti-CVD, a retinal photographic AI tool developed using from coronary artery calcium (CAC) scores as the ground truth for CVD risk, is well validated across multiple cohort studies including a retrospective pivotal trial24,25,26. The current pragmatic trial represents in essential step in the clinical validation of CVD risk assessment tools, as it simulates the real-world settings and examines the technical, environmental, societal and practical aspects of implementing such tool in primary care. This type of prospective evaluation is important to assist the translation of these technologies into routine clinical practice.
The high success rate of the automated retinal image acquisition (93.9%), short duration of the screening episode, and the overall satisfaction rate of approximately 90% among end-users suggest that the rpCVD system can be readily integrated into of routine primary care practice. The correlation between rpCVD and WHO CVD risk score was moderate in this real-world GP population, which remains to be optimised. However, in the validation analysis, the rpCVD risk score demonstrated similar predictive accuracy for 10-year incident CVD events (AUC = 0.672) as the WHO CVD risk score (AUC = 0.693). This suggests that the rpCVD system, using retinal images alone, can offer a faster, easier, and non-invasive method for CVD risk assessment compared to traditional risk-factor-based tools such as WHO risk score, which requires the collection of multiple parameters and often involves blood tests.
Nevertheless, the Bland-Altman plot revealed that the rpCVD algorithm tends to predict the WHO CVD risk score less accurately in individuals with higher risk levels. Additionally, subgroup analysis highlighted that the algorithm requires particular improvement for older males, who generally present with higher CVD risk. These findings indicate that caution is warranted when interpreting rpCVD risk scores in these populations and underscore the need for further algorithm refinement. The rpCVD algorithm’s performance may be limited by the development dataset. The algorithm was developed using data from the UK Biobank which has a relatively healthy population with fewer high-risk participants. This limited representation of high-risk individuals may constrain the algorithm’s performance when applied to another population with different distribution of characteristics. Additionally, the rpCVD algorithm might be affected by differences in imaging modality. The UK Biobank study used the TOPCON 3D OCT 1000 Mk2 device, which captures 45° macula-centred retinal images, whereas our study adopted the automated portable fundus camera Mediworks FC162 that acquires 50° macula-centred images. This variation in image acquisition techniques might necessitate adapting the algorithm to different retinal image types to enhance its generalisability across different imaging platforms.
There remains scope to improve the clinical tool. Firstly, follow-up of the participant’s CVD outcomes is required in further studies to enable the direct evaluation of the predictive capability of rpCVD risk score and WHO CVD risk score in real-world Australian population. In addition, although the rpCVD showed statistical significance in risk stratification for future CVD and reasonable predictive capability, further refinement is needed to translate it into a valid clinical tool. This could be potentially achieved by training the algorithm using more definitive CVD biomarkers such as coronary angiography or developing cohorts to include an adequate proportion of CVD outcomes to allow direct prediction of the onset of CVD events as a binary outcome. These refinements would enable a more clinically relevant outcome prediction and would also help with the comparison of the predictive value of rpCVD risk score with other well-established biomarkers.
As suggested by the Australian Guideline for assessing and managing cardiovascular disease risk, all people aged 45 years and above are suggested for a comprehensive CVD risk assessment by the Australian guideline27. Traditional CVD assessment tools require multiple clinical factors and/or invasive testing. The process is time-consuming for clinicians as reflected by low uptake rates of CVD risk assessment in Australia and overseas8,28,29. In our study, less than half of the participants were aware of any CVD risk assessment tools and only 25.8% of all participants had performed at least one form of CVD risk assessment. This indicates a large gap in patients’ awareness and understanding of the importance of CVD screening. The rpCVD screening system, is a swift and automated tool, that can be integrated into general practice clinics for all patients meeting the age criteria as a point-of-care testing prior to the scheduled consultation. However, as reflected by the participant and clinician satisfaction survey, an updated version of rpCVD algorithm with more accurate predictive performance is needed before the widespread usage of the technology. Other improvements regarding the hardware improvement, report layout and the customisation of the technique to meet the specific needs of certain populations.
The strength of our study is that the prospective pragmatic trial design allowed us to test the real-world implementation of the AI-based rpCVD screening tool. However, there are several limitations to be aware of. Firstly, the clinics involved in the study were chosen using convenience sampling, and this limits the representativeness of the sample. Moreover, as we recruited participants from an existing pool of GP patients and only those who agreed to participate were recruited, this could introduce participation bias. We adopted this approach to enhance feasibility and minimise ethical concerns. Participants showed a lower proportion of low-risk and a higher proportion of moderate-risk compared to the results from the Australian National Health Measures Survey in this age group without previous CVD30. Further validation could be performed in population-based datasets. Secondly, the study does not include follow-up data on the CVD outcomes, thus preventing us from examining the predictive value of rpCVD. Thirdly, we adopted the algorithm that has been trained using the WHO laboratory-based model, while the WHO CVD risk scores for parts of the individuals included in this study were calculated using the non-laboratory model considering the feasibility of getting blood test results for all in the Australian primary care system. This needs to be taken into account when interpreting the results. Notably, the mean difference between the laboratory-based and non-laboratory-based models was 0.16% (95% CI: 0.11% to 0.21%) in an Iranian validation study31. Lastly, we adopted a semi-structured survey to understand participant acceptance and satisfaction, without more detailed focus-group interviews with the participants. Therefore, the details of the concerns and challenges faced by the participants may be not understood thoroughly.
In conclusion, our study demonstrates that the automated rpCVD screening system is feasible and well-accepted in Australian primary care. Although its correlation with WHO CVD risk score is moderate, the predictive accuracy for 10-year CVD event is comparable with WHO CVD risk score. Further refinement of the rpCVD algorithm may lead to improved performance and support its wider clinical deployment as a convenient and non-invasive approach for CVD risk assessment in primary care.
Methods
Participants
Participants were recruited from two general practice clinics in Victoria, Australia. Individuals between 45 and 70 years old who had completed all or parts of a CVD risk assessment at the GP clinics located in Camberwell and Eltham within the past six months were considered eligible participants. Participants who completed the CVD risk assessment were defined as documentation of all risk factors required for the WHO CVD risk score (detailed in the protocol section). Parts of a CVD risk assessment is defined by at least one blood pressure, or one lipid test result recorded on the electronic medical record within the past six months. Eligible participants were contacted by the research team and invited to participate in the study. Individuals who agreed to participate had an appointment for a visit at the GP clinic they attended for the initial CVD risk assessment. At the conclusion of the pragmatic trial, eight general practitioners (GPs) participated in the study were invited to complete a clinician satisfaction survey.
Ethical approval
This study was approved by the Human Research Ethics Committee of St Vincent’s Hospital Melbourne (HREC 309/21-81875). The study was conducted in accordance with the tenets of the Declaration of Helsinki. All participants provided written informed consent.
The deep learning algorithm for CVD risk score prediction
The deep learning algorithm utilised in this study was developed using retinal images and demographic data from a total of 41,530 participants from the UK Biobank. The WHO CVD risk chart laboratory-based method3 for the Australian population was used as the ground truth for CVD risk during algorithm training. The ground truth was calculated based on age, sex, smoking status, systolic blood pressure, diabetes status and total cholesterol. An image quality assessment pipeline was applied to classify the image quality as “reject”, “usable” and “good”, using blurring, uneven illumination, low-contrast, and artifacts as major quality indicators for retinal images. The details of the method were described elsewhere32. Images graded as “usable” or “good” were considered eligible for training and validation. The deep learning model used VisionTransformer and implemented a five-fold cross-validation strategy to prevent overfitting. A classification head with multiple binary classification channels was applied to transfer the task into ordinal regression. The thresholds of each classification channel were optimised for the prediction F1-score empirically. We summarised the outputs of all classification channels as the final rpCVD risk score. The input images were resized to a resolution of 384 × 384 and data were augmented in terms of crop, color and greyscale. Optimization was performed using the Adam optimizer, and the model weights were initialised with ImageNet weights. The rpCVD risk score was generated individually for each eye. For participants with data available for both eyes, the score was determined as the mean value across both eyes33,34. In cases where a gradable retinal image was only obtainable for one eye, the individual’s rpCVD risk score would be based solely on the available result.
Protocol
The workflow of the testing protocol is shown in Fig. 4a. All participants underwent non-mydriatic fundus photography using an automated portable fundus camera (Mediworks FC162) that generates macula-centred photographs with a 50° field of view. The camera is linked to a tablet equipped with the rpCVD algorithm that grades retinal images in near real-time, generating a rpCVD risk score report and management plan. An illustration of the components of the automated rpCVD system was shown in Fig. 4b and a sample report was provided in Supplementary fig. 1. The report includes the retinal images, an rpCVD risk score in percentage, and the management plan provides recommendations on follow-up intervals. The on-site research team member explained the results and highlighted follow-up intervals to the participants according to their results. All participants were noted that this is research document only and would not affect their existing care plan with their care providers. A hard copy of the rpCVD report with the calculated conventional risk score was sent to the participants’ regular GPs on the same day for integrated clinical decision and ensuring the participants safety and health. Following imaging and report review, participants completed a self-administered questionnaire that evaluated satisfaction with the screening system. A research assistant administered a questionnaire that included sociodemographic information and cardiovascular health. Regardless of the completeness of data for the required WHO CVD risk score upon invitation, all WHO CVD risk factors were collected on the day of the visit for each participant through questionnaires, physical examinations and a review of the electronic medical records. The WHO CVD risk chart included a laboratory-based method calculated based on age, sex, smoking status, systolic blood pressure, diabetes status and total cholesterol; and a non-laboratory-based method using body mass index (BMI) as a substitute for diabetes and total cholesterol. The laboratory-based CVD risk chart was used as the label in the model development. Data collected through the questionnaire included date of birth, sex, self-reported smoking status (yes, including quit within the past 12 months/no), history of diabetes. History of diabetes was determined by self-reported doctor diagnosis, or the use of diabetic medications or insulin. Systolic blood pressure was measured on the day of the visit and total cholesterol was derived from participants’ most current blood test results within the past six months. If cholesterol test results were unavailable, height and weight were measured to calculate BMI, which was then used as a substitute in the non-laboratory-based model3.

a Flowchart of the testing protocol. b Illustration of the automated rpCVD system.
Longitudinal validation in the UK Biobank
To assess the predictive performance of rpCVD compared to WHO CVD risk score, a validation study in a longitudinal cohort is needed. Given the design of the pragmatic trial that prevented us from long-term follow-up for patient outcomes, we performed a longitudinal validation in the UK Biobank35 which encompasses both retinal images and long-term CVD outcomes. A total of 29,039 participants had gradable retinal image(s) and complete data on calculating the laboratory-based WHO CVD risk score. Of these, 1444 participants with any baseline CVD (including coronary heart disease, stroke, heart failure, atrial fibrillation and other heart/cardiac problems) were excluded, resulting in 27,595 participants included in the validation. The endpoint definition of CVD in the development and validation of the WHO CVD risk charts included coronary heart disease/myocardial infarction and stroke3. Therefore, we evaluated the 10-year predictive value of rpCVD and WHO CVD risk score for CVD aligning with this definition. In the UK Biobank, the baseline CVDs were defined from self-reported conditions (Supplementary Table 1) and inpatient hospital records using International Classification of Diseases (ICD) codes (Supplementary Table 2). Incident CVDs were determined by hospital records and death registry using ICD codes.
Statistical analysis
Participant characteristics, image quality, duration of image capture was represented as descriptive statistics. Continuous variables were displayed as means (standard deviations) or medians (interquartile ranges) if the distribution was skewed. Categorical variables were presented as numbers and percentages. One-way Analysis of Variance (ANOVA) tests were used to test the differences between groups for continuous variables if normally distributed, and Kruskal-Wallis tests were used if the normal distribution assumption was violated. Chi-squared tests were applied to test the differences between categorical variables and Fishers’ exact tests were applied if the expected count of any cell is less than 5. WHO CVD risk score was calculated using the whocvdrisk STATA package, which was made openly available by the WHO CVD Risk Chart Working Group3. The performance of the rpCVD screening system in the prediction of WHO CVD risk score was assessed using Pearson’s correlation and mean difference. RpCVD and WHO CVD risk scores were log-transformed for the correlation test. The mean difference between rpCVD and WHO CVD risk scores were calculated. As the variability of difference increases with the magnitude of the average of WHO CVD and rpCVD risk scores (heteroscedasticity) was observed, we adopted the regression approach proposed by Bland and Altman in 1999 to fit the regression-based limits of agreement (LoA) in the Bland-Altman plot36. The CVD risk scores were further categorised into low (< 10%), moderate (10% to < 15%) and high (≥ 15%) to assess how the rpCVD system reclassifies CVD risk compared to the WHO CVD risk score37. Agreement between the risk categories was assessed using a confusion matrix. When the rpCVD system assigned a risk category higher than the WHO CVD category, it was considered an overestimation. Conversely, it was defined as an underestimation. Subgroup analyses were conducted based on the primary CVD risk factors - age and gender38,39, and the laboratory-based or non-laboratory-based models, given their relevance to clinical applicability. Sensitivity analyses were conducted to further examine the performance of the rpCVD system using the eye with worse CVD risk score or the eye with better CVD risk score. Multi-variate Cox regression models were applied to assess the association of rpCVD risk with incident CVD in the UK Biobank. The models were adjusted for age, sex, smoking status, medical history of diabetes, hypertension, and hyperlipidemia25. Hazard ratio was calculated to quantify the effect size. Area under the receiving operator curve (AUC) was quantified to assess the performance of rpCVD and WHO CVD in predicting 10-year incident CVD events. Two-sided P values less than 0.05 were considered statistically significant. Participants’ and clinicians’ responses to the satisfaction questionnaire were demonstrated in Likert Scales and the answers to open-ended questions were analysed thematically. Ranking survey data were presented using stacked bar charts. Statistical analysis was performed using Stata Version 16 (College Station, Texas, USA) and Microsoft Excel (Microsoft Cooperation, USA). The trial was registered under registration number ACTRN12623001174673 at the Australian New Zealand Clinical Trial Registry (ANZCTR).
Data availability
The data that support the findings of this study are not openly available due to ethics regulations. However, data access requests for future research will be considered by the corresponding author on a case-by-case basis and subject to relevant institutional and ethical approvals. Data are located in controlled access data storage at the Centre for Eye Research Australia.
Code availability
The code employed for data analysis can be obtained by contacting the corresponding author upon request.
References
Australian Institute of Health and Welfare. Heart, stroke and vascular disease: Australian facts. Canberra: AIHW, (2023).
Cardiovascular diseases: Avoiding heart attacks and strokes. Available at https://www.who.int/news-room/questions-and-answers/item/cardiovascular-diseases-avoiding-heart-attacks-and-strokes. Accessed 12 March 2024.
Group WCRCW. World Health Organization cardiovascular disease risk charts: revised models to estimate risk in 21 global regions. Lancet Glob Health 7: e1332–e1345 (2019).
Wilson, P. W. F. et al. Prediction of Coronary Heart Disease Using Risk Factor Categories. Circulation 97, 1837–1847 (1998).
Goff, D. C. et al. 2013 ACC/AHA Guideline on the Assessment of Cardiovascular Risk. Circulation 129, S49–S73 (2014).
Hippisley-Cox, J., Coupland, C. & Brindle, P. Development and validation of QRISK3 risk prediction algorithms to estimate future risk of cardiovascular disease: prospective cohort study. BMJ 357, j2099 (2017).
group Sw, collaboration ECr. SCORE2 risk prediction algorithms: new models to estimate 10-year risk of cardiovascular disease in Europe. Eur. Heart J. 42: 2439–2454 (2021).
Stocks, N., Allan, J., Frank, O., Williams, S. & Ryan, P. Improving attendance for cardiovascular risk assessment in Australian general practice: an RCT of a monetary incentive for patients. BMC Fam. Pr. 13, 54 (2012).
Hespe, C. M., Giskes, K., Harris, M. F. & Peiris, D. Findings and lessons learnt implementing a cardiovascular disease quality improvement program in Australian primary care: a mixed method evaluation. BMC Health Serv. Res 22, 108 (2022).
Flammer, J. et al. The eye and the heart. Eur. Heart J. 34, 1270–1278 (2013).
McGeechan, K. et al. Meta-analysis: retinal vessel caliber and risk for coronary heart disease. Ann. Intern Med. 151, 404–413 (2009).
Sandoval-Garcia, E. et al. Retinal arteriolar tortuosity and fractal dimension are associated with long-term cardiovascular outcomes in people with type 2 diabetes. Diabetologia 64, 2215–2227 (2021).
Betzler, B. K. et al. Retinal vascular profile in predicting incident cardiometabolic diseases among individuals with diabetes. Microcirculation 29, e12772 (2022).
Hu, W. et al. A Systematic Review and Meta-Analysis of Applying Deep Learning in the Prediction of the Risk of Cardiovascular Diseases From Retinal Images. Transl. Vis. Sci. Technol. 12, 14 (2023).
Diaz-Pinto, A. et al. Predicting myocardial infarction through retinal scans and minimal personal information. NATURE MACHINE INTELLIGENCE 4, 55 (2022).
Vaghefi, E. et al. Development and validation of a deep-learning model to predict 10-year atherosclerotic cardiovascular disease risk from retinal images using the UK Biobank and EyePACS 10K datasets. Cardiovasc. Digit. Health J. 2024, 59–69 (2024).
Friso, G. H. et al. Direct classification of type 2 diabetes from retinal fundus images in a population-based sample from the Maastricht study. ProcSPIE; 2020; (2020).
Kim, Y. D. et al. Effects of Hypertension, Diabetes, and Smoking on Age and Sex Prediction from Retinal Fundus Images. Sci. Rep. 10, 4623 (2020).
Vaghefi, E. et al. Detection of smoking status from retinal images; a Convolutional Neural Network study. Sci. Rep. 9, 7180 (2019).
Rim, T. H. et al. Deep-learning-based cardiovascular risk stratification using coronary artery calcium scores predicted from retinal photographs. Lancet Digit Health 3, e306–e316 (2021).
Poplin, R. et al. Prediction of cardiovascular risk factors from retinal fundus photographs via deep learning. Nat. Biomed. Eng. 2, 158–164 (2018).
Ruamviboonsuk, P. et al. Real-time diabetic retinopathy screening by deep learning in a multisite national screening programme: a prospective interventional cohort study. Lancet Digit Health 4, e235–e244 (2022).
Ma, Y. et al. Deep learning algorithm using fundus photographs for 10-year risk assessment of ischemic cardiovascular diseases in China. Sci. Bull. 67, 17–20 (2022).
Yi, J. K. et al. Cardiovascular disease risk assessment using a deep-learning-based retinal biomarker: a comparison with existing risk scores. Eur. Heart J. Digit Health 4, 236–244 (2023).
Lee, C. J. et al. Pivotal trial of a deep-learning-based retinal biomarker (Reti-CVD) in the prediction of cardiovascular disease: data from CMERC-HI. J. Am. Med Inf. Assoc. 31, 130–138 (2023).
Tseng, R. et al. Validation of a deep-learning-based retinal biomarker (Reti-CVD) in the prediction of cardiovascular disease: data from UK Biobank. BMC Med. 21, 28 (2023).
Commonwealth of Australia as represented by the Department of Health and Aged Care. Australian Guideline for assessing and managing cardiovascular disease risk. (2023).
Wee, L. E., Koh, G. C. & Toh, Z. J. Multi-disease health screening in an urban low-income setting: a community-based study. Ann. Acad. Med Singap. 39, 750–757 (2010).
Sinclair, G. & Kerr, A. The Bold Promise Project: a system change in primary care to support cardiovascular risk screening. N. Z. Med J. 119, U2312 (2006).
Banks, E. et al. Absolute risk of cardiovascular disease events, and blood pressure- and lipid-lowering therapy in Australia. Med J. Aust. 204, 320 (2016).
Dehghan, A., Rayatinejad, A., Khezri, R., Aune, D. & Rezaei, F. Laboratory-based versus non-laboratory-based World Health Organization risk equations for assessment of cardiovascular disease risk. BMC Med. Res. Methodol. 23, 141 (2023).
Fu, H. et al. Evaluation of Retinal Image Quality Assessment Networks in Different Color-Spaces. 2019; Cham: Springer International Publishing; 2019.
Ma, Y. et al. Deep learning algorithm using fundus photographs for 10-year risk assessment of ischemic cardiovascular diseases in China. Sci. Bull. (Beijing) 67, 17–20 (2022).
Chang, J. et al. Association of Cardiovascular Mortality and Deep Learning-Funduscopic Atherosclerosis Score derived from Retinal Fundus Images. Am. J. Ophthalmol.217, 121–130 (2020).
Sudlow, C. et al. UK biobank: an open access resource for identifying the causes of a wide range of complex diseases of middle and old age. PLoS Med 12, e1001779 (2015).
Bland, J. M. & Altman, D. G. Measuring agreement in method comparison studies. Stat. Methods Med. Res. 8, 135–160 (1999).
Zhang, W. et al. Enhancing stability in cardiovascular disease risk prediction: A deep learning approach leveraging retinal images. Inform. Med. Unlocked 42, 101366 (2023).
Jousilahti, P., Vartiainen, E., Tuomilehto, J. & Puska, P. Sex, age, cardiovascular risk factors, and coronary heart disease: a prospective follow-up study of 14 786 middle-aged men and women in Finland. Circulation 99, 1165–1172 (1999).
Sniderman, A. D. & Furberg, C. D. Age as a modifiable risk factor for cardiovascular disease. Lancet 371, 1547–1549 (2008).
Acknowledgements
This project received grant funding from the Australian Government: the National Critical Research Infrastructure Initiative, Medical Research Future Fund (MRFAI00035) and the NHMRC Investigator Grant (APP1175405, 2010072). The contents of the published material are solely the responsibility of the Administering Institution, a participating institution or individual authors and do not reflect the views of the NHMRC. This work was supported by the Global STEM Professorship Scheme (P0046113), the Fundamental Research Funds of the State Key Laboratory of Ophthalmology, Project of Investigation on Health Status of Employees in Financial Industry in Guangzhou, China (Z012014075). The Centre for Eye Research Australia receives Operational Infrastructure Support from the Victorian State Government. W.H. is supported by the Melbourne Research Scholarship established by the University of Melbourne. The funding source had no role in the design and conduct of the study; collection, management, analysis, and interpretation of the data; preparation, review, or approval of the manuscript; and decision to submit the manuscript for publication.
Ethics declarations
Competing interests
The authors declare no competing interests.
Additional information
Publisher’s note Springer Nature remains neutral with regard to jurisdictional claims in published maps and institutional affiliations.
Supplementary information
Rights and permissions
Open Access This article is licensed under a Creative Commons Attribution-NonCommercial-NoDerivatives 4.0 International License, which permits any non-commercial use, sharing, distribution and reproduction in any medium or format, as long as you give appropriate credit to the original author(s) and the source, provide a link to the Creative Commons licence, and indicate if you modified the licensed material. You do not have permission under this licence to share adapted material derived from this article or parts of it. The images or other third party material in this article are included in the article’s Creative Commons licence, unless indicated otherwise in a credit line to the material. If material is not included in the article’s Creative Commons licence and your intended use is not permitted by statutory regulation or exceeds the permitted use, you will need to obtain permission directly from the copyright holder. To view a copy of this licence, visit http://creativecommons.org/licenses/by-nc-nd/4.0/.
About this article

Cite this article
Hu, W., Lin, Z., Clark, M. et al. Real-world feasibility, accuracy and acceptability of automated retinal photography and AI-based cardiovascular disease risk assessment in Australian primary care settings: a pragmatic trial. npj Digit. Med. 8, 122 (2025). https://doi.org/10.1038/s41746-025-01436-1
Received:
Accepted:
Published:
DOI: https://doi.org/10.1038/s41746-025-01436-1