

Using artificial intelligence system for assisting the classification of breast ultrasound glandular tissue components in dense breast tissue
作者:Bao, Lingyun
Introduction
Breast density stands as an independent risk factor for breast cancer1,2. Compared to women with scattered fibroglandular densities, the relative breast cancer risk is estimated to be less than 1.2 for those with heterogeneously dense breasts and less than 2.1 for women with extremely dense breasts3. Breast density essentially reflects the mammographic quantity of fibroglandular tissue (FGT) in the breast4,5. FGT encompasses both fibrous and glandular tissues. In mammograms, these tissues present as high-density radiopaque areas, sharing a density similar to that of breast cancer lesions6. However, the fibrous stroma appears hyperechoic, whereas glandular tissue appears hypoechoic, they can be clearly differentiated in ultrasound images7. Studies have indicated that breast cancer often originates from the lobules and terminal ducts within glandular tissue, with larger amounts of glandular tissue correlated with greater risks of breast cancer8,9. There is considerable debate surrounding the accurate classification of tissue components in breast ultrasound images9,10,11,12. A widely recognized classification method is that of Lee et al.13, which can be used to categorize the glandular tissue components (GTCs) in dense breast tissue. According to the proportion of glandular tissue (comprising lobules and terminal ducts) to fibrous stroma within the FGT, ultrasound images in dense breasts are classified into four types: P1 (minimal, <=25%), P2 (mild, 25–49%), P3 (moderate, 50–74%), and P4 (marked, >=75%). Lee et al. also pointed out that a high GTC classification, such as P3 or P4 glandular, serves as an independent risk factor for breast cancer14. Currently, GTC classification rely on the visual assessment by radiologists, which is influenced by observer experience, and exhibits a lack of robust interobserver agreement, particularly among less experienced and non-breast radiologists15. Standardized, large-sample, deep learning-based artificial intelligence (AI) models can therefore be helpful to enhance the reliability, robustness, and reproducibility of assessments.
According to the CONSORT AI guidelines, the applications of AI in radiological images include Radiomics, machine learning (ML), deep learning (DL), neural network (NT), among others16. These are image-based radiology algorithms. The ResNet model, which is further developed and optimized based on the NT model, is capable of performing clinically meaningful tasks such as classification, segmentation, and detection. The successful implementation of these tasks has spurred interest in its application within breast radiology images17. A substantial amount of published literature and available AI applications in breast radiology concentrate on breast cancer detection, decision support, risk assessment, workflow and triage, quality evaluation, assessment of response to neoadjuvant chemotherapy, and image enhancement18,19. There have also been several studies on the application of breast density quantitation in mammography (MM). Models such as the machine learning model20, deep-LIBRA model21, deep learning model22, Morph SPCNN model23, Multichannel DenseNet model24, SE-Attention neural networks25 have been utilized for MM density classification, demonstrating good auxiliary efficiency. Grovik, Van der et al. proposed that deep learning models outperform radiologists in the background parenchymal enhancement (BPE) classification of breast MRI26,27. However, studies on Ai-assisted glandular tissue classification in breast ultrasound images are still scarce. This research aims to provide a methodology for simulating the application of artificial intelligence models in GTC classification.
The main purpose of this study is to train a ResNet model to assist radiologists in the classification of GTC in dense breast tissue. In addition, it intends to verify the classification effectiveness of the Ai-assisted model for different radiologists.
Materials and methods
Study sample
The study protocol was approved by the Ethics Committee of the Hangzhou First People’s Hospital (Permission Number IIT20240527-0175-01) and conducted in accordance with the tenets of the Declaration of Helsinki. The prospective study focused on ultrasound data collected from 2,226 healthy women who underwent breast ultrasonography at the Affiliated Hangzhou First People’s Hospital, School of Medicine, Westlake University between June 1st and November 25th, 2024 (Fig. 1). The inclusion criteria were women aged 40–69 years, who exhibited a fibroglandular density classified as ACR BI-RADS28 category C or D in mammograms by two senior radiologists, each with at least 10 years of experience specifically in breast-related imaging diagnosis. The involved images presented with discernible glandular structures in ultrasound images, free from any discernible lesions such as cysts, nodules, calcifications, or dilated ducts. The exclusion criteria included pregnancy or lactation, a history of breast surgery, previous foreign body injection into the breast, the presence of breast implants, and poor-quality images. All participants voluntarily consented to be part of the study and provided written informed consent. Participant records and personal information were anonymized.
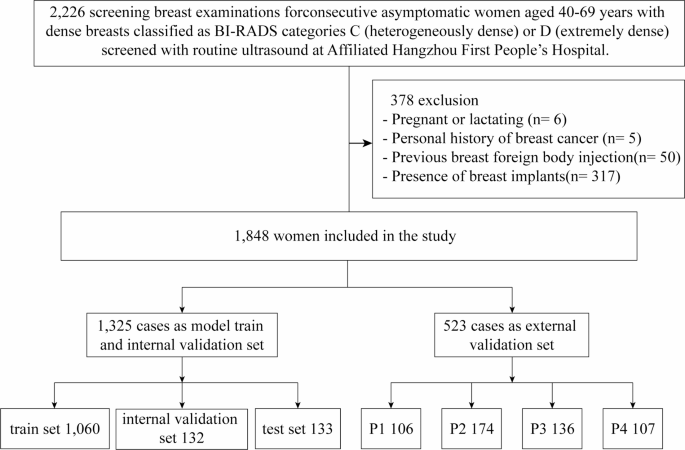
Study flowchart. BI-RADS Breast imaging reporting and data system.
Image acquisition
The ultrasound images included in the study were obtained with Siemens S2000, S3000, and Acuson Oxana2 devices (Siemens) with 18L6 and 9L4 high-frequency linear array probes; R10 and RS80A devices (Samsung) with LA2-14 A and L3-12 A high-frequency linear array probes; an EPIQ5 device (Philips) with eL18-4 high-frequency linear array probes; an LOGIQ-E11 device (GE HealthCare) with ML6-15 probes; a Resona-7 s device (Mindray) with L14-5WU high-frequency linear array probes; and a MyLab 8 device (Esaote) with L4-15 high-frequency linear array probes. The ultrasound imaging protocol is detailed in the Appendix Table 1. The images employed were in the DICOM (Digital Imaging and Communications in Medicine) format. The standard protocol at the study institution included positioning participants in a supine position with both arms naturally abducted and raised to fully expose the breasts. A uniform layer of coupling gel was applied, and the breast was scanned radially with the nipple at the centre. Scanning started from the edge where the glandular tissue meets the surrounding fat, extending to the nipple while avoiding the nipple and areola area. The glandular tissue in the upper outer quadrant, located 2 cm from the nipple, which is the thickest part, was selected for imaging. It was ensured that the glandular structure was clear in the image, without any cysts, nodules, calcifications, or dilated ducts. The images were frozen and saved.
Image interpretation
The gold standard for this study was established by three senior radiologists with over 10 years of experience in diagnosis based on breast ultrasound images and extensive clinical expertise. To ensure the reliability and validity of the results, all three radiologists underwent GTC classification training and reviewed more than 50 cases before the image assessment was performed. Two of the three senior breast sonographers manually labelled all the breast ultrasound images to ensure that the labels were accurate and consistent. The labelling process was performed in two steps. Firstly, the borders of the gland and the fibrous stroma were labelled to determine the percentage of glandular tissue. Secondly, the images were classified into four categories, P1, P2, P3, and P413, on the basis of the percentage (Fig. 2). To prevent data leakage, the dataset was partitioned at the patient level, ensuring no overlap of patient data between subsets. The labelling process was performed in a double-blind manner, and any inconsistency in the labelling results was arbitrated by a third radiologist. All labelled data were saved in a standardized format for use in subsequent model training and validation. The final dataset was divided into training and testing sets following an 8:2 ratio allocation strategy.

Labeling the borders of glands and fibrous stroma and classification results. Glandular tissue component is qualitatively assessed as proportion of gray areas to white areas in FGT after scanning entire breast and is classified into four categories. P1, minimal (≤ 25% of FGT) (A); P2, mild (25-49% of FGT) (B); P3, moderate (50-74% of FGT) (C); P4, marked (≥ 75% of FGT) (D).
To evaluate the consistency of the classification of the glands in the breast ultrasound images by the three senior radiologists, all 1,848 images were scrutinized for consistency in four categories. The inter-radiologist agreement on classification results was thoroughly deliberated, thereby to provide a grounded basis for the gold standard used in the experiments.
AI system
Model training
On the basis of the annotated dataset, we trained two deep learning models, one for classification and the other for segmentation of breast ultrasound images (Fig. 3). In the classification model, ResNet101 was employed as the backbone network, which effectively addresses the vanishing gradient problem in deep networks through the introduction of residual blocks, enabling the training of deeper layers and thus enhancing the feature extraction capabilities of the model. To improve the generalizability and robustness of the model, preprocessing steps, including grayscale conversion, normalization, and data augmentation, were applied to the input images prior to training. In the grayscale conversion step, the single-channel grayscale values were retained; in the normalization step, the pixel values were scaled to the range [0, 1], improving the training speed and model convergence; and in the data augmentation step, operations such as rotation, flipping, and scaling were performed, increasing the data diversity and reducing the risk of overfitting.

AI system. Two deep learning models, one for classification and another for segmentation of breast ultrasound images.
During the training process, we utilized the cross-entropy loss function to quantify the classification errors and the Adam optimization algorithm to update the network weights. To prevent overfitting, an early stopping strategy was implemented, with training terminated when the performance of the model based on the validation set ceased to improve, thereby maintaining the optimal state of the model.
We adopted a combination of ResNet and a fully convolutional network (FCN) for the segmentation task. The ResNet component was used to extract high-level semantic features from the images. The FCN component was used to decode these features back to the spatial dimensions of the input image, achieving pixel-level segmentation. To better adapt the model to the segmentation task, we designed a decoder module that progressively restored the resolution of the feature maps, enabling precise segmentation of the images. In designing the loss function, considering the characteristics of the segmentation task, we used a weighted combination of the Dice loss and cross-entropy loss. The combined loss for segmentation integrates Dice loss and cross-entropy loss as follows:
$${{\text{L}}_{{\text{seg}}}}={\text{a}} \cdot {{\text{L}}_{{\text{Dice}}}}+{\text{ }}({\text{1}} - {\text{a}}) \cdot {{\text{L}}_{{\text{CE}}}}$$
The classification task employs the cross-entropy loss:
$${L_{{\text{cls}}}}= - \sum\limits_{{i=1}}^{N} {\sum\limits_{{c=1}}^{C} {{y_{i,c}}\log ({p_{i,c}})} }$$
Where N is the number of samples, C is the class count, yi, c denotes the ground-truth one-hot label, and pi, c represents the predicted probability. This clarification replaces the preliminary Focal loss description and aligns with our implementation.
The Dice loss function focuses on balancing differences between classes, which is particularly beneficial in handling class-imbalanced datasets; the cross-entropy loss function penalizes misclassified pixels. Combining both loss functions ensured good distinction between the foreground and background while improving the segmentation accuracy.
Throughout the training process, we also employed the Adam optimizer to minimize the loss. We utilized early stopping to monitor the model during training, ensuring that it did not overfit the training data.
Reader selection and task
Six radiologists conducted the external validation of the model. Group A included three breast radiologists (one senior radiologist who was not in the gold standard cohort, one attending radiologist, and one resident radiologist), whereas group B comprised three non-specialized breast ultrasound radiologists in the field (one senior radiologist, one attending radiologist, and one resident radiologist). Before the images were reviewed, all six radiologists underwent training, involving reviews of more than 30 cases. All radiologists were blinded to the glandular tissue classification results before reviewing the images. They first performed independent assessments to provide GTC classification results. After a one-month washout period, they evaluated the images again with the assistance of the proposed AI system and provided the GTC classification results again.
Statistical analysis
To evaluate the auxiliary classification performance of the AI system compared with that of radiologists of different seniority levels, three commonly used indicators, namely, the sensitivity, specificity, and positive predictive value, were selected to analyse the performance of the proposed method.
The data were analysed with SPSS 26.0 statistical analysis software. The data were first analysed on the basis of descriptive statistics, using expressions such as the mean and frequency. Accuracy was used to evaluate the detection performance of the different groups, and intergroup comparisons were performed with χ2 tests and paired t tests. All the statistical tests were performed using two-sided tests, and p < 0.05 was considered statistically significant. To assess the agreement among the three gold-standard radiologists, the results were analysed using Fleiss’ kappa coefficients. Additionally, the agreement between the two radiologists in each category was calculated on the basis of Cohen’s kappa to further understand the differences in specific categories.
The classification performance of the model was comprehensively evaluated using receiver operating characteristic (ROC) curves and the area under the curve (AUC). In the context of the classification model, the determination of the final predicted class followed a well - defined process. Specifically, the soft-max function was applied to the output logits. This mathematical transformation effectively converted the logits into class-specific probabilities. Subsequently, the class associated with the highest probability value was chosen as the predicted label, thus finalizing the classification outcome.
Results
Characteristics of the participants
A total of 1,848 images who met the criteria were included (mean age: 49 ± 8 years), 48.97% of women (905/1848) were premenopausal, 23.38% of women (432/1848) were perimenopausal, 26.84% of women (496/1848) were postmenopausal, and 0.81% of women (15/1848) were unknow, 59.90% of women (1107/1848) had type C mammogram density, and 40.10% of women (741/1848) had type D mammogram density. The GTC at breast US distributed18.89% of women (349/1848) were P1, 32.68% of women (604/1848) were P2, 28.84% of women (533/1848) were P3, and 19.59% of women (3364/1848) were P4 (Table 1).
Gold standard consistency analysis
To enhance the credibility of the gold standard results, we conducted a consistency analysis of the GTC classification outcomes from the three designated gold standard radiologists. The results of the four classifications based on all the breast ultrasound images by the three senior radiologists showed a high degree of agreement. The value of 0.82 denotes the overall Fleiss’ Kappa for the entire dataset (n = 1,650) and this value was computed across all readers and categories. It is crucial to note that it does not represent an average of the category-specific values. Instead, it serves as a comprehensive, global measure of agreement for the entire sample, providing a holistic assessment of the concordance among all involved variables within the dataset. The agreement for each category is shown in Table 2.
Internal validation of the model
To select the optimal AI model, we perform an internal validation of the two models developed. The accuracies of the ResNet101 and ResNet + FCN models were 0.56 and 0.44, respectively. The AUC of the ResNet101 model was greater than that of the ResNet + FCN model for all four classifications: P1 (0.930 vs. 0.833), P2 (0.833 vs. 0.692), P3 (0.713 vs. 0.591), and P4 (0.923 vs. 0.850) (Table 3; Fig. 4), mean AUC 0.850 vs. 0.741.

Performance of internal validation.
External validation of the model
Sensitivity of different groups
First, the classification sensitivity of each radiologist was compared in the cases of single and with AI screenings. Table 4 shows that the sensitivities of all the radiologists for the four GTC categories were improved with the assistance of the AI system, with the sensitivities of the radiologists increasing by 0.009, 0.019, 0.052, 0.042, 0.060, and 0.17.
The sensitivities of the radiologists in group A and group B for different GTC classifications were further analysed (Table 5). It showed that the use of the AI system improved the sensitivity of the breast specialists in classifying the P1, P2, and P4 glandular types from 0.238, 0.636, and 0.458 to 0.452, 0.734, and 0.464, respectively, with significant differences for the P1 and P2 glandular types (p < 0.05). The performance was poorer for P3 glandular types, and the difference was not statistically significant (p = 0.36). For non-breast specialists, the use of the AI system also improved the sensitivity in classifying P1 and P2 glandular types from 0.311 to 0.435 to 0.412 and 0.694, respectively, and this difference was significant (p < 0.01). However, for the P3 and P4 glandular types, the independent reading group performed better, with significantly better performance for the P3 glandular type (p < 0.05).
Specificity of different groups
The use of the Ai-assisted interpretation system significantly improved the specificity of the radiologists in group A in the classification of P3 glands (0.687 vs. 0.744, p < 0.05), whereas no statistically significant differences were observed for the P1, P2, and P4 gland classifications. For the radiologists in group B, with Ai-assisted, it was markedly increased the specificity for the P3 and P4 classifications from 58.7% to 0.639 (p < 0.05) and 0.794 to 0.953 (p < 0.01), respectively. No significant differences were found for the P1 and P2 gland classification (Table 5). These results suggest that the use of the Ai-assisted interpretation system does not increase the rate of false negatives and results in superior performance in classifying P3 and P4 glands.
Positive predictive values (PPVs) of GTC for different groups
The PPVs for the GTC classification significantly increased for both groups of radiologists with the assistance of the model. It was shown in Table 6, P1 0.277 vs. 0.431 (p < 0.01), P2 0.550 vs. 0.728 (p < 0.01), P3 0.685 vs. 0.712 (p < 0.01), and P4 0.469 vs. 0.578 (p < 0.01), respective. Among the breast specialists in group A, the increase in the PPV was similar, with no statistically significant differences among the radiologists. However, in group B, the improvement in the PPV varied significantly among the non-breast specialists (p < 0.05). For the P1 and P4 gland classifications, the PPVs of all radiologists in both groups increased, with more pronounced improvements observed among the non-breast specialists in group B (p < 0.05). For the P2 gland classification, the PPVs of all the radiologists significantly improved, except for the senior breast radiologists in Group A, for whom no notable changes were observed. For the P3 gland classification, the use of the Ai-assisted reading system resulted in significant improvements in the PPV only among attending and resident radiologists in group B, whereas no statistically significant differences were found among the other radiologists.
Discussion
In this study, we prospectively trained two AI image analysis models, ResNet101 and ResNet + FCN and internally verified the analysis performance. The results demonstrated that the ResNet101 classification model outperformed the ResNet segmentation model. We referred to the auxiliary classification performance of ResNet and other AI models in mammogram density. The ResNet 18 model with the AUC values were 0.68 for images29. Similarly, Mcknney et al. using four different AI models including RetinaNet, MobileNetV2, ResNet-v2-50, ResNet-v1-50, which AUC were 0.76–0.8930. Sexauer et al. using 4605 synthetic 2D images adapt two (MLO, CC) deep convolutional neural networks (DCNN) for automatic breast density classification, found that the mean sensitivity was 80.4%, the specificity was 89.3%, and the accuracy was 89.6%, respectively31. These findings reveal the reliability of ResNet model in the assistant of GTC classification. Consequently, the ResNet101 classification model was ultimately selected as the algorithmic model to validate its effectiveness in assisting radiologists with the classification of breast GTC in this study.
In external validation, with Ai-assisted, the sensitivity, specificity, and positive predictive values (PPVs) were notably higher compared to independent readings. Additionally, the validation of Ai-assisted readings was carried out to assess the classification of images corresponding to different types of GTC. The validation results found that the specificity of P1 gland classification of all radiologists was 0.988–0.997 during independent reading, and the specificity was not significantly improved after Ai-assisted reading and this did not show significant improvement with Ai-assisted. However, both sensitivity and PPVs saw substantial improvements with Ai-assisted reading (sensitivity independent reading 0.275 vs. Ai-assisted reading 0.432, PPVs independent reading 0.277 vs. 0.431) (p < 0.01). The PPVs of senior and attending radiologists in both group A and group B were elevated by more than 0.20, indicating that Ai-assisted perusal had no significant effect on improving the specificity of class P1 gland classification, but was beneficial in improving the sensitivity and PPVs for recognizing class P1 glands.
For the P2 glands, the specificity in the two groups decreased significantly, with the specificity of 0.695 and 0.780, respectively. Moreover, there was no noticeable improvement in the specificity with Ai-assisted reading system. Kim et al.11 also noted that the consistency of observers is lowest for glandular backgrounds with mild heterogeneity (P2 glands) with a kappa (κ) value of 0.15. As the amount of hypoechoic glandular tissue in the images increases, the image background becomes progressively more complex, making the visual assessment of the GTCs more susceptible to individual variations among observers. However, there were significant differences in the sensitivity and PPVs between two groups. Group A, consisting of breast radiologists, demonstrated higher sensitivity and average PPVs compared to Group B, which included non-breast radiologists. The sensitivity of the group A radiologists was slightly improved with the AI system, and the PPVs for the attending and resident radiologists in group A increased notably. In contrast, there was no significant change in the PPVs for senior radiologists with the AI system. For group B, the sensitivity and PPVs significantly improved with the AI system with a notable 0.356 increase in the PPV for resident radiologists greatly enhancing the accuracy of P2 glandular classification. This finding indicates that as the proportion of glandular tissue in the background of the breast image increases, the specificity of the radiologist assessments decreases. However, the sensitivity and accuracy of the senior breast radiologists are less affected with Ai-assisted, with no significant differences. In contrast, the sensitivity and accuracy of the non-breast radiologists, especially attending and resident radiologists, are significantly improved with Ai-assisted.
For the P3 glands, the specificity of identification by both groups of radiologists were the lowest among the four glandular types. The AI model established in this study has the lowest accuracy for P3 glandular classification, with an AUC value of only 0.713. The effectiveness of the AI-assisted reading system also significantly diminished. Although the PPVs of the attending and resident radiologists in group B were increased, the PPVs of the other radiologists did not show significant improvement. For group A, the PPVs for the seniors and attending radiologists even slightly decreased with Ai-assisted. This finding suggests that the proportion of glandular tissue in the images further increases, and the image background exhibits moderate heterogeneity. distinguishing P3 glands from P2 and P4 glands becomes particularly challenging. The proposed AI system provides limited help for radiologists with considerable experience with P3 glands but does improve the reading capability of attending and resident radiologists in group B.
For the P4 glands, the image background predominantly composed of hypoechoic glandular tissue, which reduces the difficulty for radiologists to visually distinguish this type of gland. Consequently, the specificity of image reading for both groups of radiologists significantly improvement, particularly for Group A, where specificity approached 98%. However, the sensitivity and PPVs for all the radiologists decreased, with the average PPV being the lowest among the four glandular types. With Ai-assisted, there was no improvement in sensitivity, but the PPVs increased to varying degrees. Notably, the mean PPV for the group B radiologists even matching that of the group A radiologists. This finding indicates that for P4 glands, non-breast radiologists in group B benefit more from AI assistance, achieving reading capabilities comparable to those of breast radiologists.
This study also has several limitations. First, our results are based on a single-centre dataset, and different datasets may yield varied results. In future research, the model could be validated with multicentre datasets to improve its generalizability. Second, this study focused on two-dimensional static ultrasound images, which may not fully reflect the participant’s true glandular background. In future research, AI-assisted models for glandular classification on the basis of volumetric ultrasound32 or dynamic video data should be developed, which would provide a more comprehensive representation of the background of the breast. In addition, the performance of non-breast specialists and breast specialists in Ai-assisted glandular tissue classification across different ultrasound devices has yet to be explored. Understanding how these factors interact and influence the classification accuracy is crucial for the widespread implementation of Ai -assisted technologies in clinical practice.
In conclusion, our study demonstrated that the ResNet 101 classification model can augment the ability of all radiologists, especially non-breast radiologists, to classify GTC. By doing so, it can further assist in the identification of women with dense breast tissue and high glandular tissue content. This, in turn, can play a pivotal role in assessing the potential risk of breast cancer, thereby potentially leading to more timely and effectively preventive and diagnostic measures.
Data availability
The datasets generated and analysed during the current study were not publicly available but were available from the corresponding author on reasonable request.
References
Harvey, J. A. & Bovbjerg, V. E. Quantitative assessment of mammographic breast density: relationship with breast cancer risk. Radiology 230, 29–41 (2004).
Wang, A. T. et al. Breast density and breast cancer risk: A practical review. Mayo Clin. Proc. 89 (4), 548–557 (2014).
Sickles, E. A. The use of breast imaging to screen women at high risk for cancer. Radiol. Clin. North. Am. 48 (5), 859–878 (2010).
Holland, K. et al. Quantification of masking risk in screening mammography with volumetric breast density maps. Breast Cancer Res. Treat. 162 (3), 541–548 (2017).
Jiang, S. et al. Longitudinal analysis of change in mammographic density in each breast and its association with breast cancer risk. JAMA ONCOL. 9 (6), 808–814 (2023).
Berg, W. A. et al. ACRIN 6666 investigators. Combined screening with ultrasound and mammography vs mammography alone in women at elevated risk of breast cancer. JAMA 299 (18), 2151–2163 (2008).
Stavros, A. T. Breast Ultrasound, 65–78 (Lippincott Williams & Wilkins, 2004).
Vreemann, S. et al. Amount of fibroglandular tissue FGT and background parenchymal enhancement BPE in relation to breast cancer risk and false positives in a breast MRI screening program: A retrospective cohort study. Eur. Radiol. 29 (9), 4678–4690 (2019).
Degnim, A. et al. Abstract 155: Density of breast lobules in benign breast tissue and association with future breast cancer risk. Cancer Res. 73 (8), 155–155 (2013).
Chen, J. H. et al. Breast density analysis for whole breast ultrasound images. Med. Phys. 36 (11), 4933–4943 (2009).
Kim, W. H. et al. Ultrasonographic assessment of breast density. Breast Cancer Res. Tr. 138 (3): 851–859 (2013).
Uematsu, T. et al. Preliminary study of standardized semiquantitative method for ultrasonographic breast composition assessment. J. Med. Ultrason. 51 (3): 497–505 (2024).
Lee, S. H. et al. Glandular tissue component and breast cancer risk in mammographically dense breasts at screening breast US. Radiology. 301(1), 57–65 (2021).
Lee, S. H. & Moon, W. K. Glandular tissue component on breast ultrasound in dense breasts: A new imaging biomarker for breast cancer risk. Korean J. Radiol. 23 (6), 574–580 (2022).
Kim, W. H. et al. Background echotexture classification in breast ultrasound: inter-observer agreement study. Acta Radiol. 58 (12), 1427–1433 (2017).
Cruz Rivera, S. et al. SPIRIT-AI and CONSORT-AI Working Group. Guidelines for clinical trial protocols for interventions involving artificial intelligence: The SPIRIT-AI extension. Lancet Digit Health. 2 (10), 549–560 (2020).
Chartrand, G. et al. Deep learning: A primer for radiologists. Radio Graphics. 37, 2113–2131 (2017).
Kenig, N., Monton Echeverria, J. & Muntaner Vives, A. Artificial intelligence in surgery: A systematic review of use and validation. J. Clin. Med. 13 (23), 7108 (2024).
Li, H., Zhao, J. & Jiang, Z. Deep learning-based computer-aided detection of ultrasound in breast cancer diagnosis: A systematic review and meta-analysis. Clin. Radiol. 79, 1403–1413 (2024).
Angelone, F. et al. A machine learning approach for breast cancer risk prediction in digital mammography. Appl. Sci. (Basel). 14 (22), 10315 (2023).
Haji Maghsoudi, O. et al. Deep-LIBRA: an artificial-intelligence method for robust quantification of breast density with independent validation in breast cancer risk assessment. Med. Image Anal. 73 (2021).
Chang, K. et al. Multi-Institutional assessment and crowdsourcing evaluation of deep learning for automated classification of breast density. J. Am. Coll. Radiol. 17 (12), 1653–1662 (2020).
Qi, Y. et al. Morph_SPCNN model and its application in breast density segmentation. Multimed. Tools Appl. (2020).
Pawar, S. D. et al. Multichannel densenet architecture for classification of mammographic breast density for breast cancer detection. Front. Public. Health. 10, 885212 (2022).
Deng, J. et al. Classification of breast density categories based on SE-Attention neural networks. Comput. Method Prog. Biol.. 193, 105489 (2020).
Grovik, E. & Hoff, S. R. Editorial for breast MRI background parenchymal enhancement categorization using deep learning: outperforming the radiologist. J. Magn. Reson. Imaging. 56 (4), 1077–1078 (2022).
Van der Velden, B. H. M. et al. Volumetric breast density estimation on MRI using explainable deep learning regression. Sci. Rep. 10 (1), 18095 (2020).
Sickles, E. A. et al. ACR BI-RADS mammography. In ACR BI-RADS Atlas, Breast Imaging Reporting and Data System. (American College of Radiology, 2013).
Yala, A. et al. A deep learning mammography-based model for improved breast cancer risk prediction. Radiology. 292 (1), 60–66 (2019).
McKinney, S. M. et al. International evaluation of an AI system for breast cancer screening. Nature. 577 (7788), 89–94(2020).
Sexauer, R. et al. Diagnostic accuracy of automated ACR BI-RADS breast density classification using deep convolutional neural networks. Eur. Radiol. 33, 4589–4596 (2023).
Kim, J. et al. Comparison of the background echotexture between automated breast ultrasound and handheld breast ultrasound. Medicine 101 (27), e29547 (2022).
Funding
Funded by the Hangzhou Biomedicine and Health Industry Development Support Science and Technology Special Project (No. 2022WJC248).
Ethics declarations
Competing interests
The authors declare no competing interests.
Additional information
Publisher’s note
Springer Nature remains neutral with regard to jurisdictional claims in published maps and institutional affiliations.
Electronic supplementary material
Below is the link to the electronic supplementary material.
Rights and permissions
Open Access This article is licensed under a Creative Commons Attribution-NonCommercial-NoDerivatives 4.0 International License, which permits any non-commercial use, sharing, distribution and reproduction in any medium or format, as long as you give appropriate credit to the original author(s) and the source, provide a link to the Creative Commons licence, and indicate if you modified the licensed material. You do not have permission under this licence to share adapted material derived from this article or parts of it. The images or other third party material in this article are included in the article’s Creative Commons licence, unless indicated otherwise in a credit line to the material. If material is not included in the article’s Creative Commons licence and your intended use is not permitted by statutory regulation or exceeds the permitted use, you will need to obtain permission directly from the copyright holder. To view a copy of this licence, visit http://creativecommons.org/licenses/by-nc-nd/4.0/.
About this article

Cite this article
Yan, H., Dai, C., Xu, X. et al. Using artificial intelligence system for assisting the classification of breast ultrasound glandular tissue components in dense breast tissue. Sci Rep 15, 11754 (2025). https://doi.org/10.1038/s41598-025-95871-5
Received:
Accepted:
Published:
DOI: https://doi.org/10.1038/s41598-025-95871-5