
ESM-Ezy: a deep learning strategy for the mining of novel multicopper oxidases with superior properties
作者:Wang, Yajie
Introduction
Enzymes are increasingly playing pivotal roles across diverse industries, including food, agriculture, chemical, and pharmaceutical sectors. Despite the successful use of various enzymes, their catalytic properties often do not meet the stringent demands of diverse industrial applications. Directed evolution has been effectively employed to enhance enzymatic catalytic properties. However, the lack of high-throughput screening methods makes the process labor-intensive and costly in many cases. Thanks to advances in next-generation sequencing, the UniProtKB now encompasses over 227 million protein sequences, including more than 214 million entries complemented by AlphaFold-predicted structures1. Therefore, discovering advanced enzymes from UniProtKB could offer advanced biocatalysts ready for direct applications or serve as prime candidates for subsequent directed evolution, potentially streamlining the follow-up extensive engineering processes.
Strategies for enzyme mining based solely on protein sequence information often led to inaccuracies in function annotations despite extensive sequence data collections from a wide array of organisms. Traditional bioinformatic tools excel at identifying protein domains and assigning gene ontology terms but face challenges in accurately predicting functions for enzymes with low sequence similarity to the characterized ones2,3. Consequently, these enzymes remain underexplored, highlighting the need for a convenient strategy to accurately identify enzymes with low sequence similarities and investigate the likelihood of discovering novel enzymes with enhanced properties from this pool.
Deep learning presents a promising avenue for establishing connections between protein sequences and their functions, particularly for proteins exhibiting low sequence similarities to the previously characterized entities. By leveraging the structural similarities between protein sequences and natural language, the development of protein language models (PLMs) has emerged as a powerful approach to addressing the challenges in predicting protein structure and function4,5,6. One such model, evolutionary scale modeling (ESM-1b), is designed to learn an embedding space from extensive protein sequence databases, enabling the Euclidean distance within this space to reflect functional similarities7,8. These embeddings, numerical vectors derived from diverse amino acid sequences by PLMs, encapsulate critical protein properties9,10. Recently, ESMs have been successfully utilized in protein engineering11,12,13, enzyme function classification14, and remote homology prediction4. However, strategies for discovering enzymes with improved catalytic properties compared to existing ones are rarely developed15,16. Since low sequence similarity can indicate structural and functional novelty, potentially leading to breakthroughs in properties, we aimed to develop a sequence-based, highly accurate sequence-based in silico tool for discovering enzymes with enhanced catalytic properties from collections with low sequence similarity.
Multicopper oxidases (MCOs) are key biocatalysts widely used in food and chemical industries. In this study, we developed ESM-Ezy, a deep learning strategy assisted by ESM-1b, to explore novel MCOs with low sequence similarity for improved catalytic properties at a high success rate. By fine-tuning ESM-1b with a small but high-quality dataset and selecting candidates based on shorter Euclidean distances to the query enzymes (QEs), we successfully identified new MCOs with low sequence similarity, mostly below 35%, exhibiting superior catalytic properties. Almost 89% of the tested MCOs catalyzed 2,2’-Azino-bis (3-ethylbenzothiazoline-6-sulfonic acid) diammonium salt (ABTS) oxidation successfully, with 44% of them showing enhancements in at least one catalytic property compared to the QEs, including higher catalytic efficiency, improved heat and organic solvents tolerance, and a broader pH range. We identified Sulfur as one of the most heat-resistant MCOs reported so far17,18, with a remarkable half-life of 156.9 min at 80 °C, and characterized Bfre with a unique Cu-Mn heteroatom center for the first time. Furthermore, we evaluated the performance of newly discovered MCOs in mediator-free bioremediation applications. 53% of the MCOs decolorized Remazol Brilliant Blue R (RBBR) more efficiently than the QEs17. Talbi degraded Chloramphenicol (CAP) at room temperature and outperformed the previous fungal systems19. Additionally, Bcece demonstrated a capacity to degrade 39.4% of aflatoxin B1 (AFB1) after 48 h of incubation, exhibiting superior mediator-free degradation efficacy in comparison to other bacterial MCOs under mild conditions20. In addition to MCOs, 40% of l-Asparaginase enzymes discovered by ESM-Ezy outperformed their QE in terms of specific activity and catalytic efficiency. Overall, ESM-Ezy assisted us in enriching the libraries of MCOs with both improved catalytic activities and structural diversities, facilitating their application in various industrial settings.
Results
Development of a deep learning model to identify MCOs with low sequence similarities
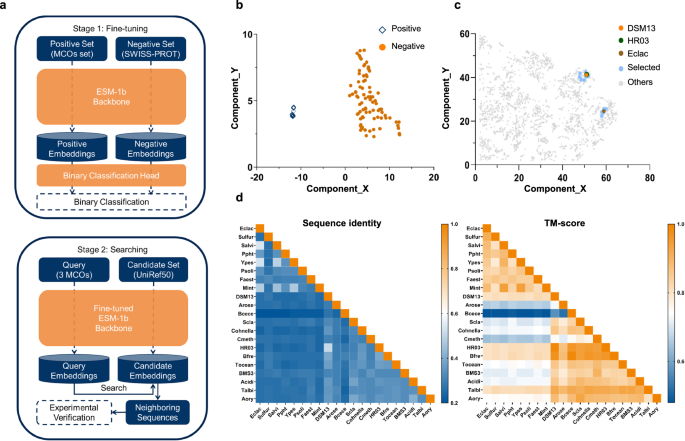
In this study, a two-stage strategy named ESM-Ezy was developed, involving fine-tuning and searching, to discover novel MCOs from an extensive sequence database (Fig. 1a). Initially, sequence embeddings were extracted from the transformer layers of ESM-1b, and a binary classification layer was incorporated to distinguish MCOs from other sequences in the database. The fine-tuning stage utilized a high-quality positive dataset of 147 characterized MCOs from literature, along with a large negative dataset of 550,000 non-MCO sequences from Swiss-Prot. This process swiftly reached optimal accuracy and demonstrated significant robustness based on our analysis of five-fold cross-validation (Fig. S1, Tables S4 and S5). Additionally, dimensionality reduction employing the UMAP algorithm21 effectively displayed distinct clustering of MCOs, confirming the model’s efficacy (Fig. 1b).

a In the fine-tuning stage, the ESM-1b model was fine-tuned through binary classification on positive and negative data sets. In the searching phase, the Fine-tuned ESM-1b Backbone was used to generate query embeddings and candidate embeddings, and Euclidean distance in the embedding space was employed to identify the closest sequences for further validation. In the searching stage, the Binary Classification Head was omitted, and the ESM-1b Backbone from the fine-tuning stage was retained as the Fine-tuned ESM-1b Backbone. b After fine-tuning, the MCOs cluster (positive) became distinctly separated from the non-MCOs cluster (negative). c The embeddings of the selected sequences generated by the fine-tuned model clustered closely with the QEs. d The sequence and structure similarity matrix of the MCOs and QEs. The newly discovered enzymes exhibit low sequence similarity but are structurally conserved. Source data are provided as a Source Data file.
Subsequently, to identify novel MCOs with enhanced catalytic properties in the searching stage, three representative MCOs, specifically Eclac from Escherichia coli K12 (UniProt: P36649)22, HR03 from Bacillus sp. HR03 (UniProt: B9W2C5)23 and DSM13 from Bacillus licheniformis DSM13 (UniProt: Q65MU7)24 were selected as QEs. These QEs, along with all sequences from UniRef50, were embedded into the fine-tuned ESM-1b backbone. Euclidean distances were calculated between the UniRef50 sequences and the QEs, leading to the selection of 18 neighboring sequences with similarity in protein semantic space for further analysis (Tables S2 and S3). It is important to note that the primary goal of the fine-tuned classification task in the first step is to learn a representation space for sequences, rather than merely predicting whether a sequence is positive or negative. Given that the UniRef50 database is extremely large, even applying stringent criteria to filter positive candidates yields thousands of sequences, which is impractical for wet lab experiments. To address this issue, we employed QEs to identify the nearest sequences within the fine-tuned representation space for wet lab experimentation. After fine-tuning, the selected candidates are much more closely positioned around the QEs compared to those in the pretrained and random ESM-1b model, which indicates the necessity of the fine-tuning step (Fig. 1c, Fig. S2).
The majority of the selected MCOs showed low sequence similarities both to the QEs and among themselves, ranging from 25% to 35% (Fig. 1d). Despite low sequence similarities, high structure similarity (TM-score > 0.8) was observed (Fig. 1d). Enzymes with low sequence similarity but conserved structures are often considered to possess evolutionary novelty, and the selected enzymes and their mutants in this study have not been reported previously. Phylogenetic analysis indicated that the selected MCOs are distributed across various bacterial MCO groups and do not cluster closely with their respective QEs (Fig. S3). This suggests that MCOs with shorter Euclidean distances may not be closely related evolutionarily. Additionally, analysis of sequence similarity networks (SSN) within UniRef50 indicated that MCOs with close evolutionary relationships do not consistently exhibit short Euclidean distances (Fig. S4). Finally, AlphaFold2 structures of the selected MCOs and the QEs were used for analyzing their structural relationships. A taxonomic tree (Fig. S5a) categorized the MCOs into six clades, with over half located in categories separate from those of the QEs.
The characterization of selected MCOs revealed them as superior catalysts compared to QEs
To determine if this strategy could yield new MCOs with enhanced catalytic properties compared to the QEs, all selected MCOs were successfully expressed and purified using E. coli (BL21). We conducted a comprehensive and quantitative assessment of the catalytic properties of these MCOs using the standard ABTS oxidation reaction. Almost all MCOs effectively oxidized ABTS, with approximately 40% of MCOs in each series demonstrating superior catalytic efficiency or increased thermal stability relative to their QEs (Fig. 2a, Table. S6). Notably, several candidates stood out in this study: Sulfur, Bcece, Tocean, and Bfre. As shown in Fig. 2a, Scla exhibited a 3.0-fold longer half-life at 80 °C compared to DMS13 while maintaining a higher kcat and specific activity value. Additionally, Tocean and Bfre demonstrated catalytic efficiencies 5.8 and 95.2 times higher than that of HR03, respectively, while maintaining comparable thermostability. Remarkably, Sulfur was found to be 32.9 times more active than Eclac and stands out as one of the most heat-tolerant MCOs reported to date20, with a half-life of 156.9 ± 9.0 min at 80 °C.

a Kinetic parameter of representative MCOs. b Profiles of relative activities under different pH. c Profiles of relative activity under different temperatures. d Profiles of relative activity under different organic solvents. The bar plots show mean ± standard deviation (n = 3 biological replicates). The query enzyme of each series is labeled in dark blue. Source data are provided as a Source Data file.
Given that MCOs are often utilized in industrial settings with harsh conditions, we evaluated the optimal operating temperatures and pH, as well as the organic solvent tolerance of both newly discovered MCOs and their corresponding QEs. Like QEs, Sulfur, Bcece, Tocean, and Bfre showed optimal activity at temperatures between 80 and 90 °C. Notably, Sulfur also maintained relatively high activity at lower temperatures, ranging from 30 to 50 °C (Fig. 2b). Bacterial MCOs typically catalyze ABTS oxidation under acidic conditions and lose activity as the pH increases. However, in our study, Sulfur and Mint achieved optimal activity at a pH of 5.0 and remained active even when the pH levels were as high as 8 (Fig. 2c). Furthermore, Sulfur, Tocean, Slac, and Bfre demonstrated exceptional resistance to organic solvents such as methanol, ethanol, acetonitrile, dimethyl sulfoxide (DMSO) and acetone. After a 2-day incubation, they retained at least approximately 80% of their initial activity in 50 v/v% tested organic solvents, surpassing the performance of both QEs. The broader operational temperature and pH range, as well as enhanced organic solvent tolerance, highlight the potential of these enzymes for robust industrial applications.
Overall, Sulfur, Tocean, Bfre, Bcece, and Scla outperform both the QEs and most reported MCOs, excelling in at least two factors among catalytic efficiency, heat and pH tolerance, and organic solvent resistance. Among them, Sulfur significantly outperforms all QEs across all catalytic properties.
The structural characterization of the top-performing MCOs reveals unique features
We resolved the crystal structure of Bfre (PDB:8Z5B) and Sulfur (PDB: 8Z59) due to their exceptional catalytic properties. The arguments for X-ray diffraction and structural refinement are listed in Tables S9 and S10. As illustrated in Fig. 3, both Bfre and Sulfur have Greek key β-barrel domains interconnected by α-helices and extensive coiled sections. They also have a highly conserved mononuclear copper ion center (T1 Cu) essential for substrate oxidation and a Cu-Cys-His pathway facilitating electron transfer. While these structural features are typical for MCOs from E. coli and Bacillus species25,26, Bfre and Sulfur possess unique characteristics that warrant further investigation.

a The crystal structures of Bfre and Sulfur, including their active centers. b Superimposition of Sulfur (PDB: 8Z59, colored in orange) with Eclac (AF-P36649-F1-model_v4, colored in cyan). The loop region of Ile335–Val340 (Sulfur) and Asp333–Ala384 (Eclac) are highlighted with B-factors of the regions represented as thickness. Source data are provided as a Source Data file.
The conventional active center of MCO comprises four copper ions, including a T1 Cu and a trinuclear Cu cluster27. The trinuclear Cu cluster consists of one T2 Cu ion and two T3 Cu ions, which bind and reduce molecular oxygen to water28. Differently, Bfre’s active center contains only three metal ions: one T1 Cu and a unique diatomic center composed of one Cu ion and one Mn ion. Atomic absorption spectroscopy revealed that the MCO from Trametes hirsuta LG-9 contains copper and manganese, but it could not pinpoint the exact location of these metals29. Meanwhile, the PDB database has not yet included any MCOs with heteronuclear active centers. Therefore, this unique configuration distinguishes it from all previously documented MCO active centers30(Fig. 3a and Figs. S6 and S9).
Sulfur is structurally similar to Eclac, with a TM-score of 0.92, despite a low sequence similarity of 28.49% (Fig. 3a). A detailed structural comparison between Sulfur and Eclac reveals a significant difference in a loop region, where Eclac contains an additional 36 amino acid residues compared to Sulfur. Molecular dynamic simulations were conducted on both enzymes further to investigate the impact of this region on their properties. Root mean square fluctuation (RMSF) analysis indicated notable instability within the D333–A384 loop region of Eclac (0.07 < RMSF < 0.34), whereas the shorter I335-V340 loop in Sulfur exhibited greater stability (0.10 < RMSF < 0.18) (Fig. S8). Additionally, the B-factor of the I335–V340 loop in Sulfur is lower than that of the D333–A384 loop in Eclac (Fig. 3b), indicating reduced mobility in Sulfur’s corresponding region. The contribution of shorter loops to enhanced thermal stability in MCOs has not been addressed in other studies. Furthermore, Sulfur also features 1.6 times more salt bridges than Eclac (Table S11), underscoring its exceptional thermostability31.
Applications of newly mined MCOs for bioremediations
To assess the efficacy of this strategy in identifying more efficient enzymes for potential industrial use, we selected enzymes from each group and assessed their catalytic performance in key bioremediation applications: organic dye decolorization, antibiotic, and toxin degradation. Specifically, we evaluated remazol brilliant blue R (RBBR), chloramphenicol (CAP), and aflatoxin B1 (AFB1) as representatives for each category. In contrast to the traditional methods, we performed bioremediation tests without a mediator to reduce unnecessary pollution. Our findings showed that multiple MCOs in each series outperformed the corresponding QSs in removing these environmentally harmful compounds (Fig. 4).

a Evaluation of DSM13, Eclac and HR03 Series on RBBR Decolorization (from left to right). b Comparison of chloramphenicol degradation by HR03 series. c Comparison of Aflatoxin B1 degradation by DSM13 series. d Live/dead cell staining evaluation on HepG2 cells with Aflatoxin B1 (Calsin AM: green, PI: red). e Cell viability assessment with different concentrations of aflatoxin B1. The line, bar, and violin plots show mean ± standard deviation (n = 3 biological replicates). Asterisk (*) denotes statistical significance (P < 0.05, one-tailed test). Exact p-values: 10 mM, P = 0.096; 50 mM, P = 0.002. QE in each series is highlighted in special color, with Ctrl representing control groups. Source data are provided as a Source Data file.
RBBR, an anthraquinone dye commonly used in the textile industry, harms aquatic and vegetative life. In a two-hour test, all MCOs from three series catalyzed rapid decolorization within the first 10 min (Fig. 4A), outperforming some reported bacterial and fungal MCOs32,33,34. Each series featured multiple new enzymes that catalyzed faster decolorization rates and higher decolorization percentages than Eclac, DSM13, and HR03. Notably, in the DSM13 series, three out of five MCOs showed superior performance despite DSM13 itself exhibiting minimal activity. Sulfur decolorized 46.7% of RBBR within 10 min, marking it the most efficient MCO reported to date for mediator-free RBBR decolorization22,34,35.
Furthermore, CAP is known for its stability even at elevated temperatures18. All tested MCOs degraded CAP at room temperature. In the HR03 series, four out of five MCOs performed better than the QEs, with Talbi achieving the highest degradation percentage of approximately 24.3% within 48 h (Fig. 4b), surpassing the performance of fungal MCO-catalyzed systems in the presence of mediators19.
We also evaluated the degradation efficiency of AFB1, a major agricultural toxin. In the Eclac series, Psoli, Mint, and Faest outperformed the query, degrading nearly 33.5% AFB1 after 48 h of treatment. In the DSM13 series, all candidates showed better degradation capacity than the query, with Bcece showing the highest capacity at 39.4% (Fig. 4c). To assess the cytotoxicity of AFB1 and its degradation products, we incubated HepG2 cells with media supplemented with 10 mM and 50 mM AFB1 treated with and without Bcece, respectively. After a 48-h incubation period, there was an observed increase in the viability of HepG2 cells, with the survival rate rising from 116.1 ± 5.6% to 126.4 ± 6.1% and from 27.6 ± 3.4% to 65.3 ± 8.5% (Fig. 4d, e). This increase indicates a reduction in the cytotoxic effects associated with the degradation products of AFB135.
Discussion
Researchers often randomly select enzymatic candidates from clusters identified through SSN analysis. However, this trial-and-error approach is generally inefficient and can prolong the discovery process. In addition, although PLMs have recently been successfully utilized to guide protein engineering12, antibody design11, enzyme functional assessment (such as CLEAN36 and TM-Vec14), and remote homology detection (like PLMSearch)4,14, they have not been used to explore the catalytic properties of enzymes in low sequence homology regions. ESM-Ezy addressed these previously unmet challenges.
In this study, ESM-Ezy utilizes a fine-tuned ESM-1b model and calculations of similarity in protein semantic space to efficiently discover novel MCOs with enhanced catalytic properties with a high success rate. Compared to the QEs, 44% of the selected MCOs outperformed the QEs and surpassed most previously reported MCOs in at least one property, including catalytic efficiency, heat and organic solvent tolerance, and pH stability. Notably, the enzyme Sulfur significantly outperformed all QEs across all evaluated catalytic properties. For bioremediation applications, approximately 44% of the MCOs decolorized RBBR more efficiently, while 22% and 33% MCOs demonstrated superior CAP and AFB1 degradation capabilities, respectively. For comparison, five sequences located in the same SSN cluster with Eclac but with a remote Euclidean distance based on ESM-Ezy analysis were tested, and activity was not detected (Fig. S4, Table S7). This indicates that ESM-Ezy improves the likelihood of identifying candidates with enhanced catalytic properties compared to conventional SSN-based strategies.
We found that MCOs representations from randomly initialized, pretrained, and finetuned models increasingly clustered with QEs. This indicates that in well-trained models, Euclidean distance in the model space reflects more semantic information related to MCOs (Fig. S2). These results are consistent with findings from other studies14,37 and suggest that Euclidean distance could serve as a unique metric for assessing enzyme functionality, distinct from methods based on structural and sequence similarities alone. Moreover, it is noteworthy that the majority of MCOs with improved catalytic properties shared only 25–35% sequence similarity with the QEs. For example, Sulfur (TM-score: 0.91, identity: 0.26), Scla (TM-score: 0.82, identity: 0.32), Bfre (TM-score: 0.96, identity: 0.39), Tocean (TM-score: 0.85, identity: 0.36), and Bcece (TM-score: 0.57, identity: 0.27) demonstrate low sequence similarity to their corresponding QEs. This suggests that enzymes with breakthrough properties might be often found in regions characterized by low sequence similarity but high structural conservation.
To evaluate the general applicability of the ESM-Ezy method in our study, we applied it to l-Asparaginase (l-asparagine amidohydrolase; EC 3.5.1.1) that catalyzes the hydrolysis of l-asparagine into ammonia and l-aspartic acid38. This enzyme has shown significant therapeutic potential, particularly in the treatment of childhood acute lymphoblastic leukemia39. As described above, we finetuned the ESM-1b to search l-asparaginases (Table S12). We selected an l-asparaginase (UniProt: O34482) from Bacillus subtilis 168 as the QE and identified five candidate enzymes. Compared to QE, A0A3N5F6J4, and H1D2G7 exhibited approximately 2.0-fold and 4.1-fold higher specific activity and 2.0-fold and 3.0-fold higher kcat, respectively (Table S13). These results suggest that ESM-Ezy can successfully identify enzymes beyond oxidoreductases with superior catalytic performance.
In conclusion, our ESM-Ezy integrates ESM-1b with experimental validation to study enzymes with low sequence similarities, leading to the successful identification of novel and high-performing MCOs and l-Asparaginases. This approach suggests that utilizing PLMs along with the calculation of Euclidean distance to explore low sequence similarity space is a promising strategy for discovering high-performance enzymes and uncovering new enzymes with distinctive structural features. This technique has the potential to be extended to other enzyme families, speeding up the discovery of innovative biocatalysts with superior properties.
Methods
Materials
All chemicals used in this study were of analytical grade or higher. Plasmids for the expression of various multicopper oxidases (MCOs) were synthesized by SynbioB (Tianjin, China). LB broth powder, Isopropyl β-d-1-thiogalactopyranoside (IPTG, Cat. No. A600168), and kanamycin (Cat. No. A506636) were obtained from Sangon Biotech (Shanghai, China). 2,2’-Azino-bis (3-ethylbenzothiazoline-6-sulfonic acid) diammonium salt (ABTS, Cat. No. A109612) and Remazol brilliant blue R (RBBR, Cat. No. R169089) were obtained from Aladdin Biotech (Shanghai, China). Chloramphenicol (Cat. No. A600118) and Aflatoxin B1 (Cat. No. A832707) were obtained in HPLC grade from Solarbio (Beijing, China) and Innochem (Beijing, China), respectively. Dulbecco’s Modified Eagle Medium (DMEM, GibcoTM), fetal bovine serum (FBS, GibcoTM), and Penicillin–Streptomycin (GibcoTM) were purchased from Thermo Fisher (USA).
Development of a two-stage strategy
In our ESM-Ezy strategy, the objective of the fine-tuning stage differs slightly from other methods, as it focuses on learning a representation space for sequences rather than simply predicting whether a sequence is positive or negative. Given the vast size of the Uniref50 dataset, even with stringent criteria to filter positives, the number of resulting candidates remains in the thousands, rendering wet lab experiments impractical due to the sheer volume. To mitigate this challenge, during the searching stage, we employed QEs to identify the nearest sequences within the fine-tuned representation space from the previous stage, thereby obtaining a manageable number of sequences for wet-lab experimentation.
Datasets construction, model training, test and cross-validation
The positive dataset of MCOs consisted of 147 sequences reported in the literature. This dataset was randomly divided into training and test subsets, consisting of 117 sequences (~80%) and 30 sequences (~20%), respectively. The negative dataset of MCOs was sampled from the Swiss-Prot database (Release 2022_02), based on the assumption that unlabeled databases are likely to be negatives, a premise supported by findings in both the recommendation40,41 and natural language processing area42. The sequences in Swiss-Prot have been scientifically verified; thus, sequences without MCO labels and with low sequence similarities compared to MCOs are very likely to be negative. Sequences labeled as MCOs and those with sequence identities exceeding 40% relative to the positive set were excluded, resulting in a total of 567,235 sequences. From this adjusted negative set, 1000 sequences were randomly selected to form the test negative set, with the remaining 566,235 sequences designated as the training negative set.
We conducted a fivefold cross-validation to validate the robustness of our pipeline. The positive datasets were divided fivefold while keeping the negative datasets for training and test unchanged. In each experiment, onefold of the positive dataset was set aside as the test set, and the remaining folds were used as the training set. We then measured the ROC-AUC score, accuracy, precision, recall, and F1-score based on this setup (Table S5). The high average ROC–AUC of 0.9838 and F1-score of 0.9787 indicate the strong robustness.
The UniRef50 database was utilized as our candidate pool. We used the fine-tuned binary classification model to sift through the database and identify predicted positive sequences. Subsequently, we used their representations to calculate the Euclidean distances within the high-dimensional semantic space, facilitating the comparison between QEs and the candidate sequences. This method allowed for the efficient identification of potential biocatalysts by assessing their proximity in a semantic landscape shaped by protein function and structure.
Dynamic negative sampling
To balance the large volume of negative data against the smaller positive sample set, a dynamic negative sampling strategy43 was adopted. Specifically, for each epoch, we sampled a number of negative samples equal to the positive samples (117 for training) from the negative sample pool of adjusted training Swiss-Prot database (566,235 sequences). These were then shuffled with the positive samples for training. This approach ensures that the model is exposed to new negative samples for each training epoch rather than a fixed negative set, thus addressing data imbalance and enhancing the robustness of the training process. By applying dynamic negative sampling, even if there were a few unknown positive samples in the negative sample pool, the likelihood of these being sampled during training would be extremely low due to their rarity. During the training process, the learning rate was set at \(1\times {10}^{-5}\) and the Adam optimizer was utilized44.
Calculation of TM-score and sequence identity
We utilized the TM-score to quantify structural similarity and sequence identity to measure sequence similarity. For the calculation of the TM-score, we employ a tool known as TM-align45, a structural alignment program designed to compare two proteins with potentially differing sequences. For sequence identity calculation, Bio.pairwise246 module was employed and the sequence identity between all sequence pairs were calculated.
Protein expression and purification
Plasmids and strains are listed in Table S1. Synthetic genes were inserted into the BamH I–Hind III sites of plasmids pET-28a or pET-28a-sumo. Kanamycin (50 μg/mL) was added to the growth media when necessary. E. coli BL21(DE3) cultures transformed with expression plasmids were grown overnight, then inoculated into LB medium supplemented with 1 mM CuCl2 and incubated at 37 °C with continuous shaking (250 rpm) until late logarithmic phase. Induction of target protein expression was initiated by adding IPTG (final concentration 0.1 mM), followed by further incubation at 16 °C for 16 h. After centrifugation at 8000×g for 10 min at 4 °C, cells were resuspended in Tris-HCl buffer (20 mM Tris-HCl, 500 mM NaCl, pH 7.6) and subjected to sonication. The resulting crude extract was clarified by additional centrifugation steps to remove cell debris.
All purification steps were performed at 4 °C. The crude enzymes were purified with an IMAC column (HisTrapTMHP, 5 mL, Cytiva) using an FPLC system (ÄKTATM Pure, Cytiva). After washing with buffer A (20 mM Tris-HCl, 300 mM NaCl, 20 mM imidazole, pH 7.6), the target enzyme was eluted with a linear gradient of buffer B (20 mM Tris-HCl, 300 mM NaCl, 500 mM imidazole, pH 7.6). The purified enzymes were concentrated and desalted by ultrafiltration with an exchange buffer (300 mM NaCl, 20 mM Tris-HCl, pH 7.6). The samples were then analyzed by SDS-PAGE. Enzyme concentration was determined by Pierce™ BCA Protein Assay Kit47.
Enzyme assay
The specific activity of MCOs was evaluated at 37 °C using ABTS as the substrate. The assay solution comprised 40 mM ABTS in citrate-NaOH buffer (pH 4.0, 50 mM). The increase in absorbance resulting from the oxidation of ABTS at 420 nm per minute (ε420 = 36,000 M−1 cm−1) was recorded after the addition 0.1–1 μM enzymes, ensuring a linear increase in absorbance. One unit of enzyme activity was defined as the oxidation of 1 μmol of substrate per minute. Specific activity was calculated as units per milligram of protein. Enzyme activity was determined by analyzing the initial linear phase of the reaction curve. The kinetic parameters, including the Km and kcat of the recombinant enzyme, were determined by assessing the enzymatic activity under a gradient of with concentrations of 0.1–5 mM ABTS substrate concentrations. The Lineweaver–Burk plot was employed to fit the experimental data and calculate the Km and kcat parameters.
Effect of temperature and pH on enzymes
The optimal pH for MCO activity was determined at 37 °C using 50 mM citrate–phosphate buffer spanning a pH range of 3.0–8.0. The change in absorbance at 420 nm per minute was measured to determine enzyme activity. We set the highest activity as 100% for calculating the relative activity at each pH value. The optimum temperature for enzymatic activity of each enzyme was monitored across a temperature range from 40 °C to 90 °C. The maximum activity of each enzyme was set as 100% in order to calculate the relative activity at each temperature point.
Half-life of enzymes
Half-life of enzymes was assessed by incubating the purified enzyme (1 mg/ml) in 80 °C water bath with sampling at regular intervals. Residual activity (ΔA420/min/mg protein) was measured, and the activity ratio was calculated. Thermostability was evaluated at 80 °C. The experimental data was fitted to the inactivation equation:
$${ln}Y=-{k}_{d}X+b$$
(1)
where, Y is the percentage of the residual activity, X is time and kd is inactivation rate constant.
Then, half-life (t1/2) was calculated as:
$${t}_{1/2}={ln}2/{k}_{d}.$$
(2)
Effect of organic solvents on the activity of the MCOs
The impact of various chemicals on enzyme activity was evaluated by preincubating the enzyme (1 mg/ml) with 50% concentrations of organic solvents (methanol, ethanol, acetone, acetonitrile, and DMSO) for 48 h at room temperature. Enzyme tolerance to organic solvents was assessed as the relative residual activity ratio between treated and untreated samples.
Crystallization
For crystallization, enzymes were purified using a fast protein liquid chromatography (FPLC) system equipped with an immobilized metal affinity chromatography (IMAC) column (HisTrap™ HP) and a size exclusion column (Superdex™). The purified enzymes were subjected to crystallization trials using commercial crystal screening kits (PEGRx and Proplex). In each well of a 96-well plate (SWISSCI 3drop), equal volumes (150 nL) of enzyme solution and reservoir solution were mixed using the vapor-diffusion sitting-drop method at 16 °C. Initial crystallization hits were observed in several conditions after 7–10 days. Following several rounds of optimization, the best quality single protein crystals were harvested under varying conditions. For example, crystals of Sulfur were obtained from conditions containing 1% w/v Tryptone, 0.001 M sodium azide, 0.05 M HEPES sodium pH 7.0, and 12% w/v Polyethylene glycol 3350, while crystals of Bfre were grown in 0.1 M Tris pH 8.5 and 20% v/v Ethanol.
Diffraction data collection and structure refinement
For X-ray diffraction data collection, crystals of Bfre and Sulfur were briefly soaked in their respective reservoir solutions supplemented with 25% glycerol to enhance cryoprotection. The crystals were then mounted on loops and flash-frozen in liquid nitrogen for preservation. X-ray diffraction data were collected at the Shanghai Synchrotron Radiation Facility and processed using HKL2000 software48. The data-collection statistics are detailed in Supplementary Tables S8–S10. The closest homologous structure (PDB entry 6SYY49) to Sulfur, exhibited 43.9% sequence identity and 89.8% coverage. For Bfre, the closest structure (PDB entry 2FQG) showed 38.4% sequence identity and 77.5% coverage. The structures were solved by molecular replacement using the Phenix software suite50, utilizing models 6SYY and 2FQG. Initial phases were refined using rigid body refinement, followed by manual model rebuilding in COOT51. Subsequent rounds of refinement were conducted using the Phenix suite. The final coordinates and structure factors for Bfre and Sulfur have been deposited in the Protein Data Bank, accessible under the accession codes 8Z5B and 8Z59, respectively.
Molecular dynamics simulation
Due to the absence of certain segments in the Eclac crystal structure (1KV7, 2FQD, 5YS1), the three-dimensional configuration of Eclac was determined by AlphaFold52,53. The AlphaFold model exhibited strong alignment with the available crystal structures, with a low RMSD value further validating the model’s accuracy (Fig. S7). So, MD simulations were carried out for Eclac (AlphaFold: AF-P36649-F1-model_v4) and Sulfur (PDB: 8Z59) using Gromacs 2022.354,55,56. Each structure was placed in a box with a 0.8 nm margin and filled with tip3p water molecules57 and underwent 2000 steepest descent energy minimization steps. Then the systems were equilibrated and run for 50 ns with a 2 fs time step using the NPT ensemble at a temperature of 310.15 K, under the Amber ff14SB force field58, and each simulation was replicated 3 times. The trajectory was analyzed with Gromacs built-in tools. Graphical displays of the structures were visualized by PyMOL Molecular Graphics System (www.pymol.org).
Dye decolorization assay of MCOs
A solution of RBBR (10 mM in 50 mM sodium citrate buffer, pH 4.0) was prepared. For the experiments, RBBR solution was added to each well (7 μL/well, resulting in a final concentration of 100 μM), followed by the addition of the MCO solution (693 μL/well, 1 μM in 50 mM sodium citrate buffer). Each MCO candidate was tested in four wells, with supernatants sampled at intervals of 10, 30, 60, and 120 min. The reactions were conducted in deep-well 96-well plates incubated in an 85 °C water bath. All experiments were performed in triplicate. RBBR dye decolorization was measured using a UV–vis plate reader (Bio-Tek H1). To determine the maximal absorbance wavelength of RBBR dye, a solution of the dye (200 μL/well, 100 μM in 50 mM sodium citrate buffer) was transferred to 96-microwell plates, and the final spectral scanning was confirmed at an absorbance of 594 nm.
Chloramphenicol degradation assay of MCOs
To assess the degradation of chloramphenicol by MCOs, a reaction mixture was prepared by adding 677.4 μL of MCO solution (1 μM in 50 mM sodium citrate buffer, pH 4.0) to a 2 mL crimp vial, followed by the addition of 22.6 μL of chloramphenicol stock solution (1 mg/mL in ethanol). The vial was then agitated at 250 rpm at room temperature for 48 h. To terminate the reaction, each sample was heated at 95 °C for 20 min. Subsequently, the reaction mixture was filtered through a 0.22 μm PES membrane to remove the denatured enzyme. All experiments were conducted in triplicate. The degradation of chloramphenicol was analyzed using High-Performance Liquid Chromatography (HPLC, Shimadzu LC-20AT). The analysis included samples from both the control (untreated with MCOs) and those treated with MCOs. The mobile phase consisted of water, methanol, and acetic acid in a ratio of 55:45:0.1 (v/v/v). Chromatographic separation was achieved using an analytical reverse-phase C18 column (ZORBAX Eclipse Plus C18, 95 Å, 3.0 × 150 mm, 5 µm) equipped with a guard column (ZORBAX Eclipse Plus C18, 95 Å, 4.6 × 12.5 mm, 5 µm). The column temperature was maintained at 30 °C, and the analysis was performed with an injection volume of 10 μL, a flow rate of 0.5 mL/min, and detection at a wavelength of 278 nm.
Aflatoxin B1 degradation assay of MCOs
MCOs solution (697.8 μL, 1 μM in 50 mM sodium citrate buffer, pH 4.0) and aflatoxin B1 stock solution (2.2 μL, 1 mg/mL in DMSO) were added to 2 mL crimp vial, and the vial was shaken at 250 rpm at room temperature for 48 h. All experiments were performed in triplicate. Following incubation, the control (un-MCOs treated) and MCOs treated samples were analyzed by HPLC (Shimadzu LC-20AT) using acetonitrile: methanol: water (1: 1: 2, v/v/v) as mobile phase, an analytical reverse phase C18 column (ZORBAX Eclipse Plus C18, 95 Å, 3.0 × 150 mm, 5 µm) with a guard column (ZORBAX Eclipse Plus C18, 95 Å, 4.6 × 12.5 mm, 5 µm) served as stationary phase. The experiment was performed at room temperature with the column oven in 30 °C, 10 μL of injection volume at 0.5 mL/min flow rate, and the analyte was detected at wavelength 365 nm.
Aflatoxin B1 extraction for cytotoxicity assays
To further verify the degradation effect of the MCOs treatment, experiments with AFB1 samples at concentrations of 10 and 50 µM were repeated. Following MCOs treatment, the samples were extracted with an equal volume of chloroform, then dried under nitrogen gas, and redissolved in DMSO at one-tenth of the original chloroform volume. The samples were thoroughly vortexed to ensure complete dissolution for further analysis.
Cytotoxicity test of Aflatoxin B1
The cytotoxicity of AFB1 was tested via HepG2 (HB-8065), the human hepatocarcinoma cell line obtained from ATCC (Manassas, VA, USA)59,60. The cell was cultured in culture flakes by DMEM, which contained 10% FBS, 100 U/mL penicillin, and 0.1 mg/mL streptomycin, and placed into a 5% CO2 incubator at 37 °C. When proliferating up to 90% of culture flakes, HepG2 cells were harvested by washing with phosphate-buffered saline, trypsinization, resuspended, and diluted in DMEM (1:3 ratio). Cells were passed every week until they were stable enough for testing.
For the cell viability test, the extracts of different concentrations of AFB1 with MCOs Bcece treatment were mixed with culture media to get a final concentration of 1% DMSO and used as experimental groups. Cell viability was tested by cell counting kits (CCK-8, Beijing Lablead Biotech), which could count live cell numbers with formazan produced by dehydrogenase in the mitochondria. The cells were incubated with corresponding media for 24 h, and cell viability was detected according to the instructions of the manufacturer.
$${{{Cell}}\,{{viability}}}\,(\%)=\frac{\left({{OD}\,450\,{nm}}_{{Exp}.}-{{OD}450\,{nm}}_{{Blank}}\right)}{\left({{OD}\,450\,{nm}}_{{Ctrl}}-{{OD}\,450\,{nm}}_{{Blank}}\right)}\times 100\%$$
(3)
Fluorescence imaging analysis was evaluated using a standard AM/PI assay kit (Beijing Lablead Biotech) with Calcein AM to identify cells with metabolic activity and PI to assess the cell membrane integrity. After incubated with Calcein AM and PI solution, samples were observed under a fluorescence microscope (Keyence BZ-X810) at 490 ± 10 nm. The living and dead cells were stained green and red by Calcein AM and PI, respectively.
Statistics and reproducibility
All experiments were conducted at least three times, and error bars in the figures represent the standard errors. Statistical analysis was performed using a one-way analysis of variance (ANOVA) followed by a one-tailed t-test.
Reporting summary
Further information on research design is available in the Nature Portfolio Reporting Summary linked to this article.
Data availability
The atomic coordinates and associated density maps have been deposited in the Protein Data Bank (PDB) under accession codes 8Z5B and 8Z59. Molecular dynamics trajectories files also have been provided. The AlphaFold structure of Eclac P36649 was used in this study. Dynamics simulation trajectory files can be downloaded from https://doi.org/10.5281/zenodo.14808161. All data that support the findings of this study are provided in the Supplementary Information. Source data are provided with this paper.
References
Consortium, T. U. UniProt: the universal protein knowledgebase in 2023. Nucleic Acids Res. 51, D523–D531 (2023).
de Crécy-Lagard, V et al. A Roadmap for the Functional Annotation of Protein Families: A Community Perspective. (Oxford University Press, UK, 2022).
Shi, Z. et al. Data-driven synthetic cell factories development for industrial biomanufacturing. BioDesign Res. 2022, 9898461 (2022).
Liu, W. et al. PLMSearch: protein language model powers accurate and fast sequence search for remote homology. Nat. Commun. 15, 2775 (2024).
Bepler, T. & Berger, B. Learning the protein language: evolution, structure, and function. Cell Syst. 12, 654–669 (2021).
Su, J. et al. SaProt: Protein Language Modeling with Structure-aware Vocabulary. The Twelfth International Conference on Learning Representations (2024).
Rives, A. et al. Biological structure and function emerge from scaling unsupervised learning to 250 million protein sequences. Proc. Natl. Acad. Sci. USA 118, e2016239118 (2021).
Wang, H. et al. Scientific discovery in the age of artificial intelligence. Nature 620, 47–60 (2023).
Hie, B. L., Yang, K. K. & Kim, P. S. Evolutionary velocity with protein language models predicts evolutionary dynamics of diverse proteins. Cell Syst. 13, 274–285 (2022).
Hsu, C., Nisonoff, H., Fannjiang, C. & Listgarten, J. Learning protein fitness models from evolutionary and assay-labeled data. Nat. Biotechnol. 40, 1114–1122 (2022).
Hie, B. L. et al. Efficient evolution of human antibodies from general protein language models. Nat. Biotechnol. 42, 275–283 (2024).
He, Y. et al. Protein language models-assisted optimization of a uracil-N-glycosylase variant enables programmable T-to-G and T-to-C base editing. Mol. Cell 84, 1257–1270 (2024).
Meier, J., Rao, R., Verkuil, R., Liu, J., Sercu, T. & Rives, A. Language models enable zero-shot prediction of the effects of mutations on protein function. Adv. Neural Inf. Process. Syst. 34, 29287–29303 (2021).
Hamamsy, T. et al. Protein remote homology detection and structural alignment using deep learning. Nat. Biotechnol. 1, 1–11 (2023).
De Crécy-Lagard, V. et al. A roadmap for the functional annotation of protein families: a community perspective. Database (Oxford) 2022, 1–16 (2022).
Bileschi, M. L. et al. Using deep learning to annotate the protein universe. Nat. Biotechnol. 40, 932–937 (2022).
Zhang, C., Diao, H., Lu, F., Bie, X., Wang, Y. & Lu, Z. Degradation of triphenylmethane dyes using a temperature and pH stable spore laccase from a novel strain of Bacillus vallismortis. Bioresour. Technol. 126, 80–86 (2012).
Hirose, J., Nasu, M. & Yokoi, H. Reaction of substituted phenols with thermostable laccase bound to Bacillus subtilis spores. Biotechnol. Lett. 25, 1609–1612 (2003).
Navada, K. K. & Kulal, A. Enzymatic degradation of chloramphenicol by laccase from Trametes hirsuta and comparison among mediators. Int. Biodeterior. Biodegrad. 138, 63–69 (2019).
Bian, L., Zheng, M., Chang, T., Zhou, J. & Zhang, C. Degradation of Aflatoxin B1 by recombinant laccase extracellular produced from Escherichia coli. Ecotoxicol. Environ. Saf. 244, 114062 (2022).
McInnes, L., Healy, J. & Melville, J. Umap: Uniform manifold approximation and projection for dimension reduction. J. Open Source Softw. 3, 861 (2018).
Ma, X. et al. High-level expression of a bacterial laccase, CueO from Escherichia coli K12 in Pichia pastoris GS115 and its application on the decolorization of synthetic dyes. Enzym. Microb. Technol. 103, 34–41 (2017).
Mollania, N., Khajeh, K., Ranjbar, B. & Hosseinkhani, S. Enhancement of a bacterial laccase thermostability through directed mutagenesis of a surface loop. Enzym. Microb. Technol. 49, 446–452 (2011).
Koschorreck, K., Richter, S. M., Ene, A. B., Roduner, E., Schmid, R. D. & Urlacher, V. B. Cloning and characterization of a new laccase from Bacillus licheniformis catalyzing dimerization of phenolic acids. Appl. Microbiol. Biotechnol. 79, 217–224 (2008).
Akter, M. et al. Biochemical, spectroscopic and X-ray structural analysis of deuterated multicopper oxidase CueO prepared from a new expression construct for neutron crystallography. Acta Crystallogr. Sect. F 72, 788–794 (2016).
Li, J., Liu, Z., Zhao, J., Wang, G. & Xie, T. Molecular insights into substrate promiscuity of CotA laccase catalyzing lignin-phenol derivatives. Int. J. Biol. Macromol. 256, 128487 (2024).
Guan, Z. B., Luo, Q., Wang, H. R., Chen, Y. & Liao, X. R. Bacterial laccases: promising biological green tools for industrial applications. Cell. Mol. Life Sci. 75, 3569–3592 (2018).
Brugnari, T. et al. Laccases as green and versatile biocatalysts: from lab to enzyme market—an overview. Bioresour. Bioprocess. 8, 1–29 (2021).
Haibo, Z., Yinglong, Z., Feng, H., Peiji, G. & Jiachuan, C. Purification and characterization of a thermostable laccase with unique oxidative characteristics from Trametes hirsuta. Biotechnol. Lett. 31, 837–843 (2009).
Solomon, E. I. et al. Copper active sites in biology. Chem. Rev. 114, 3659–3853 (2014).
Ban, X. et al. Evolutionary stability of salt bridges hints its contribution to stability of proteins. Comput. Struct. Biotechnol. J. 17, 895–903 (2019).
Liu, H. et al. Overexpression of a novel thermostable and chloride-tolerant laccase from Thermus thermophilus SG0. 5JP17-16 in Pichia pastoris and its application in synthetic dye decolorization. PLoS ONE 10, e0119833 (2015).
Yadav, A., Yadav, P., Singh, A. K., Sonawane, V. C., Bharagava, R. N. & Raj, A. Decolourisation of textile dye by laccase: process evaluation and assessment of its degradation bioproducts. Bioresour. Technol. 340, 125591 (2021).
Peng, Q. et al. Optimization of laccase from Ganoderma lucidum decolorizing remazol brilliant blue R and Glac1 as main laccase-contributing gene. Molecules 24, 3914 (2019).
Nishimwe, K., Agbemafle, I., Reddy, M. B., Keener, K. & Maier, D. E. Cytotoxicity assessment of Aflatoxin B1 after high voltage atmospheric cold plasma treatment. Toxicon 194, 17–22 (2021).
Yu, T., Cui, H., Li, J. C., Luo, Y., Jiang, G. & Zhao, H. Enzyme function prediction using contrastive learning. Science 379, 1358–1363 (2023).
Madani, A. et al. Large language models generate functional protein sequences across diverse families. Nat. Biotechnol. 41, 1099–1106 (2023).
de Melo, D. W., Fernandez-Lafuente, R. & Rodrigues, R. C. Enhancing biotechnological applications of l-asparaginase: Immobilization on amino-epoxy-agarose for improved catalytic efficiency and stability. Biocatal. Agric. Biotechnol. 52, 102821 (2023).
Hosseini, K., Zivari-Ghader, T., Akbarzadehlaleh, P., Ebrahimi, V., Sharafabad, B., Dilmaghani A. A comprehensive review of L-asparaginase: production, applications and therapeutic potential in cancer treatment. Appl. Biochem. Microbiol. 1–15 (2024).
Rendle S., Freudenthaler C., Gantner Z. & Schmidt-Thieme L. BPR: Bayesian personalized ranking from implicit feedback. Proceedings of the Twenty-Fifth Conference on Uncertainty in Artificial Intelligence. 452–461 (2009).
Weston, J., Bengio, S. & Usunier, N. Wsabie: scaling up to large vocabulary image annotation. IJCAI 11, 2764–2770 (2011).
Mikolov, T., Sutskever, I., Chen, K., Corrado, G. S. & Dean, J. Distributed representations of words and phrases and their compositionality. Adv. Neural Inf. Process. Syst. 2, 3111–3119 (2013).
Zhang, W., Chen, T., Wang, J. & Yu, Y. Optimizing top-n collaborative filtering via dynamic negative item sampling. In: Proceedings of the 36th International ACM SIGIR Conference on Research and Development in Information Retrieval) (2013).
Kingma, D. P. & Ba, J. Adam: a method for stochastic optimization. The Third International Conference on Learning Representations (2015).
Zhang, Y. Skolnick J. TM-align: a protein structure alignment algorithm based on the TM-score. Nucleic Acids Res. 33, 2302–2309 (2005).
Cock, P. J. et al. Biopython: freely available Python tools for computational molecular biology and bioinformatics. Bioinformatics 25, 1422 (2009).
Smith, P. E. et al. Measurement of protein using bicinchoninic acid. Anal. Biochem. 150, 76–85 (1985).
Otwinowski, Z. & Minor, W. Processing of X-ray diffraction data collected in oscillation mode. In: Methods in Enzymology. (Elsevier, 1997).
Borges, P. T. et al. Methionine-rich loop of multicopper oxidase McoA follows open-to-close transitions with a role in enzyme catalysis. Acs Catal. 10, 7162–7176 (2020).
Liebschner, D. et al. Macromolecular structure determination using X-rays, neutrons and electrons: recent developments in Phenix. Acta Crystallogr. Sect. D 75, 861–877 (2019).
Casañal, A., Lohkamp, B. & Emsley, P. Current developments in Coot for macromolecular model building of electron cryo‐microscopy and crystallographic data. Protein Sci. 29, 1055–1064 (2020).
Jumper, J. et al. Highly accurate protein structure prediction with AlphaFold. Nature 596, 583–589 (2021).
Wang, T. et al. Comprehensive assessment of protein loop modeling programs on large-scale datasets: prediction accuracy and efficiency. Brief. Bioinforma. 25, bbad486 (2024).
Bauer, P., Hess, B. & Lindahl, E. GROMACS 2022.3 Source code (2022.3). Zenodo https://doi.org/10.5281/zenodo.7037338 (2022).
Corbella, M., Pinto, G. P. & Kamerlin, S. C. Loop dynamics and the evolution of enzyme activity. Nat. Rev. Chem. 7, 536–547 (2023).
Crean, R. M., Biler, M., van der Kamp, M. W., Hengge, A. C. & Kamerlin, S. C. Loop dynamics and enzyme catalysis in protein tyrosine phosphatases. J. Am. Chem. Soc. 143, 3830–3845 (2021).
Jorgensen, W. L., Chandrasekhar, J., Madura, J. D., Impey, R. W. & Klein, M. L. Comparison of simple potential functions for simulating liquid water. J. Chem. Phys. 79, 926–935 (1983).
Maier, J. A., Martinez, C., Kasavajhala, K., Wickstrom, L., Hauser, K. E. & Simmerling, C. ff14SB: improving the accuracy of protein side chain and backbone parameters from ff99SB. J. Chem. Theory Comput. 11, 3696–3713 (2015).
Choi, J. M. et al. HepG2 cells as an in vitro model for evaluation of cytochrome P450 induction by xenobiotics. Arch. Pharm. Res. 38, 691–704 (2015).
Liu, Y., Du, M. & Zhang, G. Proapoptotic activity of aflatoxin B(1) and sterigmatocystin in HepG2 cells. Toxicol. Rep. 1, 1076–1086 (2014).
Xibin Zhou. ESM-Ezy: a deep learning strategy for the mining of novel multicopper oxidases with superior properties. ESM-Ezy https://doi.org/10.5281/zenodo.14807568 (2024).
Acknowledgements
The crystal structures were elucidated by Dr. Shilong Fan from Tsinghua University. We thank Nan Li and Westlake University High-Performance Computing Center for the computing resources. We thank Dr. Yinjuan Chen and Cuili Wang from Instrumentation and Service Center for Molecular Sciences at Westlake University for the assistance in products measurement. This research was funded by the following grants: Key project on glucose water hydrogen production: [10311053A022301/002], Special fund for synthetic biology [211000006022301/010], National Key Research and Development Program of China [2022ZD0115100], Westlake Center of Synthetic Biology and Integrated Bioengineering (WE-SynBio), Zhejiang Key Laboratory of Low-Carbon Intelligent Synthetic Biology (2024ZY01025).
Ethics declarations
Competing interests
The authors declare no competing interests.
Peer review
Peer review information
Nature Communications thanks Lígia Martins and the other, anonymous, reviewer(s) for their contribution to the peer review of this work. A peer review file is available.
Additional information
Publisher’s note Springer Nature remains neutral with regard to jurisdictional claims in published maps and institutional affiliations.
Supplementary information
Rights and permissions
Open Access This article is licensed under a Creative Commons Attribution-NonCommercial-NoDerivatives 4.0 International License, which permits any non-commercial use, sharing, distribution and reproduction in any medium or format, as long as you give appropriate credit to the original author(s) and the source, provide a link to the Creative Commons licence, and indicate if you modified the licensed material. You do not have permission under this licence to share adapted material derived from this article or parts of it. The images or other third party material in this article are included in the article’s Creative Commons licence, unless indicated otherwise in a credit line to the material. If material is not included in the article’s Creative Commons licence and your intended use is not permitted by statutory regulation or exceeds the permitted use, you will need to obtain permission directly from the copyright holder. To view a copy of this licence, visit http://creativecommons.org/licenses/by-nc-nd/4.0/.
About this article

Cite this article
Qian, H., Wang, Y., Zhou, X. et al. ESM-Ezy: a deep learning strategy for the mining of novel multicopper oxidases with superior properties. Nat Commun 16, 3274 (2025). https://doi.org/10.1038/s41467-025-58521-y
Received:
Accepted:
Published:
DOI: https://doi.org/10.1038/s41467-025-58521-y