
利用人工智能来预测和分析全球促进结核病的社会经济,环境和医疗保健因素
作者:Shiddik, Abu Bokkor
结核病(TB)长期以来一直被认为是一个重大的全球健康问题,从而广泛促进了高死亡率和发病率。
该疾病是一个严重的公共卫生问题,尤其是在低收入国家和中等收入国家,社会经济,人口和环境变量会增加其传播和影响1。结核分枝杆菌是结核病的病因,主要影响肺系统,但也会影响其他器官2。被感染者咳嗽,打喷嚏或说话时发出的空气传播颗粒是疾病传播的手段3。结核病的一个区别特征是它倾向于保持内部宿主内部的潜在,当宿主的免疫系统受损时,可能会重新激活4。这种潜在的阶段会阻碍管理疾病的努力,因为无症状的人可能会无意间继续传播5。
全球卫生组织,特别是世界卫生组织(WHO),在结核病控制方面取得了重大进展6。WHO S End TB策略于2015年启动,旨在将结核病的死亡人数减少90%,新案件降低80%到2030年7。尽管有这些崇高的目标,但结核病的发病率和死亡率仍然很高,尤其是在医疗设施不足,贫困率高和严重的环境状况的地方。这种持久性强调了理解结核病的起源和地理变化以制定更有效的控制策略的必要性。当前结核病研究中的一个主要差距是对影响结核病结果的各种变量之间的相互作用的全面了解8。贫困和教育是结核病发生和死亡的关键社会经济决定因素9。贫困的人更容易居住在人满为患和通风不足的环境中,从而促进了该疾病的空中传播10。此外,在不利社区中常见的营养不良会损害免疫系统,增加了从潜在到活性结核病的结核病感染和发育的脆弱性11。医疗保健访问是影响结核病结果的另一个重要因素12。许多低收入和中等收入国家的医疗保健系统资源不足和负担负担不足,导致结核病的诊断和治疗延迟13。延迟诊断可能会导致延长的传染时期,从而增加了整个人群传播的风险。此外,治疗不足或不遵守结核病药物方案可能会导致抗药性结核病菌株的出现,这为结核病控制计划提供了巨大的障碍。结核病流行病学受环境因素的严重影响14。空气污染与包括结核病在内的呼吸道感染风险增加有关。污染物会损害肺组织,增加对结核病感染的敏感性15。该协会强调了在结核病管理工作中包括环境因素的需求16。结核病和人类免疫缺陷病毒(HIV)的组合加剧了全球结核病负担17。HIV削弱了免疫系统,增加了对结核病感染的敏感性,并加速了从潜在的结核病发展13。高艾滋病毒发病率的地区通常在管理这两种疾病方面面临额外的挑战,因为共同感染的人需要专门的,综合的护理18,,,,19。
先前的研究阐明了社会经济,环境和医疗保健因素对结核病发生率和结果的影响。传统的流行病学方法已经确定了这些决定因素和结核病趋势之间的相关性。但是,结核病流行病学的复杂性需要更加精确,更可行的见解,从而揭示了常规方法中固有的局限性。这项研究采用了先进的机器学习(ML)技术,特别是与可解释的AI(XAI)方法结合使用的XGBoost,以建模结核病的发病率和死亡率。通过合并空间自相关(Moran S I)和Shap分析,这项研究提供了对影响结核病发生率的空间分布和关键因素的细微理解。通过确定关键因素并阐明其贡献,这项研究提供了基于证据的见解,以指导制定有效的全球战略来对抗结核病。此外,这项研究中提出的方法论进步为未来关于其他传染病和公共卫生问题的研究提供了蓝图。
材料和方法
研究区域
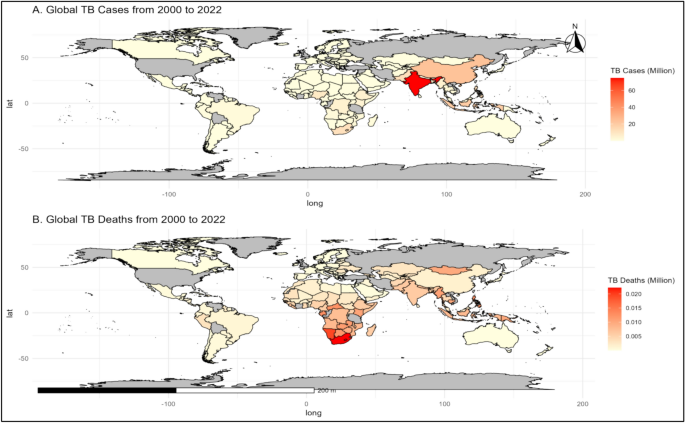
这项研究调查了2000年至2022年194个国家的结核病负担。这些国家是根据来自国际来源(包括世界卫生组织(WHO)和世界银行在内的国际来源的数据的可用性)选择的。该研究包括来自非洲,亚洲,欧洲,北美,南美和大洋洲等各种地理区域的国家,每个国家都表现出独特的社会经济和医疗保健特征。为了促进比较分析,根据世界银行收入群体(低,中和高)以及哪些区域分类对国家进行分类。这种全面的方法旨在确保对结核病趋势的整体理解以及影响其在全球发病率和死亡率的因素(图。 1)。图1

一个)从2000年到2022年,全球结核病病例(每100,000人口)。b)从2000年到2022年,全球结核病死亡(每100,000人口)。该地图是在R中创建的(版本4.4.2,https://cran.rstudio.com)使用rnaturarearth软件包,该软件包提供可视化的自然地球图数据。SF软件包用于空间数据处理,以确保地理边界的准确表示。
数据收集
这项研究的数据集主要来自世界卫生组织(WHO)和世界银行的世界发展指标(WDI)。WHO全球卫生观测站使用标准化方法收集了关键的健康指标,例如结核病的发病率和死亡率,结核病治疗率和与HIV相关的结核病数据,包括基于人群的调查,行政记录以及其194名成员国提交的报告。该数据可通过WHO平台访问https://www.who.int/data/gho。另一方面,WDI数据库汇总了社会经济和环境数据,例如人口规模,GDP增长,医疗保健基础设施,政府健康支出,土地使用和空气污染水平。这些数据点是从国际货币基金组织和联合国等国家统计机构,中央银行和国际组织中收集的,并通过严格的协议进行验证以确保可靠性。WDI数据库可在https://databank.worldbank.org/source/world-development-indicators。表中显示了我们数据集的详细说明1。
数据预处理和分析
使用缺少数据插补Missranger库,实现预测均值匹配,确保数据中关系的完整性20。将对数转换(log1p)应用于预测变量,以解决偏度和稳定方差,而重复和不一致是确保数据质量的。21。
通过计算PCA得分的Mahalanobis距离来使用离群值检测,其值超过了95%的置信阈值以识别极端值,以谨慎处理以保持重要模式(图S1和表S2)。数据集是通过以下等式进行标准化的22为了实现有意义的越野和时间比较:
$$ {z} _ {i} = \ frac {{x} _ {i} - \ mu} {\ sigma} $$
在哪里,\({z} _ {i},{x} _ {i},\ mu,\ sigma \)分别是变量的标准化值,原始值,平均值和标准偏差。使用R 4.4.2执行分析任务,并使用库,例如dplyr用于数据争吵23,,,,GGPLOT2用于全面的可视化和Dalex用于解释的AI24。
选择和评估
这项研究中使用了几种ML模型,包括具有弹性净正则化,决策树(DT),XGBoost,LightGBM,带有RBF内核的支持矢量回归(SVR)的广义线性模型(GLM)和幼稚的基线模型,以预测TB的发生率和死亡率。GLM提供了坚实的统计基础,但努力捕获非线性关系16。决策树有效地建模了层次互动,但容易过度拟合17。SVR模型在解决非线性模式方面具有灵活性,但被证明是计算密集的,特别是对于高维数据集18。天真的基线模型提供了基本的基准测试,但很难捕获数据中的复杂模式。尽管LightGBM提供了强大的预测性能,但与XGBoost相比,它缺乏一些高级功能19最终,由于Xgboost捕获复杂,非线性相互作用及其处理缺失数据的效率的优越能力,因此出现了最佳选择25。通过结合高级正则化技术,例如L1和L2惩罚,XGBoost减轻了过度拟合并提高了模型的推广性。使用RMSE,R2,调整后R2和MAE等指标对这些模型进行了严格的评估,以评估预测精度并解释方差26,,,,27,,,,28。在所有指标中,XGBoost始终胜过替代模型,证明了其准确性和鲁棒性。Shap(Shapley添加说明)进一步增强了XGBoost模型的解释性29,,,,30通过查明影响结核结局的关键预测因子。使用dalex(描述性机器学习说明)框架计算出塑形值,该框架与XGBoost模型集成在一起,作为XAI Workflow的一部分31。Dalex通过提供统一的界面来评估特征重要性,模型灵敏度和预测崩溃,从而促进了外形值的计算31。通过训练XGBoost模型并利用Dalex软件包,得出了Shap值以量化每个功能对模型预测的贡献,从而提高了XGBoost作为本研究最有效模型的透明度和可解释性。此外,使用Moran I确定的TB热点,有助于设计有针对性的干预措施的空间自相关分析32。
交叉验证
为了评估各种ML模型的性能和概括能力,本研究采用了全面的交叉验证框架(表S1)。该数据集分为培训(2000年)和测试数据(2020年)。使用了强大的十倍交叉验证方法,以确保训练数据集分为十个相等的部分(表S1)。每个折叠曾经用作验证集,而其余的九个折叠则用于训练,提供了对模型性能的平衡评估。该过程允许培训集中的每个数据点都有助于培训和验证,从而提高可靠性。根平方误差(RMSE)被用作评估度量标准,可评估预测和实际值之间的平均误差幅度,较小的值表明预测准确性较高。这种交叉验证分析突出了集合学习方法的强度,尤其是XGBOOST和LIGHTGBM,它们表现出了出色的预测性能和泛化能力(表S1)。诸如GLM和DT之类的更简单的模型虽然可解释,但在捕获数据中固有的复杂关系方面的有效性较小。Naw've基线提供了一个有用的基准测试,强调了更复杂的建模方法的附加值。这些结果强调了交叉验证在选择准确可靠预测的最佳模型中的重要性。
结果
全球结核病负担的结核病趋势和地理空间爆发的概述(2000年2022年)
从2000年到2022年,结核病发生率和死亡率的全球趋势揭示了重要的见解(图。 2和S2)。结核病的发病率从20,176至29,857(每100,000人口),平均为25,686(每100,000人口),中位数为26,590(每10万人口)(表2)。由于结核病而导致的死亡率在2,303至3,874(每100,000人口)之间,平均3,059(每100,000人口),中位数为3,016(每100,000人口)(每10万人口),反映了多年来与TB相关的死亡的显着波动(表)2)。每个国家的平均结核病发生率在104至153.9(每100,000人口)之间,平均为132.4(每100,000人口)(图S2,表S3-S4)。同样,每个国家的平均死亡率从11.87到19.97(每100,000人口),平均为15.77(每100,000人口)(表2)。特定的国家数据强调,Eswatini的总结核病发病率最高,为22,346(每100,000人口),而San Marino的发病率最低,只有12.4(每100,000人)。缅甸报告说,与2000年2022年相比,与结核病相关的总死亡率最高的总死亡率为2224(每100,000人口),而圣马力诺和民主党人民共和国的总死亡率为0(每100,000人口)(图每10万人)(图) 1,S2和表S3-S4)。此外,缅甸始终报告的死亡率很高,从每100,000人口的188人(2000)减少到每100,000人口的114人(2008年)(图S2和表S4)。从2000年到2022年,结核病的发病率在2003年达到29,857(每100,000人口),而2020年的发病率为20,176(图。” 2,S2表S3)。在此期间,结核病的发病率和死亡率从2003年的(29,857和3,874)下降到2022年的(20,176和2,303)(图S2和表S4)。埃斯瓦蒂尼(Eswatini)始终报道了TB发病率很高,在2009年和2010年达到1,590(每100,000人口)的峰值,而Niue和Monaco在几年内报告了零病例,表明各个地区的影响都不同。从2020年到2022年,莱索托(Lesotho)报告了全球死亡率最高,范围从600(每100,000人口)到661(每100,000人口)。在2020年,帝摩斯分别记录的高死亡率分别为113和116,而在2022年,在马歇尔群岛观察到最高的死亡率(每100,000人口109人口)(图S2和表S4)。

全球结核病趋势的概述一个)TB发病率趋势数百万(2000年2022年)。b)结核病死亡率趋势(2000年2022年);2003年:结核病的发病率最高(每100,000人口);2020年:结核病的发病率最低(每100,000人口)。该地图是在R(版本4.4.2,https://cran.rstudio.com)使用rnaturarearth软件包,该软件包提供可视化的自然地球图数据。SF软件包用于空间数据处理,以确保地理边界的准确表示。
结核病风险因素的空间自相关分析
全球Moran的分析揭示了对结核病决定因素的空间分布的关键见解(图。 3)。主要发现表明,诸如HIV阳性病例中结核病的发生率(Moran s I:0.534),死亡率低于5(每1000个活生生; Moran s I:0.288),人口增长(Moran s I:0.221)和空气污染(Moran s i:0.287)(FIC.287) 3和表S4)。这种聚类表明存在结核病的发病率或死亡点,强调有针对性的公共卫生干预措施可能非常有效的区域。相比之下,诸如HIV阳性个体(Moran s I:0.000)中事件结核病病例的数量,年龄标准化的30至79岁成年人的高血压患病率(Moran的S I:0.000)(Moran S I:0.000)和出生时预期的寿命(Moran的S I:0.000)(Moran的S I:0.000)表现出没有空间的自动性自动性地理位置,提示(Fige(Firmocatial s)。 3和表S5)。图3

1:结核病的发病率(每年每年100,000人);2:发生结核病病例的数量(HIV阳性病例);3:结核病的发病率(每100,000人口)(HIV阳性病例);â4:由于艾滋病毒阴性人的结核病而死亡(每100,000人口);Y1:新结核病病例的治疗成功率;Y2:先前治疗的结核病病例的治疗成功率;Y3:HIV阳性结核病病例的治疗成功率;Y4:接受MDR-TB治疗的患者的治疗成功率;Y5:XDR-TB病例的治疗成功率;Y6:针对RR-/MDR-TB(%)测试的新病例;Y7:先前对RR-/MDR-TB(%)测试的病例;Y8:已确认的RR-/MDR-TB病例;Y9:开始接受MDR-TB治疗的病例;Y10:具有已知HIV状态的结核病患者(%);Y11:测试的结核病患者HIV阳性(%);Y12:HIV阳性结核病患者(抗逆转录病毒疗法)(%);Y13:烟草使用率(%);Y14:年龄标准化的30至79岁(%)成年人的高血压患病率;Y15:大多数以官方汇率以$ $ $ $的售出的香烟品牌零售价;Y16:大多数出售的香烟税是价格的百分比(总税);Y17:人口,总计;Y18:GDP增长(年%);Y19:医院床密度(每10,000人口);Y20:医师的密度(每10,000人);Y21:药物人员的密度(每10,000人口);Y22:国内政府保健支出(%);Y23:出生时预期寿命(年);Y24:死亡率低于每1000个活产5;Y25:人口增长(年%);Y26:获得电力;Y27:土地面积(平方公里);Y28:可耕地(土地面积的百分比);Y29:农业用地(土地面积的百分比);Y30:森林地区(土地面积的百分比);Y31:空气污染。
三年(2020年)的结核病发生率分析的全球Moran i分析,值分别为0.582、0.559和0.532(表S6)。从2020年开始的结核病发生率的空间自相关分析进一步凸显了几个地区的大量聚类。(图S3和表S7)。莱索托(Lesotho)记录了13.033(2020)和10.505(2022)的局部莫兰(Moran)I值,p值<0.05,表明强烈且具有统计学意义的聚类。同样,南非的局部莫兰元素值为6.74(2020)和5.062(2022),同样具有p值<0.05,确认了明显的聚类。其他区域,例如Timor-leste Moran s I值增加了4.521(2020)至5.749(2022),纳米比亚的莫兰(Namibia s Moran)值下降了4.326(2020)(2020)至3.634(2022),p Value <0.05 <-0.05,Papua New Guinea new Guinea s Adleations Specl able New Guinea s sign 3.772(2020)(2020年)(2020年)(2020年)(2020年)(2020年)至PREP PREP PRET PREP PREP PREP PREP。<0.05,津巴布韦的值增加了1.361(2020)至1.347(2022),p-value <0.05,缅甸的值也增加了0.651(2020)至1.038(2022)至1.038(2022),p-value <i.05 <i.05 <i.05,coblecrirment coblecrirmens clustrim clustrims cluster local cluster sern of Moran s。
结核病发生率与各种危险因素之间的相关性
结核病决定因素的相关分析揭示了详细的相互关系(图S4和表S8)。结核病发生率(HIV阳性病例)和结核病发生率(每100,000人群)(r = 0.83)与确认的RR-/MDR-TB病例之间存在很强的正相关性,而在MDR-TB治疗开始(r = 0.97)。在结核病发生率(每100,000人口)和获取电力(r = 0.50)之间观察到负相关性,表明潜在的社会经济差异。烟草使用的患病率与出生时的预期寿命有中等的负相关性(r = 0.31),突出了生活方式因素对健康结果的影响(图S4和表S8)。
选择最佳模型
XGBOOST模型以最佳性能出现,表现出最低的RMSE(0.88),最高的R2(0.67)和调整后的R2(0.65),表明数据非常适合数据(图S3)。相反,天真的模型显示出最大的RMSE(1.56)和最低R2(0.03)的性能最差,这表明其无法有效捕获基本模式。DT和GLM模型具有可比性的性能,RMSE值分别为1.05和1.08和中等R2值。RMSE为0.91的LightGBM比XGBoost稍差,但仍具有竞争力。SVM模型虽然有效,但RMSE为1.00,反映了与顶级型号相比的精度略低。总体而言,XGBoost被确定为预测目标变量的最佳模型,展示了所有评估指标的卓越性能(表3和图S5)。表3模型性能比较。
新结核病病例的治疗成功率表明对结核病发病率预测有中等阳性(SHAP = 0.123)。
相反,先前治疗的结核病病例的治疗成功率(SHAP = 0.074)和XDR-TB病例的成功率(SHAP = 0.015)对TB发病率预测显示出负面的贡献。确认的MDR-TB病例具有预测结核病发生率的最大积极影响(SHAP = 0.874)。其他变量,例如已知HIV状态的结核病患者的百分比和ART上的HIV阳性结核病患者(SHAP = 0.053 0.245),也显着促进了该模型的预测(图。 4和表S9,S10)。与结核病发病率预测有关的TB治疗和与HIV相关因素的SHAP贡献不同。在安哥拉(Shap = 0.03),博茨瓦纳(Shap = 0.06),缅甸(Shap = 0.09)和纳米比亚(Shap = 0.08)中观察到了很高的贡献。在阿富汗(Shap = 0.02),孟加拉国(Shap = 0.05),肯尼亚(Shap = 0.06)和津巴布韦(Shap = 0.06)中,有中等贡献。在阿根廷(Shap = 0.01),玻利维亚(Shap = 0.05),智利(Shap = 0.07)和哥伦比亚(Shap = 0.01)中发现了最小的贡献(图。 5和表S11)。图4

一个)结核病治疗和HIV相关的结核病因素,b)健康风险因素,c)社会人口统计学和经济因素,d)环境和土地利用因素,e)总体因素。1:结核病的发病率(每年每年100,000人);2:发生结核病病例的数量(HIV阳性病例);3:结核病的发病率(每100,000人口)(HIV阳性病例);â4:由于艾滋病毒阴性人的结核病而死亡(每100,000人口);Y1:新结核病病例的治疗成功率;Y2:先前治疗的结核病病例的治疗成功率;Y3:HIV阳性结核病病例的治疗成功率;Y4:接受MDR-TB治疗的患者的治疗成功率;Y5:XDR-TB病例的治疗成功率;Y6:针对RR-/MDR-TB(%)测试的新病例;Y7:先前对RR-/MDR-TB(%)测试的病例;Y8:已确认的RR-/MDR-TB病例;Y9:开始接受MDR-TB治疗的病例;Y10:具有已知HIV状态的结核病患者(%);Y11:测试的结核病患者HIV阳性(%);Y12:HIV阳性结核病患者(抗逆转录病毒疗法)(%);Y13:烟草使用率(%);Y14:年龄标准化的30至79岁(%)成年人的高血压患病率;Y15:大多数以官方汇率以$ $ $ $的售出的香烟品牌零售价;Y16:大多数出售的香烟税是价格的百分比(总税);Y17:人口,总计;Y18:GDP增长(年%);Y19:医院床密度(每10,000人口);Y20:医师的密度(每10,000人);Y21:药物人员的密度(每10,000人口);Y22:国内政府保健支出(%);Y23:出生时预期寿命(年);Y24:死亡率低于每1000个活产5;Y25:人口增长(年%);Y26:获得电力;Y27:土地面积(平方公里);Y28:可耕地(土地面积的百分比);Y29:农业用地(土地面积的百分比);Y30:森林地区(土地面积的百分比);Y31:空气污染。

全球平均形状贡献一个)结核病治疗和HIV相关的结核病因素,b)健康风险因素,c)社会人口统计学和经济因素,d)环境和土地利用因素。该地图是在R(版本4.4.2,https://cran.rstudio.com)使用rnaturarearth软件包,该软件包提供可视化的自然地球图数据。SF软件包用于空间数据处理,以确保地理边界的准确表示。
结核病的健康风险因素
烟草使用,高血压患病率和香烟价格等健康危险因素会影响结核病的结果。烟草的消费与疾病风险增加显着相关(SHAP = 0.269)。高血压患病率(SHAP = 0.318)和香烟价格(Shap = 0.559)也对模型产生了积极的贡献,尽管程度较小。香烟价格的税收对TB风险的模型预测表现出适度的影响(Shap = 0.23至0.18)(图。 4和表S9,S10)。与结核病发生率预测有关的国家,健康危险因素表现出各种形状的贡献。在阿富汗(Shap = 0.16),不丹(Shap = 0.20),中非共和国(Shap = 0.06)和缅甸(Shap = 0.02)中观察到了很高的贡献。在阿尔巴尼亚(shap = 0.13),贝宁(Shap = 0.13),博茨瓦纳(Shap = 0.13)和burundi(shap = - 0.18)中,中等贡献。在亚美尼亚(Shap = 0.09),巴林(Shap = 0.02),加拿大(Shap = 0.02)和中国(Shap = 0.09)中确定了最小的贡献(图。 5,表S11)。
结核病的社会人口统计学和经济因素
社会人口统计学和经济因素对于确定结核病的发病率和治疗成功至关重要。药物人员的密度(SHAP = 0.017),出生时的预期寿命(Shap = 0.503)和5岁以下的死亡率(SHAP = 0.710)在TB风险中表现出强大的积极贡献。值得注意的是,出生时的预期寿命对结核病发病率的预测产生了重大影响。GDP增长,人口增长和电力获取的贡献突出了它们对结核病结果的显着影响(Shap = 0.23至0.433)(图图)(图。 4和表S9,S10)。诸如安哥拉(Shap = 0.15),博茨瓦纳(Shap = 0.16),缅甸(Shap = 0.18)和纳米比亚(Shap = 0.5)等国家表现出社会人口统计学和经济因素在预测TB发生率方面的较高贡献。预测结核病发病率的因素的媒介贡献包括阿富汗(Shap = 0.1),孟加拉国(Shap = 0.09),伯利兹(Shap = 0.43)和Burkina Faso(Shap = 0.13)。在阿尔巴尼亚(Shap = 0.05),比利时(Shap = 0.12),玻利维亚(Shap = 0.09),波斯尼亚和黑尔奈氏菌(Shap = 09)中,预测结核病发生率的因素的最小贡献(Shap = 0.05)(shap = 0.12) 5和表S11)。结核病的环境和土地使用因素
环境和土地利用因素(例如土地面积,可耕地的土地百分比和空气污染)在结核病发生率预测中表现出不同的贡献。
空气污染尤其值得注意,以预测结核病发生率的强大贡献(SHAP = 1.36)。其他环境因素,包括土地面积(SHAP = 0.021)和农业土地百分比(Shap = 0.283),对此也有较小但值得注意的贡献(图。 4和表S9,S10)。环境和土地利用因素对不同国家的结核病发病率显示出重大影响。在阿富汗(Shap = 0.19),孟加拉国(Shap = 0.29),博茨瓦纳(Shap = 0.21)和缅甸(Shap = 0.27)中观察到了很高的贡献。中等贡献包括孟加拉国(Shap = 0.29),博茨瓦纳(Shap = 0.21),贝宁(Shap = 0.13)和埃塞俄比亚(Shap = - 0.12)。在阿尔巴尼亚(Shap = 0.07),比利时(Shap = 0.18),玻利维亚(Shap = 0.04),波斯尼亚和黑塞哥维那(Shap = shap = - 0.04)中发现最小的贡献 5和表S11)。
结核病发生率的预测精度和趋势分析
比较了2020年至2022年的预测和实际结核病发病率的比较,显示出很高的预测精度,高相关性(r = 0.85)和(r2 = 0.72)(图。 6)。Notably, nations such as Lesotho, South Africa, and Papua New Guinea had mean anticipated occurrences that nearly matched actual incidences, showing good prediction accuracy (Fig. 6and Table S12).

一个) Mean actual TB incidenceb) Mean predicted TB incidencec) Trend analysis of TB incidence for each country from 2023 to 2030. The map was created in R (version 4.4.2,https://cran.rstudio.com) using the rnaturalearth package, which provides natural earth map data for visualization.The sf package was used for spatial data handling to ensure accurate representation of geographic boundaries.
The trend exploration from 2023 to 2030 predicts varied patterns of TB incidence among nations (Fig. 6and S6).Certain nations, notably Albania, Armenia, and Botswana, are expected to see an increase in TB incidence.Botswana is projected to have a total average TB incidence of 533.8 (95% CI: 505.4–562.2) (Table S14).In contrast, nations such as Belize, Cambodia, and Namibia are expected to witness a decline in TB incidence (Fig. 6, S6 and Table S13).Cambodia is predicted to have a total average incidence of 398.3 (95% CI: 382.9–413.8), while Namibia is expected to have an average incidence of 823.1 (95% CI: 780.7–865.6) (Table S14).
讨论
Despite overall declines in incidence and mortality rates, regions like Eswatini continue to report high TB incidence, indicating ongoing challenges in TB control efforts33。Myanmar’s significant TB-related total mortality rates over the year 2000–2022, highlight the necessity for robust healthcare systems and enhanced control measures34。Limited diagnostic infrastructure and delayed treatment continue to exacerbate the burden, particularly in rural and underserved areas.High HIV co-infection rates further complicate TB management, emphasizing the need for integrated approaches.Expanding ART coverage, strengthening healthcare systems, and improving early detection programs are essential to reducing mortality and improving TB outcomes in Myanmar.
Similarly, Eswatini’s persistent high TB incidence underlines the critical need for integrated strategies addressing healthcare access and socio-economic challenges.Conversely, the zero reported cases in Niue and Monaco suggest effective TB management or mitigating factors.Lesotho’s notably high mortality rates in recent years further emphasize the importance of targeted healthcare interventions and infrastructure improvements.While the general decline in TB incidence and mortality suggests successful global efforts, continuous and targeted interventions remain crucial to address regional disparities and sustain progress35。Countries like Timor-Leste, with elevated mortality rates, highlight the need for enhanced surveillance, early detection, and public health measures.Global collaboration and sharing best practices will remain essential in ensuring equitable and sustained progress across all regions.The identification of high-risk regions through predictive modeling offers an opportunity to proactively address rising TB cases by directing resources to vulnerable populations.Future research must focus on fortifying healthcare systems in these regions through customized interventions, including enhanced diagnostics and targeted treatment programs, to alleviate forthcoming challenges.Integrating socio-economic and environmental factors into TB management strategies can also ensure more impactful and sustainable results.
Moran’s I analysis and correlation analysis revealed moderate to high spatial clustering of TB-related factors, such as TB incidence among HIV-positive cases, under- 5 mortality rates, population growth, and air pollution.This signifies particular areas where TB incidence or mortality is concentrated, implying that focused public health interventions may be especially efficacious in these regions36。Understanding both the geographical and socioeconomic elements of TB can inform public health policies, leading to more effective resource allocation, focused treatments, and improved TB control37。The spatial clustering of TB determinants offers insights into its geographic drivers and the contexts where interventions can be most impactful38。The observed clustering in regions like Lesotho, Southern Africa, and other countries can be linked to several factors, including high population density, socio-economic disparities, limited healthcare access, and environmental conditions, including air pollution39。These factors likely exacerbate the transmission and mortality rates of TB, particularly in vulnerable populations.In contrast, the random geographic distribution of some variables suggests either a uniform distribution of healthcare interventions or that these factors do not directly influence TB clustering39。This highlights the complexity of TB dynamics, where some factors act as spatial drivers while others play more systemic roles.
To address these findings, targeted public health efforts are crucial.Interventions must prioritize identified hotspots through enhanced surveillance, community-focused initiatives, and environmental health improvements39。Additionally, national strategies should aim for systemic improvements in healthcare access, infrastructure, and socio-economic equality to address broader determinants of TB40。Vigilant observation of emerging trends, particularly in Zambia and Zimbabwe, will be essential to preemptively address escalating risks and guarantee resource efficiency.
The treatment success rates for new TB cases demonstrate a moderate positive contribution to the model, underscoring the effectiveness of current treatment protocols39。However, the negative contributions observed for previously treated TB cases and XDR-TB cases reveal the challenges in managing these more complex scenarios41,,,,42。These findings highlight the necessity for enhanced treatment strategies and support systems tailored to patients with a history of TB and those with drug-resistant strains, ensuring comprehensive care and improving overall treatment success rates.
Confirmed cases of MDR-TB have a substantial impact on TB incidence, emphasizing the critical importance of addressing multi-drug resistance in TB control efforts43。The significant contributions of variables related to HIV status and ART treatment among HIV-positive TB patients further underscore the intertwined relationship between TB and HIV.Integrated approaches are essential to manage both diseases effectively, ensuring that HIV-positive individuals receive timely and effective TB treatment44。
Health risk factors such as tobacco use, hypertension prevalence, and cigarette prices also play a vital role in shaping TB outcomes.The strong positive contribution of tobacco use suggests that public health policies aimed at reducing tobacco consumption could significantly impact TB incidence45。Similarly, managing hypertension prevalence through targeted interventions may contribute to better TB control, highlighting the broader impact of lifestyle and economic factors on TB outcomes46。
Socio-demographic and economic factors, including life expectancy, mortality rates, and access to healthcare, are crucial in determining TB incidence and treatment success.The density of pharmaceutical personnel and economic growth also play significant roles47。These findings emphasize the importance of healthcare infrastructure and socioeconomic development in supporting effective TB control.Improved access to healthcare services, coupled with socioeconomic advancements, can lead to better TB management and reduced incidence rates.
Air pollution, land acreage, and agricultural land proportion all contribute to TB incidence in variable degrees.The considerable favorable impact of air pollution emphasizes the importance of addressing environmental determinants of health in TB preventive and control methods.We can lower TB transmission rates and increase healthcare access by addressing environmental risk factors, especially in densely populated regions with poor air quality and sanitation48。
Countries like Angola, Botswana, Myanmar, and Namibia exhibit high contributions to the model prediction of TB incidence, indicating significant challenges in managing TB and HIV co-infections.These regions require targeted interventions and resources to improve treatment outcomes.Integrated approaches, such as combining HIV treatment with TB care and expanding ART coverage, can mitigate the dual burden posed by co-infections in these high-risk areas.Strengthening diagnostic systems and laboratory capacity will further enable timely identification and management of TB cases, reducing long-term health complications.In contrast, countries such as Afghanistan, Bangladesh, Kenya, and Zimbabwe show medium contributions in influence TB incidence, suggesting that while challenges exist, they may not be as severe as in high-contributing countries.Sustained efforts are necessary to enhance treatment strategies and outcomes in these regions.Developing community-based healthcare initiatives and increasing outreach programs can help address gaps in treatment coverage and provide critical support for underserved populations.Aligning these measures with global health priorities ensures that progress is not only maintained but accelerated where needed.Minimal contributions of influencing TB incidence observed in countries like Argentina, Bolivia, Chile, and Colombia suggest more effective TB control measures or different epidemiological factors influencing TB incidence.Nonetheless, maintaining vigilance to prevent any potential resurgence of TB cases remains essential49。Strengthening preventive measures, such as vaccination campaigns and public awareness programs, can further consolidate these successes and reduce the risk of future outbreaks.
The trend exploration from 2023 to 2030 predicts varied patterns of TB incidence among nations.This study emphasizes the need for having a comprehensive understanding of regional differences in TB trends to make better educated public health actions50。Countries expecting a rise in tuberculosis incidence underline the critical need for increased public health activities51。Expanding surveillance systems and ensuring equitable access to healthcare services will be vital to addressing the challenges posed by rising trends in high-incidence countries such as Botswana and Armenia.Investing in capacity-building programs for healthcare workers can also bolster the resilience of healthcare infrastructure.To combat growing TB rates, these locations would benefit from tailored efforts aiming at early detection, effective treatment, and upgrading healthcare infrastructure.Conversely, the anticipated decline in TB incidence in certain countries reflects the effectiveness of current TB management strategies40。These regions serve as valuable case studies for successful TB control measures, offering best practices that can be adapted and implemented in other high-incidence areas52。Sharing data, policies, and outcomes among declining-incidence nations can facilitate the replication of successful strategies, accelerating progress toward global TB eradication.The variation in projected TB incidence emphasizes the importance of specialized public health policies tailored to address distinct geographical challenges53。
Understanding regional disparities is critical for developing context-specific treatments that improve global TB control efforts.Such insights are critical for making educated decisions and implementing effective TB management strategies that will substantially decrease the worldwide TB burden in the next years.Collaborative efforts between nations, particularly in sharing expertise and resources, will be pivotal in addressing these disparities effectively.This method guarantees that resources are spent efficiently and that initiatives are tailored to the specific needs of each region, resulting in improved global health results.
This study emphasizes the potential of combining XGBoost and XAI methodologies as a comprehensive framework for effectively addressing global TB incidence and mortality rates.Our proposed XGBoost model has been widely used in healthcare owing to its capacity to handle complicated datasets and provide reliable predictions54。It has been used to diagnose diseases, such as predicting infection risks in decompensated cirrhosis, as well as to develop early health prediction frameworks, such as COVID- 19 severity forecasting54,,,,55。In precision medicine, XGBoost has been used to uncover essential aspects such as genes or biomarkers, which aids in individualized treatment strategies56。Its combination with XAI technologies, such as SHAP, improves interpretability, making it a useful tool in clinical decision-making56。These applications demonstrate XGBoost’s transformational significance in healthcare analytics.
This study significantly advances the existing knowledge by integrating machine learning, explainable artificial intelligence methodology, and spatial analysis to enhance the understanding of tuberculosis epidemiology and associated risk factors.The findings underscore the necessity for targeted public health interventions tailored to regional challenges, emphasizing the pivotal role of socioeconomic, environmental, and healthcare determinants in tuberculosis control.
局限性
This study has some limitations that should be considered when interpreting the findings.Firstly, the reliance on secondary data from global repositories introduces potential biases, including underreporting, missing records, and discrepancies in data collection methodologies across countries and time periods.These limitations could impact the reliability and accuracy of the predictors and outcomes analyzed.Secondly, while ML models, such as XGBoost, were employed to identify associations and trends, these models are inherently correlation-based and do not establish causal relationships, limiting the ability to infer causation.Lastly, although the study spans 194 countries, its generalizability to specific regions or local contexts is constrained by unmeasured factors such as disparities in healthcare systems, socioeconomic conditions, and environmental influences.Recognizing these limitations underscores the importance of cautious interpretation and highlights the need for complementary studies at local levels to validate and contextualize the global insights provided by this research.As mentioned above, this will be explored progressively with increasing data.
结论
This study rigorously analyzes the global burden of TB from 2000 to 2022, highlighting the significant roles of socioeconomic, environmental, and healthcare determinants.Utilizing XGBoost and XAI techniques, key factors such as treatment success rates and MDR-TB treatment initiation were identified as pivotal determinants of TB incidence.Spatial autocorrelation analysis revealed TB hotspots, necessitating targeted public health interventions.The correlation analysis underscored complex relationships among TB-related variables, while SHAP analysis provided critical insights for policymakers.These findings emphasize the need for evidence-based strategies and tailored interventions to effectively address TB at both regional and global level.
数据可用性
All necessary data and source codes are available athttps://github.com/siddikur2022/Tuberculosis。参考
Imam, F. et al.
The possible impact of socioeconomic, income, and educational status on adverse effects of drug and their therapeutic episodes in patients targeted with a combination of tuberculosis interventions.Saudi.J. Biol Sci. 28, 2041–2048.https://doi.org/10.1016/J.SJBS.2021.02.004(2021)。
文章一个 CAS一个 PubMed一个 PubMed Central一个 Google Scholar一个
Sakamoto, K. The pathology of Mycobacterium tuberculosis infection.Vet Pathol. 49, 423–439.https://doi.org/10.1177/0300985811429313(2012年)。
文章一个 CAS一个 PubMed一个 Google Scholar一个
Dhand, R. & Li, J. Coughs and Sneezes: Their Role in Transmission of Respiratory Viral Infections, including SARS-CoV-2.是。J. Respir.Crit.Care Med. 202, 651–659.https://doi.org/10.1164/RCCM.202004-1263PP/SUPPL_FILE/DISCLOSURES.PDF(2020)。
文章一个 CAS一个 PubMed一个 PubMed Central一个 Google Scholar一个
Gupta, A., Kaul, A., Tsolaki, A. G., Kishore, U. & Bhakta, S. Mycobacterium tuberculosis: immune evasion, latency and reactivation.Immunobiology 217, 363–374.https://doi.org/10.1016/J.IMBIO.2011.07.008(2012年)。
文章一个 CAS一个 PubMed一个 Google Scholar一个
Ernst, J. D. The immunological life cycle of tuberculosis.纳特。疫苗牧师。 12(8), 581–591.https://doi.org/10.1038/nri3259(2012年)。
文章一个 CAS一个 PubMed一个 Google Scholar一个
6. Digital health for the End TB Strategy - an agenda for action.[cited 9 Feb 2025].可用的:https://www.who.int/publications/m/item/WHO-HTM-TB-2015.21
Raviglione, M. & Sulis, G. Tuberculosis 2015: Burden, Challenges and Strategy for Control and Elimination.感染。dis。代表。 8, 6570.https://doi.org/10.4081/IDR.2016.6570(2016)。
文章一个 PubMed一个 PubMed Central一个 Google Scholar一个
Trauer, J. M. et al.The Importance of heterogeneity to the epidemiology of Tuberculosis.临床感染。dis。 69, 159–166.https://doi.org/10.1093/CID/CIY938(2019)。
文章一个 PubMed一个 Google Scholar一个
Satyanarayana, S. et al.An Opportunity to END TB: Using the sustainable development goals for action on socio-economic determinants of tb in high burden countries in WHO South-East Asia and the western pacific regions.Trop Med.感染。dis。 https://doi.org/10.3390/TROPICALMED5020101(2020)。
文章一个 PubMed一个 PubMed Central一个 Google Scholar一个
Pedrazzoli, D. et al.Modelling the social and structural determinants of tuberculosis: opportunities and challenges.int。J. Tuberc.Lung Dis. 21, 957.https://doi.org/10.5588/IJTLD.16.0906(2017)。
文章一个 CAS一个 PubMed一个 PubMed Central一个 Google Scholar一个
11. Fact sheets - Malnutrition.[cited 9 Feb 2025].可用的:https://www.who.int/news-room/fact-sheets/detail/malnutrition
Mok, J. et al.Treatment outcomes and factors affecting treatment outcomes of new patients with tuberculosis in Busan, South Korea: A retrospective study of a citywide registry, 2014–2015.BMC Infect.dis。 18, 1–9.https://doi.org/10.1186/S12879-018-3574-Y/TABLES/4(2018)。
文章一个 Google Scholar一个
Salgame, P., Geadas, C., Collins, L., Jones-López, E. & Ellner, J. J. Latent tuberculosis infection–Revisiting and revising concepts.Tuberculosis (Edinb). 95, 373–384.https://doi.org/10.1016/J.TUBE.2015.04.003(2015)。
文章一个 PubMed一个 Google Scholar一个
Wares, F., Kerndt, P., Ijaz, K., Gilmour, B. & Addis, A. K. Ending tuberculosis: Challenges and opportunities.正面。结核。 2, 1487518.https://doi.org/10.3389/FTUBR.2024.1487518(2024)。
文章一个 Google Scholar一个
Bălă, G. P., Râjnoveanu, R. M., Tudorache, E., MotiÈ™an, R. & Oancea, C. Air pollution exposure-the (in)visible risk factor for respiratory diseases.Environ Sci.污染。res。int。 28, 19615–19628.https://doi.org/10.1007/S11356-021-13208-X(2021)。
文章一个 PubMed一个 PubMed Central一个 Google Scholar一个
Chen, G. et al.Beyond linearity in neuroimaging: Capturing nonlinear relationships with application to longitudinal studies.Neuroimage 233, 117891.https://doi.org/10.1016/J.NEUROIMAGE.2021.117891(2021)。
文章一个 PubMed一个 Google Scholar一个
Venkatasubramaniam, A. et al.Decision trees in epidemiological research.出现。Themes Epidemiol. 14, 11.https://doi.org/10.1186/S12982-017-0064-4(2017)。
文章一个 PubMed一个 PubMed Central一个 Google Scholar一个
Sanz, H., Valim, C., Vegas, E., Oller, J. M. & Reverter, F. SVM-RFE: Selection and visualization of the most relevant features through non-linear kernels.BMC Bioinform. 19, 1–18.https://doi.org/10.1186/S12859-018-2451-4/FIGURES/16(2018)。
文章一个 Google Scholar一个
Yao, X., Fu, X. & Zong, C. Short-Term Load Forecasting Method Based on Feature Preference Strategy and LightGBM-XGboost.IEEE访问。 10, 75257–75268.https://doi.org/10.1109/ACCESS.2022.3192011(2022)。
文章一个 Google Scholar一个
20. Mayer M. missRanger: Fast Imputation of Missing Values.CRAN: Contributed Packages.[cited 9 Feb 2025].https://doi.org/10.32614/CRAN.PACKAGE.MISSRANGER(2017)。
van Buuren, S. & Groothuis-Oudshoorn, K. mice: Multivariate Imputation by Chained Equations in R.J .Stat.软件。 45, 1–67.https://doi.org/10.18637/JSS.V045.I03(2011)。
文章一个 Google Scholar一个
Guo, J., Li, W., Li, C. & Gao, S. Standardization of interval symbolic data based on the empirical descriptive statistics.计算。Stat.数据肛门。 56, 602–610.https://doi.org/10.1016/J.CSDA.2011.09.006(2012年)。
文章一个 MathScinet一个 Google Scholar一个
Broatch, J. E., Dietrich, S. & Goelman, D. Introducing Data Science Techniques by Connecting Database Concepts and dplyr.J. Stat。教育。 27, 147–153.https://doi.org/10.1080/10691898.2019.1647768(2019)。
文章一个 Google Scholar一个
Swathi Y, Challa M. A Comparative Analysis of Explainable AI Techniques for Enhanced Model Interpretability.Proceedings - 20233rd International Conference on Pervasive Computing and Social Networking, ICPCSN。229–234.https://doi.org/10.1109/ICPCSN58827.2023.00043(2023)。
Li, Z. Extracting spatial effects from machine learning model using local interpretation method: An example of SHAP and XGBoost.计算。环境。Urban Syst. 96, 101845.https://doi.org/10.1016/J.COMPENVURBSYS.2022.101845(2022)。
文章一个 Google Scholar一个
26. Advantages of the mean absolute error (MAE) over the root mean square error (RMSE) in assessing average model performance on JSTOR.[cited 9 Feb 2025].可用的:https://www.jstor.org/stable/24869236
Nakagawa, S. & Schielzeth, H. A general and simple method for obtaining R2 from generalized linear mixed-effects models.Methods Ecol.Evol。 4, 133–142.https://doi.org/10.1111/J.2041-210X.2012.00261.X(2013)。
文章一个 Google Scholar一个
Spiess, A. N. & Neumeyer, N. An evaluation of R2as an inadequate measure for nonlinear models in pharmacological and biochemical research: A Monte Carlo approach.BMC Pharmacol. 10, 1–11.https://doi.org/10.1186/1471-2210-10-6/FIGURES/4(2010)。
文章一个 Google Scholar一个
Minh, D., Wang, H. X., Li, Y. F. & Nguyen, T. N. Explainable artificial intelligence: a comprehensive review.艺术品。Intell。修订版 55, 3503–3568.https://doi.org/10.1007/S10462-021-10088-Y(2022)。
文章一个 Google Scholar一个
30. Ejiyi CJ, Qin Z, Ukwuoma CC, Nneji GU, Monday HN, Ejiyi MB, et al.Comparative performance analysis of Boruta, SHAP, and Borutashap for disease diagnosis: A study with multiple machine learning algorithms.Network: Computation in Neural Systems.[cited 11 Feb 2025].https://doi.org/10.1080/0954898X.2024.2331506(2024)。
31. Szymon Maksymiuk by, Gosiewska A, Biecek P. Landscape of R packages for eXplainable Artificial Intelligence.R J. [cited 8 Mar 2025].可用的:https://arxiv.org/abs/2009.13248v3(2020)。
Anselin, L., Syabri, I. & Kho, Y. GeoDa : An Introduction to Spatial Data Analysis.Geogr Anal. 38, 5–22.https://doi.org/10.1111/J.0016-7363.2005.00671.X(2006)。
文章一个 Google Scholar一个
Kerschberger, B. et al.Sustained high fatality during TB therapy amid rapid decline in TB mortality at population level: A retrospective cohort and ecological analysis from Shiselweni.Eswatini.Trop Med.Int Health. 29, 192–205.https://doi.org/10.1111/TMI.13961(2024)。
文章一个 CAS一个 PubMed一个 Google Scholar一个
34. Tun S. Health-Related Quality of Life (HRQOL) of Multidrug-Resistant Tuberculosis (MDR-TB) Patients and its applicability to MDR-TB patients Living in Yangon Region, Myanmar.
Floyd, K., Glaziou, P., Zumla, A. & Raviglione, M. The global tuberculosis epidemic and progress in care, prevention, and research: An overview in year 3 of the End TB era.Lancet Respir.医学 6, 299–314.https://doi.org/10.1016/S2213-2600(18)30057-2(2018)。
文章一个 PubMed一个 Google Scholar一个
Bai, W. & Ameyaw, E. K. Global, regional and national trends in tuberculosis incidence and main risk factors: a study using data from 2000 to 2021.BMC Public Health 24, 1–14.https://doi.org/10.1186/S12889-023-17495-6/FIGURES/13(2024)。
文章一个 CAS一个 Google Scholar一个
Wubuli, A. et al.Socio-Demographic predictors and distribution of pulmonary Tuberculosis (TB) in Xinjiang, China: A spatial analysis.PLoS ONE 10, e0144010.https://doi.org/10.1371/JOURNAL.PONE.0144010(2015)。
文章一个 PubMed一个 PubMed Central一个 Google Scholar一个
Van Gurp, M. et al.Finding gaps in TB notifications: spatial analysis of geographical patterns of TB notifications, associations with TB program efforts and social determinants of TB risk in Bangladesh.Nepal Pakistan.BMC Infect Dis. 20, 1–14.https://doi.org/10.1186/S12879-020-05207-Z/TABLES/7(2020)。
文章一个 Google Scholar一个
Dartois, V. A. & Rubin, E. J. Anti-tuberculosis treatment strategies and drug development: challenges and priorities.纳特。Microbiol牧师。 20(11), 685–701.https://doi.org/10.1038/s41579-022-00731-y(2022)。
文章一个 CAS一个 PubMed一个 PubMed Central一个 Google Scholar一个
Dye, C., Watt, C. J., Bleed, D. M., Hosseini, S. M. & Raviglione, M. C. Evolution of tuberculosis control and prospects for reducing tuberculosis incidence, prevalence, and deaths globally.贾马 293, 2767–2775.https://doi.org/10.1001/JAMA.293.22.2767(2005)。
文章一个 CAS一个 PubMed一个 Google Scholar一个
Rc, G., Kv, P. & Be, L. The evolution of extensively drug resistant tuberculosis (XDR-TB): history, status and issues for global control.Infect Disord.药品。Targets. 7, 73–91.https://doi.org/10.2174/187152607781001844(2007)。
文章一个 Google Scholar一个
Zumla, A. et al.Drug-resistant tuberculosis–current dilemmas, unanswered questions, challenges, and priority needs.J. Infect。dis。 205(Suppl), 2.https://doi.org/10.1093/INFDIS/JIR858(2012年)。
文章一个 Google Scholar一个
Dheda, K. et al.Multidrug-resistant tuberculosis.纳特。修订版。Primers https://doi.org/10.1038/S41572-024-00504-2(2024)。
文章一个 PubMed一个 Google Scholar一个
Hyle, E. P., Naidoo, K., Su, A. E., El-Sadr, W. M. & Freedberg, K. A. HIV, tuberculosis, and noncommunicable diseases: what is known about the costs, effects, and cost-effectiveness of integrated care?.J. Acquir.Immune.Defic.Syndr. 67(Suppl), 1.https://doi.org/10.1097/QAI.0000000000000254(2014)。
文章一个 Google Scholar一个
Basu, S., Stuckler, D., Bitton, A. & Glantz, S. A. Projected effects of tobacco smoking on worldwide tuberculosis control: mathematical modelling analysis.BMJ https://doi.org/10.1136/BMJ.D5506(2011)。
文章一个 PubMed一个 PubMed Central一个 Google Scholar一个
De Foo, C. et al.Integrating tuberculosis and noncommunicable diseases care in low- and middle-income countries (LMICs): A systematic review.Plos Med。 19, e1003899.https://doi.org/10.1371/JOURNAL.PMED.1003899(2022)。
文章一个 PubMed一个 PubMed Central一个 Google Scholar一个
Koul, A., Arnoult, E., Lounis, N., Guillemont, J. & Andries, K. The challenge of new drug discovery for tuberculosis.自然 469, 483–490.https://doi.org/10.1038/NATURE09657(2011)。
文章一个 广告一个 CAS一个 PubMed一个 Google Scholar一个
Kharwadkar, S., Attanayake, V., Duncan, J., Navaratne, N. & Benson, J. The impact of climate change on the risk factors for tuberculosis: A systematic review.环境。res。 https://doi.org/10.1016/J.ENVRES.2022.1134364(2022)。
文章一个 PubMed一个 Google Scholar一个
Lönnroth, K. & Raviglione, M. Global epidemiology of tuberculosis: prospects for control.semin。呼吸。Crit.Care Med. 29, 481–491.https://doi.org/10.1055/S-0028-1085700(2008)。
文章一个 PubMed一个 Google Scholar一个
Rangaka, M. X. et al.Controlling the seedbeds of tuberculosis: Diagnosis and treatment of tuberculosis infection.柳叶刀。 386, 2344–2353.https://doi.org/10.1016/S0140-6736(15)00323-2/ASSET/E3F4853A-2A6A-45D4-A772-C20888960C02/MAIN.ASSETS/GR1.JPG(2015)。
文章一个 Google Scholar一个
Dye, C. & Williams, B. G. Eliminating human tuberculosis in the twenty-first century.J R Soc Interface. 5, 653–662.https://doi.org/10.1098/RSIF.2007.1138(2007)。
文章一个 PubMed Central一个 Google Scholar一个
Zenner, D. et al.Active case finding for tuberculosis among high-risk groups in low-incidence countries.Int J Tuberc Lung Dis. 17, 573–582.https://doi.org/10.5588/IJTLD.12.0920(2013)。
文章一个 CAS一个 PubMed一个 Google Scholar一个
Hargreaves, J. R. et al.The Social Determinants of Tuberculosis: From Evidence to Action.Am J Public Health. 101, 654.https://doi.org/10.2105/AJPH.2010.199505(2011)。
文章一个 PubMed一个 PubMed Central一个 Google Scholar一个
Kumar, D., Sood, S. K. & Rawat, K. S. Early health prediction framework using XGBoost ensemble algorithm in intelligent environment.艺术品。Intell。修订版 56, 1591–1615.https://doi.org/10.1007/S10462-023-10565-6/METRICS(2023)。
文章一个 Google Scholar一个
Zheng, J. et al.Clinical Data based XGBoost Algorithm for infection risk prediction of patients with decompensated cirrhosis: a 10-year (2012–2021) Multicenter Retrospective Case-control study.BMC Gastroenterol. 23, 1–10.https://doi.org/10.1186/S12876-023-02949-3/TABLES/3(2023)。
文章一个 PubMed一个 PubMed Central一个 Google Scholar一个
Band, S. S. et al.Application of explainable artificial intelligence in medical health: A systematic review of interpretability methods.通知。医学解锁。 40, 101286.https://doi.org/10.1016/J.IMU.2023.101286(2023)。
文章一个 Google Scholar一个
00323-2/ASSET/E3F4853A-2A6A-45D4-A772-C20888960C02/MAIN.ASSETS/GR1.JPG)
致谢
We are grateful to the World Health Organization (WHO) and the World Bank for providing essential data for this study.
资金
This work was not externally funded.
竞争利益
作者没有宣称没有竞争利益。
附加信息
Publisher’s note
关于已发表的地图和机构隶属关系中的管辖权主张,Springer自然仍然是中立的。
补充信息
权利和权限
开放访问
This article is licensed under a Creative Commons Attribution-NonCommercial-NoDerivatives 4.0 International License, which permits any non-commercial use, sharing, distribution and reproduction in any medium or format, as long as you give appropriate credit to the original author(s) and the source, provide a link to the Creative Commons licence, and indicate if you modified the licensed material.您没有根据本许可证的许可来共享本文或部分内容的改编材料。The images or other third party material in this article are included in the article’s Creative Commons licence, unless indicated otherwise in a credit line to the material.If material is not included in the article’s Creative Commons licence and your intended use is not permitted by statutory regulation or exceeds the permitted use, you will need to obtain permission directly from the copyright holder.要查看此许可证的副本,请访问http://creativecommons.org/licenses/by-nc-nd/4.0/。重印和权限
引用本文

Rahman, M.S., Shiddik, A.B.
Utilizing artificial intelligence to predict and analyze socioeconomic, environmental, and healthcare factors driving tuberculosis globally.Sci Rep 15, 13619 (2025).https://doi.org/10.1038/s41598-025-96973-w
已收到:
公认:
出版:
doi:https://doi.org/10.1038/s41598-025-96973-w