
机器学习框架以准确估计有机材料在树脂和生物炭上的吸附
作者:Kazemi, Mohammad Reza
介绍
阻碍现代社会进步的最紧迫的问题之一是安全和清洁的水的严重赤字1,,,,2。水资源和环境完整性越来越受到有机污染物的威胁,尤其是源自个人护理产品,农药和食品添加剂的污染物3。物理吸附是一种有效的方法,可以在考虑水恢复工作时去除有机污染物,这主要是因为其经济性,直接应用和最少的能源消耗4,,,,5,,,,6。研究强调了多种吸附剂的有效性,例如颗粒状活性碳,碳纳米管,生物芯片和石墨烯纳米片在解决水源中去除有机污染物问题方面的有效性7,,,,8,,,,9。尽管具有潜力,但目前使用的技术的效率低下,尤其是在处理新的化学污染物和现代吸附剂方面,已导致对复合吸附机制的可靠数据严重短缺10,,,,11,,,,12,,,,13。研究人员可以通过创建准确的预测框架来更有效地利用现有数据,从而最大程度地减少对广泛而费力的吸附实验的需求14,,,,15,,,,16。多型聚体线线性自由能关系(PP-lfer)模型经常用于吸附研究,是估计有机化合物的吸附趋势的可靠工具17。PP-lfer模型阐明了有机污染物通过其分子结构参数的相扩散,该参数旨在反映分子间力对吸附过程的影响18。PP-lfer模型的系数为各种系统之间分子间力的差异提供了有价值的见解,有助于理解有机复合吸附机制并实现可靠的环境风险评估。但是,该模型无视吸附特性的趋势通常会引入相当大的预测错误。此外,它对每个平衡浓度(CE)对多线性回归(MLR)的依赖将其预测范围限制为模型开发中使用的浓度范围14。为了解决现有方法的缺点,基于机器学习的模型来说明吸附剂和有机化合物的内在特性可以作为有效且高级的解决方案。
作为一个跨学科领域,研究人员现在积极利用机器学习(ML)来吸附研究19。机器学习(ML)从根本上以创建和检查促进计算机自动学习的算法为中心。这些算法以统计方法为基础,可以剖析现有数据的架构,揭示隐藏的趋势,并采用此信息来做出有关新的,未观察到的数据点的明智预测或决定20。ML方法,例如SVM,ANN和RF,随着调查有机污染物吸附过程的关键方法,稳步获得了突出。21。机器学习(ML)技术提供了优化吸附参数的双重优势22,,,,23在模拟吸附行为方面,无论是单一组件还是多组分系统,都超过传统的回归方法24,,,,25。
ML方法,包括ANN,SVM,RF和类似方法,在有机污染物吸附的研究中已成为关键工具21。这些ML技术扮演双重角色:它们优化吸附参数22,,,,23在建模单组分和多组分吸附方案时,胜过传统的回归方法24,,,,25。ANN模型已被用来探索生物炭预测污染物吸附的潜力。尽管ANN算法产生了可接受的RMSE和Râ²值,但其预测精度的某些方面受到限制26。此外,LS-SVM和ANN已得到验证,以提高甲基蓝燃料的吸附效率27。对馈电回本ANN和RF模型进行了比较分析,以评估其在336个实例中预测能源消耗的有效性和适用性。两种模型在训练和验证阶段都表现出强劲的性能28。但是,没有可预测有机材料在许多生物炭和聚合物树脂上的吸附的全面模型,这是这项工作的重点。
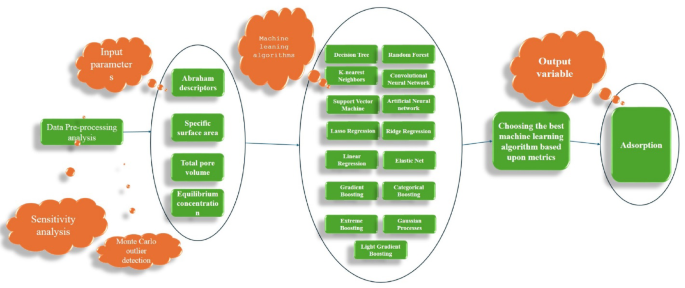
这项研究计划使机器学习数据驱动的模型,以计算有机材料在生物炭和聚合物树脂上的吸附。广泛的ML技术,例如线性回归,卷积神经网络,人工神经网络,山脊回归,弹性网,弹性网,套索回归,SVM,随机森林,GBM,knn,决策树,极端增强,极端促进,轻梯度,轻梯度增强,分类增强和高卢斯工艺工艺,iS iSED机制。应用蒙特卡洛离群值检测算法以确保数据集的鲁棒性用于培训。使用各种性能指标和图形分析对模型进行严格评估。另外,分析了最有效模型的塑形值,以阐明关键特征在影响吸附数据中的作用。方法学方法的详细表示。 1。

用于将有机材料的吸附值计算到生物炭和聚合物树脂上的工作流程的摘要。
本文概述为几个部分。首先,给出了使用的机器学习算法的背景。然后,根据灵敏度分析,数据驱动建模的输入参数的规范以及使用Monte Carlo算法的离群检测来分析收集的数据集。然后,根据其公开的评估指标评估开发的模型,最终确定其最佳表现。最后,关于本文的未来工作将详细阐明。这项研究确实是基于一项比较研究,在该研究中,进行了几种机器学习算法的效率,以找出预测有机材料在生物炭和聚合物树脂上的吸附值的最佳表现。
机器学习背景
本节说明了每种实施的机器学习算法。
卷积神经网络
数字2证明CNN代表了一种新型的深度学习模型,该模型旨在有效地处理网格状的结构化数据,使其特别适合涉及图像和空间数据的任务29。CNN的主要特征,例如卷积层,合并技术和分层特征提取,使模型能够自动和适应地学习特征的复杂空间层次结构30,,,,31。这极大地影响了许多领域,包括计算机视觉,模式识别和多维信号处理。

本研究应用的卷积神经网络的结构。
CNN由于其出色的能力,可以直接从原始数据(例如图像)中逐步提取更复杂和抽象的特征,因此彻底改变了深度学习领域。这是使用两个基本架构思想来实现的:局部连接设计和常见参数。
CNN框架的增强大大扩展了深度学习的可能性,解决了与计算复杂性,可解释性和泛滥有关的关键问题55。在过去的几年中,尤其是自2020年以来,研究一直致力于开发新的网络体系结构,包括轻量级CNN,基于变形金刚的混合模型以及自我监督的学习方法,以减少对大型标记数据集的依赖性32,,,,33。卷积神经网络(CNN)的最新进展,例如神经架构搜索,注意机制和改进的正则化方法,已大大提高了它们在应对复杂现实世界中的挑战方面的有效性34。
人工神经网络
ANN是受人脑启发的神经网络,由代表输入,隐藏和输出层的互连节点组成。这些网络通过计算输入的加权总和来处理数据,应用激活函数并将结果传播到更深的层。从数学上讲,神经元的操作如下:
$ h(x)= f \ left({\ sum \ limits _ {{i = 1}}}}}^{n} {{\ omega _i}
(1)
其中存在是权重的,x是输入,b是偏置项,而f是激活函数(例如,sigmoid或relu)。优化方法,例如梯度下降最小化训练过程中的误差。
ANN广泛应用于图像识别,自然语言处理和语音识别。诸如辍学和转移学习之类的技术减轻过度拟合,从而确保对现代应用的适应性。朱等人等研究。和Heidari等。强调ANN在深度学习,桥接计算进步和应用中的变革性作用35,,,,36。
决策树
如图所示 3,决策树是一种层次的配置,显示了一个流程图,该流程图通过表示内部节点,分支作为决策规则以及结果作为叶子节点来帮助决策。该树以顶部的根节点开头,数据根据属性值递归划分。这个简单而可理解的框架可以轻松可视化决策过程,这就是为什么决策树通常是机器学习中的分类或回归任务的原因。37,,,,38,,,,39,,,,40。
树中的每个节点都评估特定属性或因子,而分支表示可能的结果或选择。通过选择降低杂质或改善信息增益的属性和决策标准,树生长。在决策树算法中,前面描述的过程涉及基于特征值的数据集的递归分割。在每个节点上,算法都会选择一个功能将数据集拆分为两个或多个子集,从而改善了目标函数,例如信息增益,Gini索引或卡方测试。
决策树可以处理数值和分类数据,并且通常用于选择功能,检测异常值和解释模型。它们可以用作独立模型或更复杂的集合方法的一部分,例如随机森林或梯度提升。决策树的清晰度使它们对于了解核心决策过程至关重要的情况很有吸引力41,,,,42,,,,43。在构建决策树时,诸如增益比和Gini指数之类的指标对于确定最佳拆分以划分数据至关重要。这些技术有助于确定每个节点的最佳功能和决策标准,从而提高树的准确性44,,,,45,,,,46,,,,47。

决策树算法的结构布局。
随机森林
如图所示 4,随机森林是由在数据集上进行的分类和回归组成48。制作树时,一组引导程序省略了初始数据集中的任何单个条目作为测试数据集。在所有测试集中误差幅度的分类表明,泛化错误的外面评估。在此之前已显示出袋装分类器。与训练集使用具有相同数据点的测试集一样准确。因此,采用脱外估计可以消除对单独的测试集的需求。为了对新的输入数据分类进行分类,每个分类和回归树都对一堂课进行投票,森林确定了获得最高票数的班级49。该方法使用有关树木结构,树木组合,自我评估和后处理的特定准则,显示了反对过度拟合的强度。
与其他机器学习方法相比,在与异常值打交道时,它被认为更可靠50。可变重要性的概念是使用随机子空间方法执行的固有特征选择,并使用Gini杂质索引标准进行评估。GINI指数根据最小化杂质评估了预测变量对回归和分类的强度。为了实现二进制节点的最佳分配,最大程度地提高Gini指数的改进至关重要。从基本的角度来看,低吉尼表明特定的预测因子48,,,,50,,,,51。

随机森林算法的示意图。
线性回归
该方法与线性模型上的数据匹配,其中y和独立X之间的关系被建模为:
$$ y = \ omega _ {0} + \ sum \ limits _ {{j = 1}}}}}^{n} {\ omega _ {j} x_ {j} + \ varepsilon} $$
(2)
©j是重量,0是拦截,是错误术语。尽管很简单,但线性和同质性的假设可能与现实世界数据不符。它的相关性涵盖了预测分析,并且仍然是基于回归的建模的基础,在Chen等人等作品中强调。52。
山脊回归
该技术是线性回归的扩展,通过在损耗函数中添加L2正则化项来解决多重共线性和过度拟合。该术语惩罚了系数的平方幅度,从而阻止它们生长太大,并降低了模型对数据中微小变化的敏感性。通过引入这种惩罚,Ridge回归确保了更好的概括,尤其是在具有高度相关预测指标的高维数据集中。它可以在拟合数据和维护模型简单性之间进行平衡。典型的应用程序包括金融,基因组学和机器学习,对于提高具有许多功能的复杂或嘈杂数据集的预测准确性非常有价值。
脊回归通过将L2正则化添加到成本函数来扩展线性回归:
$ l = \ sum \ limit _ {{i = 1}}}^{n} {(y_ {I} - \ hat {y} _ {y} _ {i})^{2} + \ lambda \ sum \ sum \ sum \ \ \ sum \ \ _ _ = 1}}}} $$
(3)
l是损耗函数,控制正则化,而系数是系数。这种惩罚可以防止系数变得太大,并改善具有多重共线性数据集中的模型稳定性。Hoerl和Kennard的作品为山脊回归奠定了基础,在高维数据集中确立了其有效性53,,,,54。
拉索回归
这种方法是一种线性化的回归变化,可解决过度拟合和多重共线性,但专注于特征选择。与使用L2惩罚的脊回归不同,LASSO回归为损耗函数增加了L1惩罚,这与系数的绝对值成正比。该L1惩罚将多个系数迫使零,不包括某些功能。这种特征使Lasso回归对于高维数据集中的特征选择特别有用,在高维数据集中,许多预测因子可能无关紧要或多余。将某些系数缩小到零有助于改善模型的概括,并通过识别最重要的预测因子来提供更简单,更容易解释的模型。当拉索回归具有许多功能时,它是理想的选择,并且希望通过消除对预测有意义贡献的模型来降低模型的复杂性。结果是一个稀疏的模型,更易于解释并且不容易过度拟合,尤其是在许多相关预测变量的情况下55,,,,56。
拉索回归的应用是多种多样的,跨越了多个领域。在基因组学中,它用于选择最大程度地促进疾病结果的基因子集,有效地降低了数据的维度,同时带来了最关键的预测因子。在金融中,套索回归可以帮助确定影响资产价格或信用风险的关键因素,尤其是当潜在预测因素(例如经济指标或市场指标)的数量很大时。在营销中,它用于确定最大的渠道或功能(例如定价,广告或产品属性)最大的渠道或功能,从而影响消费者的行为,从而使企业有效地分配资源。此外,在机器学习中,套索回归通常用于高维数据集中的稀疏建模,例如图像处理或文本分类,其中只有一小部分功能可能与准确的预测有关。它在防止过度拟合的同时执行功能选择的能力使其在涉及大规模,复杂数据集的应用中特别有用。
拉索回归将L1正则化增加了成本函数:
$ l = \ sum \ limit _ {{i = 1}}}^{n} {(y_ {y} - \ hat {y} _ {y} _ {i})^{2} + \ lambda \ sum \ sum \ sum \ \ \ sum \ \ _ _ = 1}}}}}
(4)
这种惩罚将某些系数缩小到零,有效地可以选择特征选择。Lasso对必须排除无关的预测因子的高维数据特别有用。张等。和Zhan等。在套索回归方面的工作强调了其在稀疏建模中的实用性57,,,,58。
支持向量回归
SVR是一种使用SVM原理的回归方法,该方法通常用于分类任务,但适用于处理回归问题。在SVR中,该模型旨在找到一个函数,该函数近似于输入和输出变量之间的基本关系。但是,具有重要的区别:它并不是要直接将所有点的误差最小化,而是专注于在误差容量和模型复杂性之间找到平衡。SVR定义了一个公差余量,以管道(或对epsilon无敏感的管)表示,其中错误不会受到惩罚。此保证金中的数据点被认为是很好的预测,而利润率以外的数据点基于其与预测值的距离产生了惩罚59,,,,60。
SVR可以以线性和非线性形式实现。在非线性情况下,SVR采用了内核技巧,该技巧将输入数据映射到较高维度的空间中,从而允许模型捕获复杂的非线性关系。流行的内核包括径向基函数(RBF)内核,该核心有助于捕获数据中高度复杂的非线性模式。在处理嘈杂的数据时,VR是强大的,或者我们需要一个平衡拟合数据与避免过度拟合的模型时。它通常用于财务预测,工程和时间序列分析,在这种分析中,针对异常值的精确性和鲁棒性很重要。它与高维数据及其固有的正则化属性良好的能力使其成为需要预测建模的许多领域中的宝贵工具47。
梯度提升机
杰罗姆·弗里德曼(Jerome Friedman)于1999年推出的GBM是一种有监督的合奏学习方法,通过结合多个决策树来构建强大的预测模型。这种迭代方法旨在减少现有树木的错误并增强损失功能以提高分类和回归任务的准确性61,,,,62。GBM因其处理复杂,非线性连接的能力及其能力提供了对特征的重要性和功能选择的辅助功能的能力而受到重视。但是,尽管有这些优势,但GBM可能需要对资源进行要求,并且需要仔细调整超参数(例如树木的学习率和深度),以平衡过度拟合和拟合不足之间的权衡。
该算法使用逐步的迭代方法开始,首先将简单模型(例如决策树)应用于数据。主要目的是最小化损耗函数l(y,f(x)),其中y表示真正的目标,f(x)表示模型产生的预测,而l是损耗函数。该模型在每个阶段都逐渐完善,以减少错误并改善其预测63,,,,64。
构成第一次迭代的初始阶段如下概述。
$ f_ {0}(x)= \ Mathop {\ arg \ min} \ limits_ {c} \ sum \ limits _ {{i = 1}}}}}}^{n}
(5)
对于每个迭代M,第二阶段如下:
计算负梯度(伪残基):
$ r _ {{im}} = - \ left [{{\ frac {{{\ partial l(y_ {i},f(x_ {i})}}}}}}}}} {{\ partial f(x__ {x_ {x_ {i}}}}}}}}}}}}}}}}}}}}}(x)}} $$
(6)
下一个阶段:将基础学习者适合这些残留物:
$ h_ {m}(x)= \ mathop {\ arg \ min} \ limits_ {h} \ sum \ limits _ {{{i = 1}}}}^{n} {n} {(r _}
(7)
第四阶段:更新模型:
$$ f_ {m}(x)= f _ {{m -1}}(x) + \ upsilon .h_ {m}(x)$$
(8)
在GBM算法中,学习率确定每个决策树对整体模型的影响。在每次迭代中,该算法添加了一个新的决策树,以纠正所有以前树的组合预测中的错误。GBM的灵活性源于其自定义损失功能(L)实现特定目标的能力,从而使其成为一种极具适应性的方法。包括正规化参数,例如学习率(!)和树的深度,以增强模型的概括并防止过度拟合。结果,最终分类器是单个树的加权预测总和,逐渐掌握了数据中更复杂的模式65,,,,66,,,,67。GBM算法的示意图如图所示。 5。

梯度提升机(GBM)算法的示意流。
k-near最邻居
KNN主要用于分类和回归。对于分类,该算法使用欧几里得,曼哈顿或Minkowski距离等指标计算查询点与训练集中所有点之间的差异。然后,它标识了K最近的邻居,并分配了其中最常出现的类。在回归中,KNN通过平均(或加权)k最近的邻居的值来预测目标值。K的选择和加权方案显着影响模型性能。重要的是,KNN在计算上是密集型的,因为它需要在运行时存储整个数据集并执行距离计算,从而使大型数据集的效率降低。尽管如此,KNN还是因为其简单性和有效性而受到重视,尤其是当数据分布良好并且对其基础分布没有强大的假设时。
KNN由于其多功能性和易于实施,在各个领域都有广泛的应用。在医学中,它用于疾病诊断,根据年龄,病史和测试结果等特征对患者进行分类。在金融方面,它通过将交易或客户分类为安全或可疑的有助于信用评分和欺诈检测。在电子商务中,通过分析客户行为,将KNN应用于客户细分和个性化建议中。该算法在图像识别和计算机视觉上也很有价值,例如面部识别和对象检测,在该任务中,它根据像素功能对图像进行了分类。
此外,在地理空间分析中,KNN用于预测地理特征,具有相似特征的集群区域,并分析城市规划和农业领域中的土地利用模式。该算法在不规则的决策边界和高维数据设置方面表现出色,其中相似的数据点群集在特征空间中紧密47,,,,68。
极端梯度提升
该技术是基于GBM原理的有效ML,主要用于分类和回归任务。它从基本模型开始,通常是一个简单的决策树,然后迭代地构建其他树以消除错误。通过关注残差,即先前模型的预测值和实际值之间的差异来完成此校正。随后的每个树都经过梯度下降来训练,以最大程度地减少这些残差,从而相应地调整模型的预测。算法的强度之一是结合了L1和L2正则化(Lasso和Ridge),以防止过度拟合,从而促进更直接,更普遍的树木。另一个关键特征是使用加权分位数草图,该草图有效地处理稀疏数据。当模型在验证集上的性能开始降低时,还采用了早期停止来防止过度拟合。最终模型预测是通过汇总所有树的输出来获得的,其中每棵树的贡献都根据其性能加权。XGBoost还允许并行化,使其比其他梯度增强算法更快。调整超参数的灵活性,例如学习率,最大深度,亚采样比和树木数量,进一步提高了其性能和计算效率。这些属性使其在处理大型数据集和复杂的数据模式方面特别有效,从而在机器学习竞争和生产环境中广泛使用。
Xgboost的多功能性使其在各个行业中都非常有效。它被广泛用于金融中,以进行信用评分,风险评估和欺诈检测。它建立了预测模型,以估计诸如贷款违约或欺诈交易之类的事件的可能性。在医疗保健中,XGBoost有助于疾病预测和医学图像分类,这要归功于其在高维医学数据中捕获复杂模式的能力。在电子商务中,它用于客户细分,推荐系统和需求预测,有效地处理庞大的客户交互数据集。营销应用程序还可以从使用XGBoost来预测客户行为,优化广告定位并改善销售预测。由于其在管理稀疏文本数据方面的鲁棒性,该算法在自然语言处理(NLP)任务中很有价值,例如文本分类,情感分析和垃圾邮件检测。能量预测,图像识别(包括自主驾驶和面部识别)以及用于预测地理趋势的地理空间分析,通过Xgboost的预测能力有了显着提高。它在机器学习竞赛中的成功强调了其解决各个行业各种各样和复杂的预测和分类问题的能力,从而巩固了其作为机器学习从业人员的首选工具的地位69,,,,70。
高斯进程机器
该方法是用于回归和分类任务的强大贝叶斯机器学习模型。它将输入和输出之间的关系建模为随机变量的集合,其中任何子集都遵循高斯分布。从数学上讲,GP假定生成预测的函数f(x)分布为:
$$ f(x)\ sim gp(m(x),k(x,x,x \ prime))$$
(9)
m(x)表示平均函数,k(x,xâ²)提出了定义输入x和xâ²之间关系的协方差内核。内核K(x,xâ²)很关键,可以采用诸如rbf(radial basic函数)内核之类的形式:
$ k(x,x,x \ prime)= \ exp \ left({\ frac {{| x -x -x -x \ prime | ^{2}}}}}} {{2 \ ell ^{2}}}}}}}} \ right)$
(10)
其中是长度比例参数。
GP提供了预测的不确定性估计,使其非常适合机器人技术,地统计学和优化应用。但是,随着其计算复杂性随着数据点的数量而产生的,GP模型具有可扩展性的努力。稀疏近似等技术有助于减轻这一挑战。Wenming等。和Su等。为高斯流程提供关键参考,解释其理论,应用和内核设计71,,,,72。
轻梯度提升机
The technique is an efficient, scalable gradient-boosting framework developed by Microsoft that is designed to handle large datasets with high dimensionality while optimizing speed and performance like traditional gradient-boosting methods, building various decision trees, where each new tree corrects the errors made by the previous one.However, LightGBM incorporates several optimizations to enhance its performance, most notably its leaf-wise tree growth strategy, as opposed to the level-wise approach used by other boosting methods.This allows the model to converge faster and achieve better accuracy by focusing on the most impactful data splits.Additionally, LightGBM uses histogram-based algorithms that reduce both computational time and memory usage, making it suitable for large-scale datasets.Its advanced features, including categorical feature handling, parallel and GPU learning support, and built-in cross-validation, make it a powerful tool for rapid model deployment and real-time predictions.
LightGBM is extensively used across various industries for its speed, efficiency, and ability to handle vast data.It powers applications such as credit scoring, risk assessment, fraud detection, and high-frequency trading in finance.It supports predictive modeling for patient outcomes, treatment effectiveness, and disease diagnosis in healthcare.Its rapid computation and accuracy make it ideal for e-commerce and marketing tasks, including recommendation systems, customer segmentation, and churn prediction.LightGBM optimizes network operations and service quality in telecommunications and technology through complex data analysis.The algorithm is also widely applied in NLP tasks like text classification and sentiment analysis, leveraging its ability to handle sparse data.LightGBM’s versatility extends to forecasting applications, such as energy consumption prediction and sales forecasting, underscoring its broad utility in real-time data analysis and decision-making processes.Its exceptional performance and ease of use make it a preferred tool for machine learning practitioners seeking efficient and high-accuracy models65,,,,73。
Elastic net
Elastic Net is a regularization technique that combines the benefits of both Lasso (L1 regularization) and Ridge (L2 regularization) regression methods, making it highly effective for datasets with numerous predictors, significantly when some predictors are correlated or when the number of predictors exceeds the number of observations.Unlike Lasso, which sets some coefficients to zero for feature selection, and Ridge, which shrinks coefficients without eliminating them, Elastic Net combines L1 and L2 penalties.This hybrid approach mitigates the limitations of each method: Lasso’s tendency to select only one variable from correlated predictors and Ridge’s inability to eliminate any variables.By balancing both penalties, Elastic Net can perform feature selection while maintaining model stability, even in the presence of highly correlated predictors.
This technique is beneficial for high-dimensional datasets where multicollinearity is a concern.Lasso can result in a model where only one variable from a group of highly correlated features is retained, potentially missing important predictors.In contrast, Elastic Net retains multiple correlated features, enhancing model accuracy and interpretability.The technique’s flexibility comes from its key parameters: λ (lambda), which controls the regularization strength, and α (alpha), which determines the mix of Lasso and Ridge penalties.When α equals 1, Elastic Net behaves like Lasso;when α equals 0, it behaves like Ridge.Cross-validation is commonly used to find the optimal values of λ and α, ensuring that the model generalizes well to unseen data.Elastic Net’s ability to combine sparsity with stability makes it a robust feature selection and regularization solution, particularly in complex, high-dimensional datasets.
It helps address multicollinearity while performing feature selection for high-dimensional datasets.The objective function is expressed as:
$$L=\sum\limits_{{i=1}}^{n} {{{({y_i} - X_{i}^{T}\beta )}^2}+{\lambda _1}\sum\limits_{{j=1}}^{p} {|{\beta _j}|+{\lambda _2}\sum\limits_{{j=1}}^{p} {\beta _{j}^{2}} } }$$
(11)
Where λ1controls the sparsity (lasso penalty) and λ2controls shrinkage (ridge penalty).Elastic Net finds an optimal balance between feature selection and regularization, making it highly useful when predictors are highly correlated, or there are more features than data points.
Elastic Net is widely applied in domains like genomics, where selecting the most informative predictors among thousands of features is crucial.Guo等。introduced Elastic Net, emphasizing its ability to overcome lasso’s limitations in multicollinear settings while preserving interpretability74,,,,75。
Categorical boosting
CatBoost is a high-performance gradient boosting library developed by Yandex that is designed to efficiently handle categorical features in data modeling tasks involving mixed feature types.Unlike traditional gradient boosting methods that require manual categorical data preprocessing, CatBoost automates this process through permutation-driven transformations and ordered boosting.These innovations lead to improved accuracy and reduced overfitting.The library also introduces symmetric trees for faster model inference, reduced prediction latency, and support for GPU acceleration, enabling efficient processing of large datasets.CatBoost’s robustness, ease of use, and native capability to process categorical data have made it popular in various applications, including finance and e-commerce.Its competitive performance frequently surpasses traditional gradient-boosting methods in modeling accuracy and computational efficiency, making it an invaluable tool for data scientists and analysts.
CatBoost’s efficient handling of categorical data makes it widely applicable across various industries.In finance, it aids in credit scoring, fraud detection, and risk analysis, leveraging categorical features like customer demographics and transaction types.In e-commerce, it enhances recommendation systems, personalized marketing, and customer segmentation by analyzing user preferences and behaviors, even with incomplete data.The library is also beneficial in healthcare for predicting patient outcomes and disease diagnosis using mixed data types such as medical records and test results.Additionally, CatBoost supports churn prediction, targeted advertising, and sales forecasting with rich customer datasets in marketing.
Furthermore, it is applied in natural language processing tasks like text classification and sentiment analysis, thanks to its capability to handle mixed categorical and text data.Its scalability and efficiency make CatBoost popular for real-time predictive analytics and large-scale modeling across retail, telecommunications, and gaming sectors.
CatBoost is a gradient-boosting algorithm specifically optimized for categorical features, relying on ordered target encoding and randomized permutations to reduce overfitting and handle high-cardinality categorical data.Its objective is similar to general gradient boosting:
$$L = \sum\limits_{{i = 1}}^{n} {l\left( {y_{i} ,\hat{y}_{i} } \right) + \lambda \sum\limits_{{j = 1}}^{p} {\Omega (T_{i} )} }$$
(12)
CatBoost ensures faster training, robustness, and improved missing or categorical data handling.These features make it ideal for recommendation systems, retail forecasting, and financial modeling.Cha等。introduced CatBoost, outlining its advantages in efficiently handling categorical and tabular data67,,,,76,,,,77,,,,78。
Data analysis and explication
Polymer resin and biochar are designated as the key adsorbents in this investigation, and representative raw data of high quality are curated to build a reliable predictive model.The laboratory data are drawn from the same sources as those in former research works14。The dataset identified 1750 data points pertinent to adsorption isotherms featuring corresponding adsorbent properties.These points represent the adsorption of 73 organic materials on 50 biochar samples and 30 polymer resins.The input parameters are defined by eight factors: five Abraham descriptors (charge transfer, dipole-dipole interactions, cavity formation, which is the solvent’s ability to accommodate the solute molecule, proton donors reflecting solute’s capability to accept protons in hydrogen bonds, and proton acceptors indicating solute’s capability to give protons in hydrogen bonds), total pore volume (Vt), specific surface area (BET), and logCe (equilibrium concentration).The output parameter is logKd, which measures the adsorption degree.
数字6indicates the boxplot of all the considered variables in this study.Notice that from all the considered data points, 1225, 262, and 263 data points were considered for model training, testing, and validation, respectively.

Scatter matrix plot illustrating variable relationships and distributions.
The Pearson correlation coefficient measures the linear relationship between variables, varying from − 1 to + 1.A value of + 1 indicates a direct correlation, -1 signifies an inverse correlation, and 0 demonstrates a nonlinear relationship.The coefficient is determined through a formula that considers the variables of covariance and standard deviation.It is affected by the data’s linearity, normality, and outliers, which can influence its precision.The strength of the correlation is understood through the absolute value of the coefficient, where larger values signify stronger relationships.Statistical significance is frequently evaluated using hypothesis testing, where a p-value below 0.05 implies a noteworthy correlation.Visual displays, like scatter plots, are frequently utilized to verify the intensity and orientation of the relationship78,,,,79:
$$\:{r}_{j}=\frac{\sum\:_{i=1}^{n}({I}_{i.j}-\stackrel{-}{{I}_{j}})({Z}_{i}-\stackrel{-}{Z})}{\sqrt{\sum\:_{i=1}^{n}{({I}_{i.j}-\stackrel{-}{{I}_{j}})}^{2}\sum\:_{i=1}^{n}{({Z}_{i}-\stackrel{-}{Z})}^{2}}}$$
(13)
In this context, Z represents the second variable, indicated by its average value, Z̄.Additionally, Ī signifies the mean value of the approximate variable Ij.The connection between the input variables and the target factor being studied, particularly the adsorption of organic materials onto resin and biochar, reveals an intriguing dynamic.As illustrated in Fig. 7, it can be deduced that every input variable relates to the resin and biochar adsorption levels through five Abraham descriptors (charge transfer, dipole-dipole interactions, cavity formation, which pertains to the solvent’s capacity to hold the solute molecule, proton donors indicating solute’s ability to accept protons in hydrogen bonds, and proton acceptors denoting solute’s ability to release protons in hydrogen bonds), total pore volume (Vt), specific surface area (BET), and logCe (equilibrium concentration).Among these factors, the degree of adsorption is directly and positively linked to charge transfer, the specific surface area of the adsorbent, and the creation of cavities.

Correlation heatmap showing interrelationships among variable pairs analyzed in the study.
Before building machine learning models from data, assessing the dataset’s quality is crucial to identifying and resolving outliers.This study utilized the Monte Carlo Outlier Detection (MCOD) technique, a method well-regarded for its effectiveness and suitability in managing extensive and high-dimensional datasets.MCOD combines the principles of Monte Carlo sampling with density-based analytical techniques to identify outliers.Specifically, it detects anomalies by assessing the local density of data points within a representative subset of the dataset, enabling efficient recognition of those points that deviate substantially from their neighbors in terms of density.In this context, outliers are defined as data points significantly differing from others in their immediate neighborhood based on density criteria.
The MCOD method first selects a subset of the dataset using Monte Carlo sampling, where the subset is statistically representative of the entire data distribution.Density-based methods are then applied to analyze this subset and pinpoint outliers, dramatically reducing computational complexity compared to an exhaustive evaluation of the entire dataset.This makes MCOD fast and scalable, particularly suitable for high-dimensional and large-scale datasets like those used in this study.Despite its computational efficiency, MCOD does have a trade-off: the accuracy of outlier detection can vary depending on the sample size and the parameterization of key factors like the number of nearest neighbors (k).Proper calibration of these parameters is essential to maintain the robustness and reliability of the results.Nevertheless, MCOD is widely recognized as a practical solution for exploratory data analysis, particularly for applications where approximate results are sufficient, computational resources are limited, or real-time processing is required.
Using MCOD, this study ensures the dataset’s integrity while avoiding undue computational costs.The effectiveness of the technique in managing extensive datasets is demonstrated in Fig. 8, which provides a boxplot of the dataset used in this study.The boxplot visually depicts the dataset’s quality, highlighting that most data points fall within an appropriate range deemed suitable for model development.Using the entire cleaned dataset for model training ensures robust learning while enabling the machine learning models to generalize better to new and unseen data.By addressing overfitting and capturing both patterns and variations across the entire data range, the approaches adopted in this study deliver higher accuracy and reliability in predictive modeling for adsorption processes80,,,,81。

((一个) Outlier detection using the Monte Carlo algorithm;((b) Boxplot representing data dispersion.
Results and discussions
This study utilizes machine learning methods to forecast the adsorption of organic materials onto resin and biochar.The research includes conventional techniques such as linear regression decision trees, sophisticated methods like convolutional neural networks (CNNs), and ensemble algorithms comprising XGBoost, LightGBM, and CatBoost.These various algorithms facilitate an in-depth examination of the most effective approaches for modeling intricate datasets, catering to nonlinear associations and interactions.Ensemble methods balance predictive accuracy and computational efficiency, making them ideal for large-scale applications requiring real-time predictions.
Essential evaluation metrics like the coefficient of determination (R²), residual standard deviation, mean squared error (MSE), and mean relative deviation percentage (MRD%) are used to evaluate model effectiveness.R² reflects the model’s ability to explain the variance in adsorption data, while MSE focuses on the accuracy of predictions.MRD% provides a scale-independent comprehension of error size.These metrics enable a detailed comparison between models, guaranteeing that the selected methods accurately reflect the fundamental processes of adsorption of organic materials onto resin and biochar2,,,,82
$$\:R-squared\left({R}^{2}\right)=1-\frac{{\sum\:}_{i=1}^{N}{({\text{y}}_{\text{i}}^{\text{r}\text{e}\text{a}\text{l}}-{\text{y}}_{\text{i}}^{\text{p}\text{r}\text{e}\text{d}\text{i}\text{c}\text{t}\text{e}\text{d}})}^{2}}{{\sum\:}_{i=1}^{N}{({\text{y}}_{\text{i}}^{\text{r}\text{e}\text{a}\text{l}}-\overline{{\text{y}}^{\text{r}\text{e}\text{a}\text{l}}})}^{2}}$$
(14)
$$\:Mean\:squared\:error\:\left(MSE\right)\:=\:\frac{1}{N}{\sum\:}_{i=1}^{N}{({y}_{i}^{real}-{y}_{i}^{predicted})}^{2}$$
(15)
$$\:Residuals\:Standard\:Deviation\:\left(\sigma\:\right)=\sqrt{\frac{1}{N}{\sum\:}_{i=1}^{N}{({\text{y}}_{\text{i}}^{\text{r}\text{e}\text{a}\text{l}}-{\text{y}}_{\text{i}}^{predicted})}^{2}}$$
(16)
$$\:Mean\:relative\:deviation\:\left(MRD\right)=\frac{100}{N}{\sum\:}_{i=1}^{N}\left(\frac{{y}_{i}^{real}-{y}_{i}^{predicted}}{{y}_{i}^{real}}\right)$$
(17)
这里,\(\:{\varvec{y}}_{\varvec{i}}^{\varvec{p}\varvec{r}\varvec{e}\varvec{d}\varvec{i}\varvec{c}\varvec{t}\varvec{e}\varvec{d}}\)和\(\:{\varvec{y}}_{\varvec{i}}^{\varvec{r}\varvec{e}\varvec{a}\varvec{l}}\)denote the output and real target, respectively.N refers to the data points’ number in the dataset.The tuned hyperparameters of each algorithm is also tabulated in Table 1。
This study presents a comparative analysis of various machine learning regression models applied to a benchmark dataset.A Taylor Diagram (Fig. 9) is utilized to evaluate model performance by simultaneously displaying key metrics such as the correlation coefficient and standard deviation.This diagram facilitates a comparison of models, including Linear Regression, Ridge Regression, Lasso Regression, SVR, Random Forest, Gradient Boosting, KNN, Decision Trees, XGBoost, LightGBM, CatBoost, Gaussian Processes, ANN, and CNN.The proximity of each model’s point to the reference point in the diagram indicates its accuracy and alignment with the actual data, making it an effective tool for evaluating model performance.
The detailed analysis of the Taylor Diagram, supported by the data in Table 2, highlights XGBoost, lightGBM, and CatBoost as the top-performing models.These models exhibit strong correlations with the reference data and minimal standard deviation, evidenced by their proximity to the reference point.Table 2shows that XGBoost achieves an R² value of 0.974 and an MSE of 0.0343, ligtGBM has an R2of 0.964 and MSE of 0.0848, while CatBoost has an R² of 0.984 and an MSE of 0.0264.These results demonstrate the superior predictive accuracy of XGBoost, lightGBM, and CatBoost, outperforming the simpler models in terms of both R² and MSE.
In contrast, simpler models such as Linear Regression, Ridge Regression, Lasso Regression, Elastic Net, Decision Trees, and KNN show significantly lower performance.These models have reduced R² values, ranging from 0.678 to 0.875, and higher MSE values, ranging from 0.18 to 0.43.These results align with existing research, which consistently finds that advanced models like XGBoost, lighGBM, and CatBoost generally outperform more straightforward regression tasks77,,,,79,,,,83。This study emphasizes the importance of choosing more complex models for datasets that require high accuracy and are characterized by complex relationships.
This research employs graphical methods, including relative deviation values and cross plots, to assess the effectiveness and dependability of different machine learning algorithms in forecasting the adsorption levels of biochars and resins.These visual aids are essential for offering thorough insights into model performance by emphasizing patterns and differences between expected and actual values.
数字10contrasts actual and simulated data points from various datasets, encompassing training, testing, and validation sets for all the models created.The analysis shows that the XGBoost, lightGBM, and CatBoost algorithms demonstrate almost the exact alignment between actual and predicted values, highlighting their modeling capabilities.This strong alignment reflects their remarkable ability to capture complex relationships in the dataset.Moreover, Fig. 11displays cross-validation graphs showing the relationships between actual and predicted values for all machine learning models.Interestingly, in the XGBoost, LightGBM, and CatBoost models, data points broadly group around the bisector line (y = x), and their fitted lines closely follow this bisector.This alignment confirms their strong predictive ability, supporting their skill in correctly predicting results that correspond with actual observations.

Cross plots of modeled versus actual values for training, testing, and all datasets across different models.
数字12examines error distributions via scatter plots of relative errors.The errors for the XGBoost, LightGBM, and CatBoost models are evenly distributed around the x-axis, indicating low variance and steady predictive performance.This assessment further strengthens the trustworthiness of these models in reducing prediction errors, thus boosting confidence in their forecasting abilities.图 13demonstrates the models’ predictive distribution abilities throughout the training, testing, and validation stages.The prediction frequency of the XGBoost, lightGBM, and CatBoost models exhibits more consistency across these segments than other algorithms, highlighting their resilience and reliability.This uniformity across various modeling phases underscores these models as the most reliable for practical applications in the adsorption of organic materials onto resin and biochar.
The graphical analysis demonstrates that XGBoost, lightGBM, and CatBoost models efficiently predict the adsorption of organic materials onto resin and biochar, exhibiting low error and consistent performance across different datasets.These results indicate their appropriateness for real-world uses where precise forecasting is essential.

Relative percentage deviation for training, testing, and validation datasets for all models.

Data distribution (counts) among training, testing, and validation datasets for all analyzed models.
Assessing the significance of features is crucial for understanding how input variables contribute to predicting the target variable in machine learning applications.In this study, we utilize the SHAP (Shapley Additive exPlanations) method to explore the complex relationships between features and their significance.From game-theoretic principles, SHAP offers a robust framework for interpreting model outputs, facilitating a detailed understanding of each feature’s contribution to the model’s predictions.
数字14illustrates the SHAP values associated with the input features and the feature importance derived from a Random Forest model used to predict the adsorption of organic materials onto resin and biochar.The features are ranked in descending order based on their average SHAP values, with those ranked highest exerting the most significant impact on the model’s outcomes.This analysis indicates that equilibrium concentration and particles’ specific surface area are the primary determinants of the adsorption degree of resins and biochars.These findings are critical for identifying the key factors governing resins and biochar adsorption degree, providing valuable insights for future research and optimization strategies.This clarity enhances model performance and applicability in real-world scenarios, ultimately allowing stakeholders to make data-driven decisions by understanding the unique influence of each feature on the model’s predictions.

((一个) Feature importance derived from the random forest model;((b) Mean SHAP values illustrating feature relevance.
Future scope
The present study provides a robust framework for modeling the adsorption of organic compounds onto biochars and resins using data-driven machine-learning techniques.However, there are several opportunities for extending and improving this work.First, additional experimental datasets that consider broader variations in biochar and resin types and environmental conditions such as temperature, pH, and pressure could enhance the generalizability of the models.Second, future research can focus on hybrid models integrating physics-based adsorption equations with machine-learning techniques to balance predictive accuracy and interpretability.Third, studies could explore scalability by adapting the models to handle larger datasets from industrial applications or real-time monitoring systems.Another promising direction is applying transfer learning methods, which allow trained models to adapt to adsorption scenarios with minimal additional data.Finally, incorporating domain-specific optimization techniques and exploring other advanced interpretability frameworks (beyond SHAP analysis) can refine the insights into adsorption mechanisms and improve practical applicability.These future developments will ensure the continued improvement of predictive modeling in adsorption processes while broadening its scope in environmental sustainability research.
结论
This research focuses on developing various data-driven models using machine learning algorithms to predict the adsorption of organic compounds on resins and biochars.The models leveraged key descriptors such as Abraham descriptors (charge transfer, dipole-dipole interactions, cavity formation, proton donors, proton acceptors), total pore volume (Vt), specific surface area (BET), and equilibrium concentration (logCe).Various metrics and visualizations were employed to evaluate their performance, while the Monte Carlo technique ensured the dataset’s integrity by efficiently handling outliers.Among these models, XGBoost, LightGBM, and CatBoost emerged as the best-performing techniques, consistently demonstrating high R² values and low error metrics across training, validation, and testing datasets.A sensitivity analysis revealed a strong direct correlation between charge transfer, cavity formation, and adsorption characteristics, highlighting their significance in predicting adsorption levels.Furthermore, SHAP analysis identified equilibrium concentration and specific surface area as the most influential features in determining adsorption behavior.These insights improve the model’s interpretability and reliability, offering a strong foundation for understanding adsorption-related mechanisms.However, this study has certain limitations, including its reliance on adsorption data restricted to specific biochars and resins and excluding external factors (e.g., temperature, pH) that may influence adsorption.Additionally, while the focus here was on high-dimensional machine learning models, future studies could explore domain-specific hybrid models to enhance interpretability and address scalability challenges in real-world settings.This study underscores the superior performance of advanced data-driven models such as XGBoost, LightGBM, and CatBoost in capturing intricate relationships in adsorption-related data.Despite the identified limitations, these models’ predictive accuracy and interpretability emphasize their potential for practical applications, contributing significantly to adsorption process optimization and environmental sustainability efforts.
数据可用性
The data that support the findings of this study are available from the corresponding author, Mohammad Reza Kezemi, upon reasonable request.
参考
Ma, W. et al.Biomimetic durable multifunctional self-cleaning nanofibrous membrane with outstanding oil/water separation, photodegradation of organic contaminants, and antibacterial performances.ACS Appl.母校。接口。12(31), 34999–35010 (2020).文章
一个 CAS一个 PubMed一个 Google Scholar一个 Aghdam, S. K. et al.Thermodynamic Modeling of Saponin Adsorption Behavior on Sandstone Rocks: an Experimental Study
(Arabian Journal for Science and Engineering, 2022).Rojas, S. & Horcajada, P. Metal–organic frameworks for the removal of emerging organic contaminants in water.化学
修订版120 (16), 8378–8415 (2020).文章
一个 CAS一个 PubMed一个 Google Scholar一个 Shi, P., Hu, X. & Duan, M. A UIO-66/tannic acid/chitosan/polyethersulfone hybrid membrane-like adsorbent for the dynamic removal of dye and cr (VI) from water.J. Clean.
产品。290 , 125794 (2021).文章
一个 CAS一个 Google Scholar一个 Kazemi, A., Khezerloo-ye, S., Aghdam & Ahmadi, M. Theoretical and experimental investigation of the impact of oil functional groups on the performance of smart water in clay-rich sandstones.科学。
代表。14 (1), 20172 (2024).文章
一个 CAS一个 PubMed一个 PubMed Central一个 Google Scholar一个 Khezerloo-ye Aghdam, S., Kazemi, A. & Ahmadi, M. Theoretical and experimental study of fine migration during Low-Salinity water flooding: effect of Brine composition on interparticle forces.SPE Reservoir Eval.
工程。26 (02), 228–243 (2023).文章
一个 Google Scholar一个 Bunmahotama, W., Hung, W. N. & Lin, T. F. Predicting the adsorption of organic pollutants from water onto activated carbons based on the pore size distribution and molecular connectivity index.水分。
85, 521–531 (2015). 文章一个
CAS一个 PubMed一个 Google Scholar一个 Ersan, G., Apul, O. G. & Karanfil, T. Predictive models for adsorption of organic compounds by graphene nanosheets: comparison with carbon nanotubes.科学。
总环境。654 , 28–34 (2019).文章
一个 广告一个 CAS一个 PubMed一个 Google Scholar一个 Wu, M. et al.The sorption of organic contaminants on biochars derived from sediments with high organic carbon content.
化学层90 (2), 782–788 (2013).文章
一个 广告一个 CAS一个 PubMed一个 Google Scholar一个 Chen, N. et al.Investigations on the batch and fixed-bed column performance of fluoride adsorption by Kanuma mud.
Desalination268 (1–3), 76–82 (2011).文章
一个 CAS一个 Google Scholar一个 Küncek, Ä°.& Åžener, S. Adsorption of methylene blue onto sonicated sepiolite from aqueous solutions.
Ultrason。超声波。 17(1), 250–257 (2010).
文章一个 PubMed一个 Google Scholar一个
Luo, J. et al.Phase-mediated heavy metal adsorption from aqueous solutions using two-dimensional layered MoS2.ACS Appl.母校。接口。11(42), 38789–38797 (2019).文章
一个 CAS一个 PubMed一个 Google Scholar一个 Zheng, M. et al.Adsorption desulfurization performance and adsorption-diffusion study of B2O3 modified Ag-CeOx/TiO2-SiO2.
J. Hazard。母校。 362, 424–435 (2019).
文章一个 CAS一个 PubMed一个 Google Scholar一个
Zhang, K., Zhong, S. & Zhang, H. Predicting aqueous adsorption of organic compounds onto Biochars, carbon nanotubes, granular activated carbons, and resins with machine learning.环境。科学。技术。 54(11), 7008–7018 (2020).
文章一个 广告一个 CAS一个 PubMed一个 Google Scholar一个
Aghdam, S. K., Kazemi & Ahmadi, M. Studying the effect of various surfactants on the possibility and intensity of fine migration during low-salinity water flooding in clay-rich sandstones.Results Eng. 18, 101149 (2023).
文章一个 CAS一个 Google Scholar一个
Khezerlooe-ye Aghdam, S. et al.Mechanistic assessment of Seidlitzia Rosmarinus-derived surfactant for restraining shale hydration: A comprehensive experimental investigation.化学工程。res。des。 147, 570–578 (2019).
文章一个 CAS一个 Google Scholar一个
Qi, X. et al.Predicting plant cuticle-water partition coefficients for organic pollutants using pp-LFER model.科学。总环境。 725, 138455 (2020).
文章一个 CAS一个 PubMed一个 Google Scholar一个
Zhu, T. et al.Prediction of polydimethylsiloxane-water partition coefficients based on the pp-LFER and QSAR models.生态毒素。环境。SAF。 182, 109374 (2019).
文章一个 CAS一个 PubMed一个 Google Scholar一个
Kobayashi, Y., Uchida, T. & Yoshida, K. Prediction of soil adsorption coefficient in pesticides using physicochemical properties and molecular descriptors by machine learning models.环境。毒醇。化学 39(7), 1451–1459 (2020).
文章一个 CAS一个 PubMed一个 Google Scholar一个
Mazaheri, H. et al.Application of machine/statistical learning, artificial intelligence and statistical experimental design for the modeling and optimization of methylene blue and cd (II) removal from a binary aqueous solution by natural walnut carbon.物理。化学化学物理。 19(18), 11299–11317 (2017).
文章一个 CAS一个 PubMed一个 Google Scholar一个
Sahu, H. et al.Designing promising molecules for organic solar cells via machine learning assisted virtual screening.J. Mater。化学一个。7(29), 17480–17488 (2019).文章
一个 CAS一个 Google Scholar一个 Rahman, R. O. A. et al.Optimizing the removal of strontium and cesium ions from binary solutions on magnetic nano-zeolite using response surface methodology (RSM) and artificial neural network (ANN).
环境。res。 173, 397–410 (2019).
文章一个 PubMed一个 Google Scholar一个
Zhang, Y. & Pan, B. Modeling batch and column phosphate removal by hydrated ferric oxide-based nanocomposite using response surface methodology and artificial neural network.化学工程。J. 249, 111–120 (2014).
文章一个 CAS一个 Google Scholar一个
Zhang, Z. et al.Prediction of carbon dioxide adsorption via deep learning.安格。化学 131(1), 265–269 (2019).
文章一个 广告一个 Google Scholar一个
Panapitiya, G. et al.Machine-learning prediction of CO adsorption in thiolated, Ag-alloyed Au nanoclusters.J. Am。化学Soc。 140(50), 17508–17514 (2018).
文章一个 CAS一个 PubMed一个 Google Scholar一个
Yang, Y. et al.Evaluation of adsorption potential of bamboo Biochar for metal-complex dye: equilibrium, kinetics and artificial neural network modeling.int。J. Environ.科学。技术。 11, 1093–1100 (2014).
文章一个 CAS一个 Google Scholar一个
Asfaram, A. et al.Statistical experimental design, least squares-support vector machine (LS-SVM) and artificial neural network (ANN) methods for modeling the facilitated adsorption of methylene blue dye.RSC Adv。 6(46), 40502–40516 (2016).
文章一个 广告一个 CAS一个 Google Scholar一个
Ahmad, M. W., Mourshed, M. & Rezgui, Y. Trees vs neurons: comparison between random forest and ANN for high-resolution prediction of Building energy consumption.Energy Build. 147, 77–89 (2017).
文章一个 Google Scholar一个
Li, Z. et al.A survey of convolutional neural networks: analysis, applications, and prospects.IEEE Trans。Neural Networks Learn.系统。 33(12), 6999–7019 (2021).
文章一个 广告一个 MathSciNet一个 Google Scholar一个
Ketkar, N. et al.Convolutional neural networks.Deep learning with Python: learn best practices of deep learning models with PyTorch, : pp. 197–242.(2021)。
Yang, X., Nan, X. & Song, B. D2N4: A discriminative deep nearest neighbor neural network for few-shot space target recognition.IEEE Trans。Geosci.Remote Sens. 58(5), 3667–3676 (2020).
文章一个 广告一个 Google Scholar一个
Ali, R. et al.Structural crack detection using deep convolutional neural networks.Autom.Constr. 133, 103989 (2022).
文章一个 Google Scholar一个
Girsang, N. D. Literature study of convolutional neural network algorithm for Batik classification.Brilliance: Res.艺术品。Intell. 1(1), 1–7 (2021).
文章一个 Google Scholar一个
Desai, M. & Shah, M. An anatomization on breast cancer detection and diagnosis employing multi-layer perceptron neural network (MLP) and convolutional neural network (CNN).临床eHealth。4, 1–11 (2021).文章
一个 Google Scholar一个 Zhu, Q.Treatment and Prevention of Stuck Pipe Based on Artificial Neural Networks Analysis
。在Offshore Technology Conference Asia。(2022)。Heidari, E., Sobati, M. A. & Movahedirad, S. Accurate prediction of nanofluid viscosity using a multilayer perceptron artificial neural network (MLP-ANN).
Chemometr.Intell.实验室。系统。 155, 73–85 (2016).
文章一个 CAS一个 Google Scholar一个
Zhou, H. et al.A feature selection algorithm of decision tree based on feature weight.Expert Syst.应用。 164, 113842 (2021).
文章一个 Google Scholar一个
Charbuty, B. & Abdulazeez, A. Classification based on decision tree algorithm for machine learning.J. Appl.科学。技术。趋势。2(01), 20–28 (2021).文章
一个 Google Scholar一个 Priyanka & Kumar, D. Decision tree classifier: a detailed survey.int。
J. Inform.Decis.科学。 12(3), 246–269 (2020).
Purwanto, A. D. et al.Decision tree and random forest classification algorithms for Mangrove forest mapping in Sembilang National park, Indonesia.Remote Sens. 15(1), 16 (2022).
文章一个 广告一个 Google Scholar一个
Ghiasi, M. M., Zendehboudi, S. & Mohsenipour, A. A. Decision tree-based diagnosis of coronary artery disease: CART model.计算。Methods Programs Biomed. 192, 105400 (2020).
文章一个 PubMed一个 Google Scholar一个
Zharmagambetov, A. et al.Non-greedy algorithms for decision tree optimization: An experimental comparison。在。International Joint Conference on Neural Networks (IJCNN)。2021. IEEE.(2021)。
Putra, F. et al.Penerapan Algoritma K-Nearest neighbor Menggunakan wrapper Sebagai preprocessing Untuk Penentuan Keterangan Berat Badan Manusia: application of K-Nearest neighbor algorithm using wrapper as preprocessing for determination of human weight information.MALCOM: Indonesian J. Mach.学习。计算。科学。 4(1), 273–281 (2024).
文章一个 Google Scholar一个
Chern, C. C. et al.A decision tree classifier for credit assessment problems in big data environments.通知。系统。e-Business Manage. 19, 363–386 (2021).
文章一个 Google Scholar一个
Hindrayani, K. M. et al.Indonesian stock price prediction including covid19 era using decision tree regression.in 2020 3rd International Seminar on Research of Information Technology and Intelligent Systems (ISRITI).IEEE。(2020)。
Tangirala, S. Evaluating the impact of GINI index and information gain on classification using decision tree classifier algorithm.int。J. Adv。计算。科学。应用。 11(2), 612–619 (2020).
Bansal, M., Goyal, A. & Choudhary, A. A comparative analysis of K-Nearest neighbor, genetic, support vector machine, decision tree, and long short term memory algorithms in machine learning.Decis.Analytics J. 3, 100071 (2022).
文章一个 Google Scholar一个
Sarica, A., Cerasa, A. & Quattrone, A.Random Forest Algorithm for the Classification of Neuroimaging Data in Alzheimer’s Disease: A Systematic Review。正面。衰老的神经科学。, 9. (2017).
Breiman, L. Bagging predictors.马赫。学习。 24(2), 123–140 (1996).
文章一个 数学一个 Google Scholar一个
Schonlau, M. & Zou, R. Y. The random forest algorithm for statistical learning.Stata J. 20(1), 3–29 (2020).
文章一个 Google Scholar一个
Biau, G. & Scornet, E. A random forest guided tour.测试 25(2), 197–227 (2016).
文章一个 MathSciNet一个 数学一个 Google Scholar一个
Chen, J. et al.A comparison of linear regression, regularization, and machine learning algorithms to develop Europe-wide Spatial models of fine particles and nitrogen dioxide.环境。int。 130, 104934 (2019).
文章一个 CAS一个 PubMed一个 Google Scholar一个
Hoerl, A. E. & Kennard, R. W. Ridge regression: biased Estimation for nonorthogonal problems.技术测量学 12(1), 55–67 (1970).
文章一个 数学一个 Google Scholar一个
Hoerl, R. W. Ridge regression: A historical context.技术测量学 62(4), 420–425 (2020).
文章一个 MathSciNet一个 数学一个 Google Scholar一个
Amini, F. & Hu, G. A two-layer feature selection method using genetic algorithm and elastic net.Expert Syst.应用。 166, 114072 (2021).
文章一个 Google Scholar一个
Zhang, Y., Dai, Y. & Wu, Q. An accelerated optimization algorithm for the elastic-net extreme learning machine.int。J. Mach.学习。Cybernet. 13(12), 3993–4011 (2022).
文章一个 Google Scholar一个
Zhang, F., Sun, K. & Wu, X. A novel variable selection algorithm for multi-layer perceptron with elastic net.神经计算 361, 110–118 (2019).
文章一个 Google Scholar一个
Zhan, W., Wang, K. & Cao, J. Elastic-net based robust extreme learning machine for one-class classification.Sig.过程。 211, 109101 (2023).
文章一个 Google Scholar一个
El-Sebakhy, E. A. Forecasting PVT properties of crude oil systems based on support vector machines modeling scheme.J. Petrol.科学。工程。 64(1), 25–34 (2009).
文章一个 CAS一个 Google Scholar一个
Wandekokem, E. D. et al.Diagnosing multiple faults in oil rig motor pumps using support vector machine classifier ensembles.Integr.Computer-Aided Eng. 18, 61–74 (2011).
文章一个 Google Scholar一个
Hastie, T. et al.Ensemble learning.The elements of statistical learning: data mining, inference, and prediction, : pp. 605–624.(2009)。
Luna, J. M. et al.Building more accurate decision trees with the additive tree.Proc。纳特。学院。科学。 116(40), 19887–19893 (2019).
文章一个 广告一个 MathSciNet一个 CAS一个 PubMed一个 PubMed Central一个 数学一个 Google Scholar一个
Zulfiqar, H. et al.Identification of Cyclin protein using gradient boost decision tree algorithm.计算。结构。生物技术。J. 19, 4123–4131 (2021).
文章一个 CAS一个 PubMed一个 PubMed Central一个 Google Scholar一个
Ayyadevara, V. K.Gradient Boosting Machine, 在Pro Machine Learning Algorithms: A Hands-On Approach to Implementing Algorithms in Python and R。Apress: Berkeley, CA.pp. 117–134.(2018)。
Fan, J. et al.Light gradient boosting machine: an efficient soft computing model for estimating daily reference evapotranspiration with local and external meteorological data.农业。Water Manage. 225, 105758 (2019).
文章一个 Google Scholar一个
Taha, A. A. & Malebary, S. J. An intelligent approach to credit card fraud detection using an optimized light gradient boosting machine.IEEE访问。 8, 25579–25587 (2020).
文章一个 Google Scholar一个
Cha, G. W. & Moon, H. J. KimComparison of random forest and gradient boosting machine models for predicting demolition waste based on small datasets and categorical variables。int。J. Environ.res。公共卫生。18https://doi.org/10.3390/ijerph18168530 (2021)。Kramer, O.
K-NearestNeighbors, in Dimensionality Reduction with Unsupervised Nearest Neighbors.Springer Berlin Heidelberg: Berlin, Heidelberg.13–23.(2013)。
章一个 数学一个 Google Scholar一个
Sado, S. et al.Current state of application of machine learning for investigation of MgO-C refractories: A review.材料 16(23), 7396 (2023).
文章一个 广告一个 CAS一个 PubMed一个 PubMed Central一个 Google Scholar一个
Tyralis, H. & Papacharalampous, G. Boosting algorithms in energy research: a systematic review.神经计算。应用。 33(21), 14101–14117 (2021).
文章一个 Google Scholar一个
Wenming, H. Simulation of english teaching quality evaluation model based on Gaussian process machine learning.J. Intell.Fuzzy Syst. 40, 2373–2383 (2021).
文章一个 Google Scholar一个
Su, G. et al.Gaussian process Machine-Learning method for structural reliability analysis.ADV。结构。工程。 17(9), 1257–1270 (2014).
文章一个 Google Scholar一个
Guo, J. et al.Prediction of heating and cooling loads based on light gradient boosting machine algorithms.建造。环境。 236, 110252 (2023).
文章一个 Google Scholar一个
Qi, K. & Yang, H. Elastic net nonparallel hyperplane support vector machine and its geometrical rationality.IEEE Trans。Neural Networks Learn.系统。 33(12), 7199–7209 (2022).
文章一个 MathSciNet一个 Google Scholar一个
Mokhtari, S., Navidi, W. & Mooney, M. White-box regression (elastic net) modeling of Earth pressure balance shield machine advance rate.Autom.Constr. 115, 103208 (2020).
文章一个 Google Scholar一个
Bentéjac, C., CsörgÅ‘, A. & MartÃnez-Muñoz, G. A comparative analysis of gradient boosting algorithms.艺术品。Intell.修订版 54(3), 1937–1967 (2021).
文章一个 Google Scholar一个
Ajin, R. S., Segoni, S. & Fanti, R. Optimization of SVR and catboost models using metaheuristic algorithms to assess landslide susceptibility.科学。代表。 14(1), 24851 (2024).
文章一个 CAS一个 PubMed一个 PubMed Central一个 Google Scholar一个
Vishwakarma, D. K. et al.Evaluation of catboost method for predicting weekly Pan evaporation in subtropical and Sub-Humid regions.纯的。应用。地球植物。 181(2), 719–747 (2024).
文章一个 广告一个 Google Scholar一个
Hazbeh, O. et al.Hybrid computing models to predict oil formation volume factor using multilayer perceptron algorithm.J. Petroleum Min.工程。 23(1), 17–30 (2021).
Jia, Y., Yu, S. & Ma, J. Intelligent interpolation by Monte Carlo machine learning.地球物理 83(2), V83–V97 (2018).
文章一个 广告一个 Google Scholar一个
Rocco, C. M. & Moreno, J. A. Fast Monte Carlo reliability evaluation using support vector machine.Reliab.工程。系统。SAF。 76(3), 237–243 (2002).
文章一个 数学一个 Google Scholar一个
Feller, N. et al.MRD parameters using immunophenotypic detection methods are highly reliable in predicting survival in acute myeloid leukaemia.白血病 18(8), 1380–1390 (2004).
文章一个 CAS一个 PubMed一个 Google Scholar一个
Zhang, F. & O’Donnell, L. J. Chap.7- Support vector regression, in Machine Learning, A. Mechelli and S. Vieira, Editors.学术的。123–140.(2020)。
致谢
The authors extend their appreciation to the Deanship of Scientific Research at Imam Mohammad Ibn Saud Islamic University (IMSIU) for funding this research work (grant number IMSIU-DDRSP2502).
资金
This work was supported and funded by the Deanship of Scientific Research at Imam Mohammad Ibn Saud Islamic University (IMSIU) (grant number IMSIU-DDRSP2502).
道德声明
竞争利益
作者没有宣称没有竞争利益。
附加信息
Publisher’s note
关于已发表的地图和机构隶属关系中的管辖权主张,Springer自然仍然是中立的。
权利和权限
开放访问This article is licensed under a Creative Commons Attribution 4.0 International License, which permits use, sharing, adaptation, distribution and reproduction in any medium or format, as long as you give appropriate credit to the original author(s) and the source, provide a link to the Creative Commons licence, and indicate if changes were made.The images or other third party material in this article are included in the article’s Creative Commons licence, unless indicated otherwise in a credit line to the material.If material is not included in the article’s Creative Commons licence and your intended use is not permitted by statutory regulation or exceeds the permitted use, you will need to obtain permission directly from the copyright holder.要查看此许可证的副本,请访问http://creativecommons.org/licenses/by/4.0/。重印和权限
引用本文

Hassan, R., Kazemi, M.R. Machine learning frameworks to accurately estimate the adsorption of organic materials onto resin and biochar.
Sci代表15 , 15157 (2025).https://doi.org/10.1038/s41598-025-99759-2
已收到:
公认:
出版:
doi:https://doi.org/10.1038/s41598-025-99759-2