
通过机器学习支持的洪水风险评估来增强城市弹性:将洪水易感性与建筑功能脆弱性相结合
作者:Shi, Haochen
当降雨压倒排水能力时发生的城市洪水是对全球城市越来越紧迫的挑战,尤其是气候变化的复杂影响
1,,,,2。洪水的主要原因包括快速的城市化,这会增加不透水的表面并减少自然吸收,以及不足的排水基础设施,这些基础设施难以处理强烈的降水3。气候变化进一步加剧了这些条件,这会推动更频繁的降雨事件并改变风暴模式4。城市洪水的影响是广泛的,造成人身伤害,重大财产损失以及对基本城市基础设施(例如运输,医疗保健和水服务)的中断5。
这些后果为实现可持续发展目标(SDG)而构成了重大障碍,尤其是SDG 11.5和13.1,以应对应对气候变化的弹性行动6,,,,7,,,,8。这项研究节省了由于城市洪水引起的建立风险的时间,并探讨了潜在的应对措施。先前的研究着重于洪水对建筑结构的直接影响和由此产生的经济损失
9,,,,10,,,,11。但是,研究建筑物功能的破坏(或由洪水造成的功能中断)及其社会经济的影响仍然相对有限5,,,,12。这些疏忽可能会低估洪水的长期社会经济影响6,未分配资源,在洪水之后加重社会负担11,并阻碍洪水期间的关键设施(例如医院和庇护所)的迅速恢复13,,,,14。在洪水风险管理和减少灾难的领域中,基于物理的模型仍然是模拟造成洪水的物理过程(例如降雨,径流和浸润)的主要方法。这些模型基于水文和物理学的基本原理,提供了详细的模拟,从而增强了我们对洪水动态的理解。
常见的例子包括Mike Flood模型,PCSWMM 2D和HEC-RAS。尽管这些模型对于理解洪水事件非常有效,但它们需要广泛的校准数据和大量的计算资源,这可能会限制其在数据基础架构不足的地区的适用性,尤其是在发展中国家15,,,,16。此外,这些模型不适合大型区域的洪水敏感性建模17,,,,18。
另一方面,机器学习(ML)方法正在成为洪水风险管理和减少灾难的一种有希望的替代方案19,,,,20。与基于物理的模型不同,ML方法利用算法从降雨,土地使用和洪水记录等历史数据中自动学习模式21。流行算法如随机森林(RF)22,,,,23,支持向量机(SVM)24,,,,25和catboost26,,,,27广泛用于预测洪水敏感性。具体而言,先前的研究表明,在洪水敏感性映射中,RF的性能要比LightGBM,人工神经网络(ANN)和SVM等方法更好16,,,,28。
这些ML模型的竞争对手是深度学习(DL)方法。例如,卷积神经网络(CNN)和复发性神经网络(RNN)通常用于洪水敏感性分析。这些DL方法的缺点包括重要的计算能力,大量的历史数据以及多个超参数的复杂性16。这些限制使DL技术在限制数据和计算资源的情况下更加实用。
考虑到DL方法的资源密集型性质以及分析情况下的实际约束,本研究依赖于ML技术。他们提供了一个平衡的解决方案,具有有限的数据可用性,将效率和可靠性相结合而无需大量数据集或复杂的架构。
在中国,机器学习在洪水风险和灾难管理研究中的使用已大大增长29,,,,30,,,,31。一个研究领域是在洪水敏感性分析中证明单一和混合ML模型的性能。例如,Yao等人。(2022)比较了六个ML模型(线性回归,K-Nearest邻居,支持向量机,随机森林,堆叠集合模型和混合集合模型),并使用它们来评估Jiangxi中的山洪敏感性32。另一个突出的方向涉及使用新的数据源来改善洪水易感性映射,以解决历史记录和现场调查中稀疏和洪水库存数据稀疏和不足的局限性。Li等。(2023)通过利用新南微博的数据解决了成都的数据稀缺问题,该数据允许城市洪水易感性评估和监测33。Fang等。(2022)将流体动力模型(HEC-HMS/RAS)和快速洪水模型(高于最近排水,手的高度)结合到RF模型中,以增强对洪水易感性评估的训练和验证程序18。
尽管在ML技术中进行了这些尝试,但在中国,探索洪水易感性映射的广泛应用的研究仍然有限。一些全球研究利用易感性图来评估关键基础设施的洪水风险。例如,Yousefi等人。(2020)和Pourghasemi等人(2021)评估了伊朗学校和其他基础设施的洪水风险34,,,,35。Nkeki等。(2022)研究了桥梁和涵洞,道路网络和尼日利亚的建筑物的城市基础设施敏感性36。同样,鲁伊斯(Ruiz)和拉吉布(Rajib)(2022)为美国城市的关键基础设施开发了洪水易感指数37。在这种情况下,我们的研究试图通过探索基于易感性图的洪水风险来弥合这一差距,并提供中国案例研究。
广州是一个三角洲的大型,长期以来一直受洪水的严重影响,这不仅对其居民的安全构成威胁,而且对基础设施和经济发展构成了持续的挑战4,,,,38,,,,39。尽管自2000年以来已经实施了各种政策创新,包括广泛促进绿色基础设施和城市排水系统的增强40,,,,41,建筑功能的重要性一直被忽略。在中国大多数城市中,这种现象很常见。这项研究的发现丰富了有关不同城市元素如何促进城市弹性以及如何设计适应策略的知识42,,,,43,,,,44。
结果
多重共线性分析和灵敏度分析
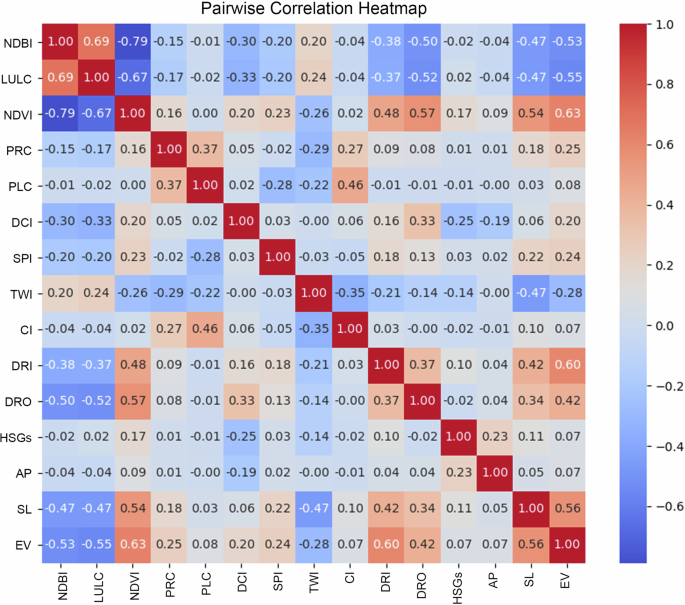
数字1显示洪水调节特征之间的成对相关性。所有测试特征的Pearson系数均低于0.8的阈值。这表明所有洪水条件特征都是独立的,从而进一步利用FSM的RF模型。

值范围从1(强度强)到+1(强正相关),红色代表正相关,蓝色表示负相关。
对于灵敏度分析,我们使用了RF模型的特征重要性来评估各种因素对洪水的影响(图。2)。土地使用和土地覆盖,NDVI以及距离道路的距离是最具影响力的因素。相比之下,诸如高程,建筑物密度(NDBI)以及涵洞和互换距离之类的特征表现出适度的影响。其他功能,包括到河流的距离,坡度,计划曲率和年平均每日降雨,其特征的重要性相对较低。

洪水调节的特征很重要。
数字3说明了由PCA过程得出的前15个主要成分(PC)所解释的累积差异。它表明,前15个主要组件累计解释了原始数据集中80%以上的差异,从而确保这些组件有效地捕获了最重要的信息。

累积差异由建筑功能识别功能的前15个PCA组件解释。
使用从主要成分(PC)得出的特征重要性进行了CATBOOST模型的灵敏度分析。数字4显示Catboost模型使用的15个主要组件(PC)的特征重要性用于对建筑物进行分类。X轴代表特征重要性得分,而Y轴则列出了15个PC。PC1,PC2和PC3是最重要的组件,其功能重要性得分超过8。这些PC捕获数据中的主要模式,对于准确识别建筑物功能至关重要。PC4,PC5和PC6表现出适度的重要性,分数在5到7之间。这些组件为模型的预测贡献了次要但仍然重要的信息。PC10至PC15的重要性相对较低,得分低于4。这些PC在数据中对模型性能的影响有限的数据说明。

PCA组件在构建功能识别方面的重要性。
城市洪水易感性
数字5介绍了城市织物中广州洪水敏感性的独特空间分布(分辨率:100毫米100)。非常高的敏感性区域主要位于广州中部城市地区,例如Liwan,Yuexiu,Tianhe,Haizhu和Baiyun地区。高和中等的易感区域通常与主要的道路网络保持一致。相比之下,在广州外围北部和东部地区,例如康胡瓦(Conghua)和Zengcheng地区。

广州的城市洪水敏感性图(分辨率:100毫米)。
桌子1显示每个城市洪水易感水平的面积和百分比。该地区的61.45%属于非常低的易感性类别,证明了在正常情况下遇到城市洪水最不可能的地区。低和中等类别的类别分别包括该地区的12.39%和9.13%,表明存在洪水概率但范围较大的区域。值得注意的是,高和很高的敏感性水平分别占8.51%和8.52%。
非常高的敏感性区的特征是它们的城市发展和大量人口集群,这可能会加剧洪水事件的风险和后果。由于不透水的表面和排水系统中可能不足的问题,沿通道中等易感区域的线性分布可能表明水倾向于在大雨期间积聚。低水平和非常低的地区的特征是密集的发展和人口密度较低,可能受益于自然排水盆地和更可渗透的土地表面,这将降低洪水的易感性。
构建功能漏洞
数字6介绍广州建筑功能的地图。桌子2提供有关每个功能以及每个功能漏洞的建筑物数量和比例的统计信息。低脆弱性类别包括637,966座商业建筑,占总数的35.64%,55,491座工业建筑,占3.10%和1211个文化建筑,占0.07%。该类别的总和为694,668栋建筑物,占总数的38.81%。住宅建筑属于中等脆弱性类别,总数为1,077,961,最大比例为60.22%。高脆弱性类别包括552座公共服务建筑(0.03%),3057座医疗保健建筑(0.17%)和13,903座教育建筑(0.85%)。高脆弱性建筑物的总数为17,512,占总数的0.98%。

广州的建筑功能分类和空间分布。
数字7显示了建筑功能脆弱性的结果。数字8显示了每个地区每个功能脆弱性的建筑物的比例。建筑功能脆弱性的空间分布揭示了广州地区的显着差异。低v型建筑物在Yuexiu(64.75%),Liwan(64.67%)和Baiyun(54.66%)等地区的多数占多数。中等脆弱性建筑物(主要是住宅建筑物)在郊区和城市化地区最普遍,例如康胡岛(83.66%),南沙(70.62%)和Zengcheng(70.26%)。在所有地区,包括医院,学校和其他基本公共基础设施在内的高险恶性建筑物很少见,天海(4.32%)和Yuexiu(4.10%)的浓度略高。这些地区可能会拥有更多关键的公共设施,从而增加了它们对洪水影响的脆弱性。

广州建筑功能脆弱性水平的空间分布。

每个地区每个功能脆弱性的建筑物的比例。
建造洪水风险
数字9显示了建筑洪水风险的结果。建筑物的洪水风险水平是使用自然断裂方法确定的。此方法旨在最大程度地减少类中的差异,并最大化类之间的差异。桌子3描述了建筑洪水风险的统计结果。属于非常低和低风险类别的建筑物分别占13.66%和24.16%。这表明大多数建筑物位于低敏感性区域或设计较小的功能。相反,非常高的风险类别包括总建筑物的15.99%。这些建筑物可能在容易洪水的位置或执行功能足够至关重要,即使是轻微的洪水也可能导致重大后果。

建筑洪水风险图。
数字10显示了地区一级每个洪水风险类别中建筑物的百分比。康岛,南沙和辛昌等地区在非常低风险的类别中有很大比例的建筑物(图。10a和b)。例如,康胡岛(Conghua)在非常低风险的类别中拥有34.38%的建筑物,在低风险类别中拥有26.44%的建筑物,总计60%以上。同样,辛昌拥有25.80%的建筑物的风险非常低,27.22%的风险低,这表明这些地区的总洪水风险较低。

雷达图显示了广州11个行政区的五个洪水风险水平以下建筑物的比例:非常低的风险(非常低的风险(一个),低风险(b),中等风险(c),高风险(d),而且风险很高(e)。每个轴上的值代表每个地区总建筑物内该特定风险水平的建筑物百分比。线颜色对应于五个风险水平,从浅黄色(非常低)到深红色(非常高)。
在Yuexiu和Liwan中,中等风险建筑物的比例最高(图。10C),分别为56.83%和55.07%。Haizhu,Tianhe和Panyu等地区在高风险类别中显示出更高比例的建筑物(图。10e和f)。Haizhu脱颖而出,其建筑物的36.28%归类为非常高风险,高风险额外的10.45%。天内还显示了相当长的高风险建筑物,高风险为15.13%,风险非常高的30.87%。Panyu的建筑物的19.67%处于高风险状态,30.61%的风险非常高。
这项研究将广州地区分为三种类型,基于洪水易感性和高风险的建筑物的功能脆弱性。这些类型是中央城市地区(I型),中级城市地区(II型)和郊区/农村地区(III型)(图。11)。这些类型之间的主要区别在于洪水易感性范围中等和高功能脆弱性。在中部城市地区(Tianhe,Liwan,Yuexiu,Haizhu),建筑物的易感性最高,值集中在0.9 -1.0范围内。中级城市地区(Baiyun,Huangpu,Panyu)显示出更大的洪水易感性范围为0.7至0.9,该建筑物具有中等至高功能脆弱性的建筑物面临着相似的风险水平。在郊区和农村地区(Nansha,Conghua,Huadu,Zengcheng)中,洪水易感性中等,价值主要集中在0.6 0.8范围内。

功能脆弱性和城市洪水易感性在每个地区的高风险建筑物中的小提琴图。
验证
城市洪水易感性映射的RF模型表明,高精度为0.9132,通过ROC曲线进行进一步验证,AUC值为0.9494,如图2所示。12a。训练精度为0.9627。该模型的5倍交叉验证得分如下:0.9179、0.9254、0.9254、0.8731、0.9328,平均交叉验证精度为0.9149。鉴于这些指标,我们将模型的预测性能评估为预期应用的足够。

ROC曲线显示了测试数据集上洪水敏感性模型的分类性能。b建筑功能识别模型中每个类别的ROC曲线,包括商业,住宅,工业和教育类别。用于建筑功能识别的CATBOOST模型显示出相对较高的精度,得分为0.8561。
每个类别的ROC曲线和AUC值如图2所示。12b。准确性如下:商业类0.8333,0.8595级住宅类别,0.8451和教育类0.8455。训练准确性为0.9320。该模型的5倍交叉验证得分如下:0.9235 0.9239,0.9242,0.9248,0.9230,平均交叉验证精度为0.9239。这表明该模型已良好,并且没有明显的过度拟合。我们随机采样了已确定的建筑功能,并将其与卫星图像和百度街观察结果进行了比较。分析表明,预测功能与实际建筑物使用之间存在很强的对齐(补充表3)。讨论
我们提出了一些高风险和非常高风险的建筑的措施,包括四种策略:避免,抵抗,韧性和可恢复性
12,,,,45,,,,46(桌子4)。回避的重点是通过将建筑物置于低风险区域,提升结构或采用物理障碍来减少暴露。阻力强调了防止洪水进入建筑物的措施,例如安装洪水门和障碍物或使用防水材料。弹性旨在通过纳入促进快速干燥,清洁和重新占领的同时保持结构稳定性的功能来减轻长期损害。作为弹性的一部分,可偿还性突出了设计易于修复或更换的元素的重要性,例如模块化固定装置或牺牲饰面。
这项研究为现有的有关城市洪水风险评估的文献做出了重大贡献,并直接与可持续发展目标(SDGS)11.5和13.1的目标保持一致,这强调了减少自然灾害的不利影响,并增强适应能力对气候相关危害的能力。通过采用随机森林(RF)和Catboost模型进行城市洪水分析,该研究扩大了机器学习(ML)技术在建造洪水风险建模中的应用。它被认为是应用程序保持相对有限的领域21,,,,47,,,,48。
在这项研究中,一个显着的创新是开发了一种新型方法,用于定义RF模型的非渗透点。具体而言,非液化点被确定为所有对洪水淹没点之间最短距离的四分之三痕迹的点。该标准显着增强了模型性能(表5)。这种方法学改进解决了洪水易感性建模的关键挑战,并为类似分析设定了新标准。
在建筑功能识别方面,以前的研究通常依靠城市土地利用数据或街道视图图像来推断功能49,,,,50。尽管已经探索了兴趣点(POI)和感兴趣的领域(AOI)数据,但它们的全部潜力仍未开发。现有研究主要将POI,AOI和建筑物的几何形状与形态学结合起来,以推断建筑物功能51,,,,52。这项研究通过采用CATBOOST模型来推断建筑功能,尤其是在POI和AOI数据稀疏的领域,扩大了POI和AOI数据的利用。
此外,这项研究通过从英国汲取灵感来促进对中国建筑脆弱性分级的理解。传统上,中国建立脆弱性分类主要集中于地震期间的结构和物质性能53。为了解决与洪水有关的漏洞评估的差距,本研究适应并整合了英国国家规划政策框架54,使用其最高标准作为分配漏洞值的参考。
所提出的方法可适应其他城市。对于洪水易感模型,可以直接在具有洪水记录的城市中直接应用定义非液化点的方法。为了构建功能识别,POI和AOI数据的集成提供了一个实用的框架,因为许多城市都可以访问类似的数据集或可以利用公开可用的资源。
在这种方法的更广泛的适用性中,应谨慎两点。首先,洪水记录可能会引入系统偏见,因为它们通常是从通常分布不均的官方监测站获得的。这些电台通常集中在城市中心,在郊区或农村地区的覆盖范围有限。未来的研究可以通过合并其他数据源(例如新闻报道或社交媒体)来解决这一限制。其次,特征选择需要本地知识,包括特定的建筑物使用模式,在不同城市之间可能会有很大的不同。
这项研究的一个局限性在于方法论。它包括技术验证和基于现场的验证。现场验证涉及随机采样建筑功能,并将其与卫星图像和百度街景观进行比较。但是,街道查看数据的可用性限制了验证范围,这可能会产生一些不确定性。
未来的研究可以探索几个方向,以进一步推进这项研究。一个有希望的途径是研究替代模型的性能,例如深度学习技术,在洪水易感性映射和建筑功能识别中,以评估其与传统的机器学习方法相比的潜在优势和局限性。此外,结合社会经济指标,例如收入水平,住房质量,服务能力以及应对能力指标,可以增强建筑功能脆弱性模型的全面性。探索的另一个关键领域是通过包括土地使用和降雨模式的预测来整合未来的气候场景,从而实现了更具动态和时间敏感的洪水风险评估。最后,通过在多个城市和环境环境的多个城市进行验证,以基于现场的验证来扩大验证工作,可以提高所提出方法的鲁棒性和概括性。
总而言之,本文通过机器学习模型的视角研究了建筑洪水风险,并探讨了这些评估如何为有效的风险管理策略提供信息。它通过将城市洪水敏感性与建筑功能脆弱性整合在一起,对广州进行全面评估。该研究利用机器学习模型,包括随机森林(RF)和Catboost,结合了洪水记录,水文和地形特征,人类活动,建筑足迹以及AOL和POL数据,以对建筑洪水风险进行细微的分析。
这项研究的主要发现为城市洪水风险管理提供了一些重要的见解:(1)分析显示了整个广州洪水易感性的显着空间差异。中央地区的人口密度和密集的发展具有非常高的洪水敏感性,而周边地区通常表现出非常低的敏感性。(2)该研究还表明,大多数建筑物属于中等功能脆弱性类别,不到2%被归类为高度脆弱。(3) Based on the flood susceptibility and function vulnerability of very high and high-risk buildings, Guangzhou districts are categorized into three types: Type I (central urban districts) with the highest flood susceptibility (0.9–1.0), Type II (intermediate urban districts) with a broader range (0.7–0.9), and Type III (suburban/rural districts) with moderate susceptibility (0.6–0.8).这些类型之间的区别在于易感性范围,其中中度至高功能脆弱性集中。
这些发现强调了量身定制的洪水风险管理策略的重要性,这些策略解决了建筑物的独特敏感性和功能脆弱性。通过为城市规划师和政策制定者提供对建筑洪水风险的更深入的了解,这项研究使他们拥有有效减轻与水相关的危害所需的工具,尤其是面对气候变化加剧的挑战。
方法
研究区域
广州是中国南部的首都P. R.中国(图。13),总面积约为7434.40公里2超过1500万人。广州由11个地区组成:Tianhe,Yuexiu,Haizhu,Baiyun,Huangpu,Liwan,Panyu,Huadu,Nansha,Conghua和Zengcheng地区。广州位于亚热带季风气候区,年平均降水量从1673.0毫米到2004.6毫米不等。该市的降雨全年分布不均,大约80%的降雨主要发生在4月至9月。此外,广州平均每年约150个降水日。

研究区域。
广州的快速城市化由于土地使用变化,排水系统的变化和人口密度高而大大增加了洪水风险55,,,,56。不透水的表面(例如道路和建筑物)的扩展减少了自然吸水,导致大雨期间更大的地面径流57。This, combined with the reduction of green spaces and wetlands, intensifies the city’s vulnerability to flooding58。The rapid growth has also outpaced the capacity of existing drainage infrastructure, which is often outdated and insufficient for managing increased runoff59。Additionally, the city’s dense population heightens exposure and complicates emergency response efforts, as more people are concentrated in flood-prone areas60。Vulnerable communities, particularly those in informal or substandard housing, face amplified risks due to inadequate infrastructure and limited resources61。
Guangzhou is confronting a significant risk of urban flooding62,,,,63。On 8 September 2023, Guangzhou experienced an extraordinary rainstorm, remarkable for its intense downpour and broad impact.The intense rainfall in Guangzhou led to severe waterlogging across various areas, resulting in the temporary closure of Shiqiao Station on Metro Line 3 in Panyu District due to deep water accumulation.In response to the rainstorm warning, several districts in Guangzhou suspended school classes.According to the city’s flood, drought, and typhoon control headquarters, a total of 2516 people had been evacuated from hazardous zones in Guangzhou64。
Research design
Building flood risk is calculated by a function of urban flood susceptibility and building function vulnerability65,,,,66,,,,67,,,,68。This study consists of three steps: (1) mapping urban flood susceptibility, (2) assessing building function vulnerability, and (3) measuring building flood risk (Fig.14)。

Step-wise methodological framework of the study.
Urban flood susceptibility mapping

Flood inventory map of Guangzhou.
-
(1)
Ubran Flood Inventory Map Generation: Flood inventory plays a critical role in understanding flood susceptibility by providing a comprehensive database of past flood events, including their locations and causes.Recent studies emphasize that accurate flood inventories are essential for developing reliable flood susceptibility models, as they serve as training datasets for machine learning algorithms21,,,,69。The urban flood inventory list of Guangzhou is provided by the Guangzhou Emergency Management Bureau.The original list contained 488 records, but some were duplicates or no longer relevant due to infrastructure development, thus leaving 479 records of waterlogging after the cleanup.Duplicates were removed by geocoding the flooded points to obtain their geographic coordinates.Points with identical locations were identified and duplicates were deleted.The original format of the list is an Excel spreadsheet, which includes fields such as the name of the waterlogged (inundation) sites, type, and risk level.The location of the flooded records is performed through geographic coding based on the names of these waterlogged sites.
Additionally, an equal number of non-flooded sites is selected.We establish buffer zones around flood points by calculating the nearest neighbor distances between them and selecting the 3/4 quartile for the buffer’s extent.Non-flooded points are required to not only fall outside these buffers but also be located in areas of higher elevation.数字15shows the flood-recorded and non-flooded points in the study area.Of these sites, 70% are randomly chosen for model training, while the remaining 30% are allocated for testing the model70。(2)Feature selection: This study incorporates 15 features from hydrological, topographical, and anthropogenic perspectives
-
71
,,,,72,,,,73。For example, higher annual average daily precipitation increases water input, raising flood risk, while areas closer to rivers are more prone to flooding due to overflow.Steeper slopes reduce flood susceptibility by promoting runoff, whereas lower elevations are more vulnerable to water pooling.Urban land use increases susceptibility through impervious surfaces, while vegetative land use mitigates it by absorbing water.Proximity to roads further contributes to flooding by reducing infiltration and altering water flow.Pearson correlation coefficients (PCC) are calculated to avoid multicollinearity in the selected features74。The PCC between two sets of samples\({人工智能}\,\)(i = 1, 2, 3,…, n) and\({双}\)(i = 1, 2, 3,…, n) can be represented as Eq.((1):$$PCC=\frac{{\sum }_{i=1}^{n}({a}_{i}-\overline{a}){\sum
}_{i=1}^{n}({b}_{i}-\overline{b})}{\sqrt{{\sum }_{i=1}^{n}{({a}_{i}-\overline{b})}^{2}{\sum }_{i=1}^{n}{({b}_{i}-\overline{b})}^{2}}}$$
(1)
在哪里\({人工智能}\)和\({双}\)are variable values for\({人工智能}\)和\({双}\),,,,\(\mathop{a}\limits^{\bar{} }\)和\(\mathop{b}\limits^{\bar{} }\)are the average of\({人工智能}\)和\({双}\), 分别。A Pearson coefficient approaching 1 signifies a strong positive correlation between two features, while a coefficient near 0 suggests their independence.Previous studies indicated that the absolute value of a Pearson coefficient of more than 0.8 may contribute to collinearity75,,,,76,,,,77。
-
(3)
Mapping the Urban Flood Susceptibility based on the Random Forest (RF): The RF model is an ensemble machine learning method that combines multiple decision trees to improve prediction accuracy78。It uses a process called bagging (bootstrap aggregation), where random subsets of data are used to build each tree.This reduces overfitting and enhances model robustness.The RF model is also capable of handling complex, non-linear relationships and identifying key factors influencing flood susceptibility, such as topography, land use, and rainfall intensity.
The RF has been widely applied in flood susceptibility mapping due to its high accuracy and ability to process large-scale, heterogeneous data72,,,,79,,,,80,,,,81。It is particularly effective for large-scale analyses, such as national or regional assessments23,,,,29,,,,82。Therefore, this study adopts the RF model to map urban flood susceptibility.
The training data, comprising flood conditioning features, is input into the Random Forest (RF) model, and its performance is evaluated using the test data.To optimize the model and mitigate overfitting, a GridSearchCV approach with 5-fold stratified cross-validation is employed.The hyperparameters of the Random Forest model were optimized using grid search to achieve the best performance.The final configuration included 75 trees (n_estimators), a maximum tree depth of 10 (max_depth), a minimum of 5 samples required to split a node (min_samples_split), and at least 3 samples per leaf node (min_samples_leaf).The max_features parameter was set to sqrt, ensuring a balance between computational efficiency and model accuracy.Once the model’s performance meets the required standards, the study area of Guangzhou is divided into a 100 m × 100 m grid, with center points extracted alongside their corresponding flood conditioning features.These data points are then input into the trained RF model to generate probability outputs, which are subsequently interpolated using the Inverse Distance Weighting (IDW) method to produce a flood susceptibility map for the entire study area.
-
(4)
Validation of the Urban Flood Susceptibility Model: The performance of the RF model is evaluated through the accuracy, the receiver operating characteristic (ROC) curve, and the area under the ROC curve (AUC).Accuracy is the ratio of correctly predicted samples to all samples.True positive (TP) and false positive (FP) denote the count of actual flood-recorded and non-flooded points, respectively, that are predicted as flooded points.True negative (TN) and false negative (FN) denote the count of actual flood-recorded and non-flooded points predicted as non-flooded points.Notably, the TP and the TN represent correctly predicted samples.We employed the accuracy (as defined in Eq. (2) to evaluate the predictive performance of the RF model.
$$Accuracy=\frac{TP+TN}{TP+TN+FP+FN}$$
(2)
The ROC curve and the AUC are regarded as some of the best indicators for model assessment83。The ROC curve plots the model’s ratio of correctly predicted pixels (True Positive Rate (TPR) known as sensitivity, Eq. (3)) against the ratio of incorrectly predicted pixels (False Positive Rate (FPR) known as 1-sensitivity, Eq. (4)。
$$TPR=\frac{TP}{TP+FN}$$
(3)
$$FPR=1-\frac{TN}{FP+TN}$$
(4)
The range of the AUC is between 0.5 (poor predictive ability) and 1 (the highest accuracy and reliability).Values greater than 0.8 typically indicate very good model performance84。
Building Function Vulnerability Assessment
Building function vulnerability assessment includes identifying building functions and classifying their vulnerability.This study proposes a CatBoost model for building function identification using building footprints, Points of Interest (POI) data, and Areas of Interest (AOI) data.Catboost uses ordered boosting and permutation-driven techniques to mitigate prediction shift and overfitting, making it particularly effective for handling categorical features85。Using CatBoost in building function identification is an exploratory attempt.The function vulnerability is classified according to the UK’s National Planning Policy Framework (Supplementary Table1)54, which has been recognized as an effective standard by other researchers11。The detailed processes are listed as follows:
-
(1)
Data Preparation: Building footprints are categorized based on spatial relationships with AOIs and POIs into labeled and unlabeled datasets.AOI and POI data are partly validated against satellite imagery and Baidu Street View (Supplementary Table2)。We reclass the AOIs and POIs data into seven categories, including residential AOIs and POIs, industrial AOIs and POIs, educational AOIs and POIs, commercial POIs, cultural POIs, and public services POIs.It is observed that commercial POIs constituted the largest number and proportion, but most are small businesses, making it difficult to determine the primary function of the buildings.Therefore, POIs are classified into two categories: those with low importance but high density (commercial and industrial), and those with high importance but low density (residential, healthcare, public facilities, education, and cultural)52。If a building contains only the former type of POIs, its function is determined by these POIs.Otherwise, the function is determined by the latter type of POI.Labeled data are presented in Table6。Due to weak labels inferred from AOI and POI, unsupervised noise reduction is applied49。Labeled data is split into training and test datasets in a 7:3 ratio.
-
(2)
Feature Processing: We select twenty-two features across three categories: urban function structure, building geometry, and building surroundings (Table7)。The urban function structure is described using POI kernel density estimation86,,,,87。The building geometry is referenced by Lin et al.(2021).To describe building surroundings, we use the nearest distance to each category of POI.Missing values are handled using the K-nearest neighbors (KNN) method.After standardization, polynomial processing (degree = 2) is first used to enhance the feature set by capturing nonlinear interactions and higher-order relationships.Then PCA is applied to reduce the feature space to 15 components, preserving over 80% of the variance while ensuring computational efficiency and reducing overfitting88。
-
(3)
Resampling: To address the imbalanced sample distribution (Table6), Adaptive Synthetic Sampling Method (ADASYN) resampling is used to balance the training set.ADASYN, proposed by He et al.(2008), generates synthetic data points for minority classes, improving the classifier’s performance on imbalanced datasets by focusing more on difficult-to-classify examples89,,,,90。
-
(4)
Model Training and Evaluation: Due to the low number of buildings with public, healthcare, and cultural functions, and based on the assumption that AOIs and POIs can initially identify these, only residential, commercial, educational, and industrial functions are considered during model training.The Categorical Boosting (CatBoost) model, a gradient boosting algorithm, employs ordered boosting to minimize overfitting and reduce prediction bias, ensuring accurate and reliable results85。Additionally, CatBoost is computationally efficient and well-suited for datasets with mixed numerical and categorical variables.Using CatBoost model in building function identification is an exploratory attempt.
A balanced training dataset is utilized to train the CatBoost model.To improve robustness and prevent overfitting, key hyperparameters such as iterations (1500), learning rate (0.01), L2 regularization (18), and depth (12) were adjusted.A 5-fold stratified cross-validation is also used to validate model performance.Model performance is validated using the test set with the accuracy of each function.
-
(5)
Function Classification and vulnerability assessment: The trained Catboost model is used to predict the functions of unlabeled building footprint data.We referenced the UK’s National Planning Policy Framework (NPPF) (Supplementary Table1), which classifies flood vulnerability based on use and facility.This classification is based partly on the need for some functions to be maintained during flooding such as hospitals and police stations.Then we assigned vulnerability values of 3 to “highly vulnerable†functions, 2 to “more vulnerable†functions, and 1 to “less vulnerable†functions (Table8)。The building function vulnerability results are aggregated by districts for urban management, urban planning, and policy-making.
Building Flood Risk Measuring
In this study, we draw upon the risk matrix to reinterpret risk as the likelihood of a disaster occurring and the potential impact it may have91。The risk matrix is a tool extensively used in natural disaster risk assessment and project risk management92。The Eq.((5) shows the function of the risk matrix.
This research attempts to incorporate the urban flood susceptibility model and building function vulnerability into the risk matrix, thereby extending its practical applications.During the assessment process, “urban flood susceptibility†denotes the likelihood of the flood hazard29,,,,72,,,,93,,,,94, while “function vulnerability†of buildings signifies the impact of flood11,,,,54。
Building flood risk is calculated using Eq.((6)。We extract the urban flood susceptibility of each building and multiply it by the function vulnerability.This methodological approach enables a nuanced assessment of risk by integrating both the location-specific susceptibility to flooding and the inherent vulnerability determined by the building functions.The building flood risk results are summarized by districts to support urban management, urban planning, and policy-making.
$$Risk=Likelihood\times Impact$$
(5)
$$Risk\,=\,Urban\,Flood\,Susceptibility\times Function\,Vulnerability$$
(6)
Urban flood conditioning features
This study selected 15 features from hydrological, topographical, and anthropogenic perspectives to input into the RF model71,,,,72,,,,73。The hydrological features include the stream power index (SPI), annual average daily precipitation (AP), distance from rivers (DRI), and hydrological soil groups (HSGs).Topographical factors include elevation (EV), slope (SL), topographic wetness index (TWI), convergence index (CI), plan curvature (PLC), and profile curvature (PRC).The anthropogenic factors included in the analysis are distance from roads (DRO), distance from culverts and interchanges (DCI), land use and land cover (LULC), the normalized difference vegetation index (NDVI), and the normalized difference built-up index (NDBI).A detailed description of urban flood conditioning features is shown in Table9below and Supplementary Figs.1,,,,2, 和3。
Building function identification features
The building footprint dataset is adopted from Shi et al.(2024)., which is identified based on Google Earth imagery, global urban boundaries, and local climate zones, using a Boundary-enhanced network95。The average recall and precision rates were 84.52% and 81.06%, respectively.Samples of buildings in Guangzhou are shown in Fig.16。The total number of buildings in Guangzhou is 1,790,141 after data cleaning.

Satellite image of a central urban area in Guangzhou (一个) and extracted building footprints corresponding to the same central area (b)。Satellite image of peripheral area in Guangzhou (c) and extracted building footprints to the same peripheral area (d)。The building function identification features are listed in Table
10。The urban function structure features contain the kernel density estimation (KDE) of residential POI, cultural POI, educational POI, industrial POI, healthcare POI, commercial POI, and public service POI.The building geometry contains area, perimeter, regularity, height, compactness, number of nodes, aspect ratio orientation, and radius shape index of buildings.The building surroundings include the distance from buildings to the nearest residential POI, cultural POI, educational POI, industrial POI, healthcare POI, commercial POI, and public service POI.AOI and POI data are obtained from the Baidu Map and are validated by comparing satellite imagery and Baidu Street View (Supplementary Table2)。All procedures are operated on ArcGIS 10.8 or Python programming.
数据可用性
This paper includes the digital elevation model (DEM) data, hydrological soil groups data, annual average daily precipitation data, land use and land cover, building footprint data, building height data, POI data, and AOI data.The DEM data are downloaded from the Geospatial Data Cloud.((http://www.gscloud.cn)。The hydrological soil groups data are collected from the Global Hydrologic Soil Groups (https://daac.ornl.gov/SOILS/guides/Global_Hydrologic_Soil_Group.html)。The annual average daily precipitation data are derived from the Chinese 30-meter resolution annual mean precipitation dataset (1991-2020) of the Fine Resolution Mountainous Environmental Mapping Program (FRMM).The land use and land cover data are collected from Sentinel-2 10 m Land Use/Land Cover Time Series.The building footprint data are downloaded athttps://doi.org/10.5281/zenodo.8174931。The building height data are downloaded athttps://zenodo.org/records/7827315。The POI and AOI data are collected from Baidu Maps (https://map.baidu.com/)。
代码可用性
The code that supports the findings of this research is available from the corresponding author upon request.
参考
Hosseini, F. S. et al.Flash-flood hazard assessment using ensembles and Bayesian-based machine learning models: Application of the simulated annealing feature selection method.科学。总环境。 711, 135161 (2020).
文章一个 Google Scholar一个
McDermott, T. K. J. Global exposure to flood risk and poverty.纳特。社区。 13, 3529 (2022).
文章一个 Google Scholar一个
Wang, Y. et al.Spatial characteristics and driving factors of urban flooding in Chinese megacities.J. Hydrol. 613, 128464 (2022).
文章一个 Google Scholar一个
Chan, F. K. S. et al.Build in prevention and preparedness to improve climate resilience in coastal cities: Lessons from China’s GBA.One Earth 4, 1356–1360 (2021).
文章一个 Google Scholar一个
Qin, X.-L., Wang, S.-F.& Meng, M. Flood cascading on critical infrastructure with climate change: A spatial analysis of the extreme weather event in Xinxiang, China.ADV。攀登。Change Res. 14, 458–468 (2023).
文章一个 Google Scholar一个
Allaire, M. Socio-economic impacts of flooding: A review of the empirical literature.Water Secur 3, 18–26 (2018).
文章一个 Google Scholar一个
Güneralp, B., Güneralp, Ä° & Liu, Y. Changing global patterns of urban exposure to flood and drought hazards.地球。环境。改变 31, 217–225 (2015).
文章一个 Google Scholar一个
Xing, Z. et al.Flood vulnerability assessment of urban buildings based on integrating high-resolution remote sensing and street view images.维持。Cities Soc. 92, 104467 (2023).
文章一个 Google Scholar一个
Balasbaneh, A. T., Abidin, A. R. Z., Ramli, M. Z., Khaleghi, S. J. & Marsono, A. K. Vulnerability assessment of building material against river flood water: case study in Malaysia.IOP Conf.ser。地球环境。科学。 476, 012004 (2020).
文章一个 Google Scholar一个
Englhardt, J. et al.Enhancement of large-scale flood risk assessments using building-material-based vulnerability curves for an object-based approach in urban and rural areas.纳特。Hazards Earth Syst.科学。 19, 1703–1722 (2019).
文章一个 Google Scholar一个
Park, K. & Won, J. Analysis on distribution characteristics of building use with risk zone classification based on urban flood risk assessment.int。J.减少灾害风险。 38, 101192 (2019).
文章一个 Google Scholar一个
Tagg, A. et al.A new standard for flood resistance and resilience of buildings: new build and retrofit.E3S Web Conf. 7, 13004 (2016).
文章一个 Google Scholar一个
Arvin, M., Beiki, P., Hejazi, S. J., Sharifi, A. & Atashafrooz, N. Assessment of infrastructure resilience in multi-hazard regions: A case study of Khuzestan Province.int。J.减少灾害风险。 88, 103601 (2023).
文章一个 Google Scholar一个
Escarameia, M., Walliman, N., Zevenbergen, C. & De Graaf, R. Methods of assessing flood resilience of critical buildings.Proc。研究民间。工程。- Water Manag. 169, 57–64 (2016).
文章一个 Google Scholar一个
Abdrabo, K. I. et al.Integrated methodology for urban flood risk mapping at the microscale in ungauged regions: A case study of hurghada, egypt.Remote Sens 12, 3548 (2020).
文章一个 Google Scholar一个
Saber, M. et al.Enhancing flood risk assessment through integration of ensemble learning approaches and physical-based hydrological modeling.Geomat.纳特。Hazards Risk 14, 2203798 (2023).
文章一个 Google Scholar一个
Afshari, S. et al.Comparison of new generation low-complexity flood inundation mapping tools with a hydrodynamic model.J. Hydrol. 556, 539–556 (2018).
文章一个 Google Scholar一个
Fang, L., Huang, J., Cai, J. & Nitivattananon, V. Hybrid approach for flood susceptibility assessment in a flood-prone mountainous catchment in China.J. Hydrol. 612, 128091 (2022).
文章一个 Google Scholar一个
Ayyad, M., Hajj, M. R. & Marsooli, R. Climate change impact on hurricane storm surge hazards in New York/New Jersey Coastlines using machine-learning.Npj Clim.大气。科学。 6, 88 (2023).
文章一个 Google Scholar一个
Sharma, A. et al.Comprehensive evaluation of machine learning algorithms for flood susceptibility mapping in wardha river sub-basin, India.Acta Geophys。https://doi.org/10.1007/s11600-024-01471-8(2024)。
Seydi, S. T. et al.Comparison of machine learning algorithms for flood susceptibility mapping.Remote Sens. 15, 192 (2023).
文章一个 Google Scholar一个
Demissie, Z., Rimal, P., Seyoum, W. M., Dutta, A. & Rimmington, G. Flood susceptibility mapping: Integrating machine learning and GIS for enhanced risk assessment.应用。计算。Geosci。 23, 100183 (2024).
文章一个 Google Scholar一个
Kaiser, M., Günnemann, S. & Disse, M. Regional-scale prediction of pluvial and flash flood susceptible areas using tree-based classifiers.J. Hydrol. 612, 128088 (2022).
文章一个 Google Scholar一个
Liu, J. et al.Assessment of flood susceptibility mapping using support vector machine, logistic regression and their ensemble techniques in the Belt and road region.Geocarto Int. 37, 9817–9846 (2022).
文章一个 Google Scholar一个
Tehrany, M. S., Pradhan, B., Mansor, S. & Ahmad, N. Flood susceptibility assessment using GIS-based support vector machine model with different kernel types.系列 125, 91–101 (2015).
文章一个 Google Scholar一个
Ajin, R. S., Segoni, S. & Fanti, R. Optimization of SVR and CatBoost models using metaheuristic algorithms to assess landslide susceptibility.科学。代表。 14, 24851 (2024).
文章一个 Google Scholar一个
Chowdhury, M. E., Islam, A. K. M. S., Zaman, R. U. & Khadem, S. A machine learning-based approach for flash flood susceptibility mapping considering rainfall extremes in the northeast region of Bangladesh.ADV。Space Res。https://doi.org/10.1016/j.asr.2024.10.047(2024)。Ren, H. et al.
Flood susceptibility assessment with random sampling strategy in ensemble learning (RF and XGBoost).Remote Sens 16, 320 (2024).
文章一个 Google Scholar一个
Zhao, G., Pang, B., Xu, Z., Yue, J. & Tu, T. Mapping flood susceptibility in mountainous areas on a national scale in China.科学。总环境。 615, 1133–1142 (2018).
文章一个 Google Scholar一个
Tang, X. et al.A novel machine learning-based framework to extract the urban flood susceptible regions.int。J. Appl.Earth Obs.Geoinf. 132, 104050 (2024).
Wei, Q. et al.City scale urban flooding risk assessment using multi-source data and machine learning approach.J. Hydrol. 651, 132626 (2025).
文章一个 Google Scholar一个
Yao, J., Zhang, X., Luo, W., Liu, C. & Ren, L. Applications of stacking/blending ensemble learning approaches for evaluating flash flood susceptibility.int。J. Appl.Earth Obs.Geoinf. 112, 102932 (2022).
Li, Y., Osei, F. B., Hu, T. & Stein, A. Urban flood susceptibility mapping based on social media data in Chengdu City, China.维持。Cities Soc. 88, 104307 (2023).
文章一个 Google Scholar一个
Yousefi, S. et al.Assessing the susceptibility of schools to flood events in Iran.科学。代表。 10, 18114 (2020).
文章一个 Google Scholar一个
Pourghasemi, H. R. et al.Assessment of urban infrastructures exposed to flood using susceptibility map and Google Earth Engine.IEEE J. Sel.顶部。应用。Earth Obs.Remote Sens. 14, 1923–1937 (2021).
文章一个 Google Scholar一个
Nkeki, F. N., Bello, E. I. & Agbaje, I. G. Flood risk mapping and urban infrastructural susceptibility assessment using a GIS and analytic hierarchical raster fusion approach in the Ona River Basin, Nigeria.int。J.减少灾害风险。 77, 103097 (2022).
文章一个 Google Scholar一个
Ruiz, A. & Rajib, A. Developing a spatially explicit flood susceptibility index for critical infrastructure in US cities.World Environ.水资源。恭喜。2022https://doi.org/10.1061/9780784484258.115 (2022)。Meng, M., DÄ…browski, M., Tai, Y., Stead, D. & Chan, F. Collaborative spatial planning in the face of flood risk in delta cities: A policy framing perspective.
环境。科学。政策 96, 95–104 (2019).
文章一个 Google Scholar一个
Chan, F. K. S. et al.Urban flood risks and emerging challenges in a Chinese delta: The case of the Pearl River Delta.环境。科学。政策 122, 101–115 (2021).
文章一个 Google Scholar一个
Meng, M., DÄ…browski, M., Xiong, L. & Stead, D. Spatial planning in the face of flood risk: Between inertia and transition.城市 126, 103702 (2022).
文章一个 Google Scholar一个
Meng, M., DÄ…browski, M. & Stead, D. Governing resilience planning: Organizational structures, institutional rules, and fiscal incentives in Guangzhou.土地 12, 417 (2023).
文章一个 Google Scholar一个
Sharifi, A. Urban form resilience: A meso-scale analysis.城市 93, 238–252 (2019).
文章一个 Google Scholar一个
Sharifi, A. & Yamagata, Y. Resilient Urban Form: A Conceptual Framework.在Resilience-Oriented Urban Planning(eds. Yamagata, Y. & Sharifi, A.) vol.65 167–179 (Springer International Publishing, Cham, 2018).
Tayyab, M. et al.GIS-based urban flood resilience assessment using urban flood resilience model: A case study of Peshawar City, Khyber Pakhtunkhwa, Pakistan.Remote Sens 13, 1864 (2021).
文章一个 Google Scholar一个
Bowker, P., Escarameia, M. & Tagg, A.Improving the Flood Performance of New Buildings: Flood Resilient Construction。(RIBA, London, 2007).
Meng, M., Dabrowski, M. & Stead, D. Enhancing Flood Resilience and Climate Adaptation: The State of the Art and New Directions for Spatial Planning.可持续性 12, 7864 (2020).
文章一个 Google Scholar一个
Saber, M. et al.Examining LightGBM and CatBoost models for wadi flash flood susceptibility prediction.Geocarto Int. 37, 7462–7487 (2022).
文章一个 Google Scholar一个
Aydin, H. E. & Iban, M. C. Predicting and analyzing flood susceptibility using boosting-based ensemble machine learning algorithms with SHapley additive exPlanations.纳特。危险 116, 2957–2991 (2023).
文章一个 Google Scholar一个
Li, Z., He, W., Li, J. & Zhang, H. Identifying Every Building’s Function in Large-Scale Urban areas with Multi-Modality Remote-Sensing Data.in IGARSS 2024 - 2024 IEEE International Geoscience and Remote Sensing Symposium 310–314 (2024).https://doi.org/10.1109/IGARSS53475.2024.10641437。Zhang, J., Fukuda, T. & Yabuki, N. Development of a city-scale approach for façade color measurement with building functional classification using deep learning and street view images.
ISPRS Int.J. Geo-Inf. 10, 551 (2021).
文章一个 Google Scholar一个
Deng, Y. et al.Identify urban building functions with multisource data: a case study in Guangzhou, China.int。J. Geogr.inf。科学。 36, 2060–2085 (2022).
文章一个 Google Scholar一个
Lin, A. et al.Identifying Urban Building Function by Integrating Remote Sensing Imagery and POI Data.IEEE J. Sel.顶部。应用。Earth Obs.Remote Sens. 14, 8864–8875 (2021).
文章一个 Google Scholar一个
China Academy of Building Research (CABR).Seismic Design Code for Buildings (2016).
Ministry of Housing, Communities & Local Government.National Planning Policy Framework。https://www.gov.uk/government/publications/national-planning-policy-framework--2(2023)。
Xu, T., Liu, F., Wan, Z., Zhang, C. & Zhao, Y. Spatio-temporal evolution characteristics and driving mechanisms of waterlogging in urban agglomeration from multi-scale perspective: A case study of the Guangdong-Hong Kong-Macao Greater Bay Area, China.J. Environ。管理。 368, 122109 (2024).
文章一个 Google Scholar一个
Zhang, Q., Wu, Z., Zhang, H., Dalla Fontana, G. & Tarolli, P. Identifying dominant factors of waterlogging events in metropolitan coastal cities: The case study of Guangzhou, China.J. Environ。管理。 271, 110951 (2020).
文章一个 Google Scholar一个
Yu, H. et al.A high-efficiency global model of optimization design of impervious surfaces for alleviating urban waterlogging in urban renewal.反式。GIS 25, 1716–1740 (2021).
文章一个 Google Scholar一个
Qin, X., Wang, S. & Meng, M. SEA for better climate adaptation in the face of the flood risk: Multi-scenario, strategic forecasting, nature-based solutions.环境。Impact Assess.修订版 106, 107495 (2024).
文章一个 Google Scholar一个
Wang, M. et al.Optimization of integrating life cycle cost and systematic resilience for grey-green stormwater infrastructure.维持。Cities Soc. 90, 104379 (2023).
文章一个 Google Scholar一个
Lyu, H.-M., Wang, G.-F., Shen, J., Lu, L.-H.& Wang, G.-Q.Analysis and GIS mapping of flooding hazards on 10 may 2016, guangzhou, China.水 8, 447 (2016).
文章一个 Google Scholar一个
Quan, Z., Shanshan, X. & Chengdong, Z. A community resilience evaluation and optimization strategy based on stormwater management.J. Resour.ECOL。 13, 360–370 (2022).
Lu, S., Huang, J. & Wu, J. Multi-dimensional urban flooding impact assessment leveraging social media data: a case study of the 2020 Guangzhou Rainstorm.水 15, 4296 (2023).
文章一个 Google Scholar一个
Yu, H., Zhao, Y., Fu, Y. & Li, L. Spatiotemporal Variance Assessment of Urban Rainstorm Waterlogging Affected by Impervious Surface Expansion: A Case Study of Guangzhou, China.可持续性 10, 3761 (2018).
文章一个 Google Scholar一个
Xinhua.Guangdong raises emergency response for heavy rain-triggered flood to Level II--China Economic Net.http://en.ce.cn/main/latest/202309/09/t20230909_38708254.shtml(2023)。
Alexander, D. Natural disasters: a framework for research and teaching.灾难 15, 209–226 (1991).
文章一个 Google Scholar一个
Baky, M. A. A., Islam, M. & Paul, S. Flood hazard, vulnerability and risk assessment for different land use classes using a flow model.Earth Syst.环境。 4, 225–244 (2020).
文章一个 Google Scholar一个
Nasiri, H., Mohd Yusof, M. J. & Mohammad Ali, T. A. An overview to flood vulnerability assessment methods.维持。水资源。管理。 2, 331–336 (2016).
文章一个 Google Scholar一个
Skakun, S., Kussul, N., Shelestov, A. & Kussul, O. Flood hazard and flood risk assessment using a time series of satellite images: a case study in Namibia.Risk Anal. 34, 1521–1537 (2014).
文章一个 Google Scholar一个
Saravanan, S. et al.Flood susceptibility mapping using machine learning boosting algorithms techniques in Idukki district of Kerala India.Urban Clim. 49, 101503 (2023).
文章一个 Google Scholar一个
Hussain, M. et al.Development of a new integrated flood resilience model using machine learning with GIS-based multi-criteria decision analysis.Urban Clim. 50, 101589 (2023).
文章一个 Google Scholar一个
Li, W. et al.A Positive-unlabeled learning algorithm for urban flood susceptibility modeling.土地 11, 1971 (2022).
文章一个 Google Scholar一个
Lyu, H.-M.& Yin, Z.-Y.Flood susceptibility prediction using tree-based machine learning models in the GBA.维持。Cities Soc. 97, 104744 (2023).
文章一个 Google Scholar一个
Zhu, X., Guo, H. & Huang, J. J. Urban flood susceptibility mapping using remote sensing, social sensing and an ensemble machine learning model.维持。Cities Soc. 108, 105508 (2024).
文章一个 Google Scholar一个
Ullah, K., Wang, Y., Fang, Z., Wang, L. & Rahman, M. Multi-hazard susceptibility mapping based on convolutional neural networks.Geosci。正面。 13, 101425 (2022).
文章一个 Google Scholar一个
Barton, B. & Peat, J.Medical Statistics: A Guide to SPSS, Data Analysis and Critical Appraisal, 2nd Edition.(BMJ Books, Blackwell Publishing Ltd, 2014).
Chatterjee, S. & Simonoff, J. S. Analysis of Variance.在Handbook of Regression Analysis111–137 (John Wiley & Sons, Ltd, 2012).https://doi.org/10.1002/9781118532843.ch6。Shrestha, N. Detecting multicollinearity in regression analysis.
是。J. Appl.数学。统计 8, 39–42 (2020).
文章一个 Google Scholar一个
Breiman, L. Random Forests.Mach.学习。 45, 5–32 (2001).
文章一个 Google Scholar一个
Casali, Y., Aydin, N. Y. & Comes, T. Machine learning for spatial analyses in urban areas: a scoping review.维持。Cities Soc. 85, 104050 (2022).
文章一个 Google Scholar一个
Gudiyangada Nachappa, T. et al.Flood susceptibility mapping with machine learning, multi-criteria decision analysis and ensemble using Dempster-Shafer Theory.J. Hydrol. 590, 125275 (2020).
文章一个 Google Scholar一个
Lee, S., Kim, J.-C., Jung, H.-S., Lee, M. J. & Lee, S. Spatial prediction of flood susceptibility using random-forest and boosted-tree models in Seoul metropolitan city, Korea.Geomat。纳特。Hazards Risk 8, 1185–1203 (2017).
文章一个 Google Scholar一个
Roy, P. et al.Threats of climate and land use change on future flood susceptibility.J. Clean.Prod. 272, 122757 (2020).
文章一个 Google Scholar一个
Band, S. S. et al.Flash flood susceptibility modeling using new approaches of hybrid and ensemble tree-based machine learning algorithms.Remote Sens. 12, 3568 (2020).
文章一个 Google Scholar一个
Chen, W. et al.Landslide susceptibility modelling using GIS-based machine learning techniques for Chongren County, Jiangxi Province.China Sci.总环境。 626, 1121–1135 (2018).
文章一个 Google Scholar一个
Prokhorenkova, L., Gusev, G., Vorobev, A., Dorogush, A. V. & Gulin, A. CatBoost: unbiased boosting with categorical features.in Advances in Neural Information Processing Systems vol.31 (Curran Associates, Inc., 2018).
Liu, K., Yin, L., Lu, F. & Mou, N. Visualizing and exploring POI configurations of urban regions on POI-type semantic space.城市 99, 102610 (2020).
文章一个 Google Scholar一个
Luo, G., Ye, J., Wang, J. & Wei, Y. Urban functional zone classification based on POI data and machine learning.可持续性 15, 4631 (2023).
文章一个 Google Scholar一个
Abdi, H. & Williams, L. J. Principal component analysis.WIREs Comput.统计 2, 433–459 (2010).
文章一个 Google Scholar一个
He, H., Bai, Y., Garcia, E. A. & Li, S. ADASYN: Adaptive synthetic sampling approach for imbalanced learning.在2008 IEEE International Joint Conference on Neural Networks (IEEE World Congress on Computational Intelligence)1322–1328 (IEEE, Hong Kong, China, 2008).https://doi.org/10.1109/IJCNN.2008.4633969。Haddadi, S. J., Farshidvard, A., Silva, F. D. S., Dos Reis, J. C. & Da Silva Reis, M. Customer churn prediction in imbalanced datasets with resampling methods: A comparative study.
Expert Syst.应用。 246, 123086 (2024).
文章一个 Google Scholar一个
Sutherland, H., Recchia, G., Dryhurst, S. & Freeman, A. L. J. How people understand risk matrices, and how matrix design can improve their use: findings from randomized controlled studies.Risk Anal. 42, 1023–1041 (2022).
文章一个 Google Scholar一个
Proto, R., Recchia, G., Dryhurst, S. & Freeman, A. L. J. Do colored cells in risk matrices affect decision-making and risk perception?Insights from randomized controlled studies.Risk Anal. 43, 2114–2128 (2023).
文章一个 Google Scholar一个
Anees, M. T. et al.Flood Vulnerability, Risk, and Susceptibility Assessment: Flood Risk Management.在Advances in Environmental Engineering and Green Technologies(ed. Karmaoui, A.) 1–27 (IGI Global, 2020).https://doi.org/10.4018/978-1-5225-9771-1.ch001。Collier, C. G. & Fox, N. I. Assessing the flooding susceptibility of river catchments to extreme rainfall in the United Kingdom.
int。J. River Basin Manag. 1, 225–235 (2003).
文章一个 Google Scholar一个
Shi, Q. et al.The Last Puzzle of Global Building Footprints—Mapping 280 Million Buildings in East Asia Based on VHR Images.J. Remote Sens. 4, 0138 (2024).
文章一个 Google Scholar一个
Sevgen, E., Kocaman, S., Nefeslioglu, H. A. & Gokceoglu, C. A novel performance assessment approach using photogrammetric techniques for landslide susceptibility mapping with logistic regression.ANN Random For.Sens. 19, 3940 (2019).
Das, S. & Gupta, A. Multi-criteria decision based geospatial mapping of flood susceptibility and temporal hydro-geomorphic changes in the Subarnarekha basin, India.Geosci。正面。 12, 101206 (2021).
文章一个 Google Scholar一个
Costache, R. & Tien Bui, D. Spatial prediction of flood potential using new ensembles of bivariate statistics and artificial intelligence: A case study at the Putna river catchment of Romania.科学。总环境。 691, 1098–1118 (2019).
文章一个 Google Scholar一个
Ross, C. W. et al.HYSOGs250m, global gridded hydrologic soil groups for curve-number-based runoff modeling.科学。数据 5, 180091 (2018).
文章一个 Google Scholar一个
Li, X. et al.Flood Risk assessment of global watersheds based on multiple machine learning models.水 11, 1654 (2019).
文章一个 Google Scholar一个
Shafizadeh-Moghadam, H., Valavi, R., Shahabi, H., Chapi, K. & Shirzadi, A. Novel forecasting approaches using combination of machine learning and statistical models for flood susceptibility mapping.J. Environ。管理。 217, 1–11 (2018).
文章一个 Google Scholar一个
Beven, K. J. & Kirkby, M. J. A physically based, variable contributing area model of basin hydrology / Un modèle à base physique de zone d’appel variable de l’hydrologie du bassin versant.Hydrol.科学。公牛。 24, 43–69 (1979).
文章一个 Google Scholar一个
Costache, R. Flash-flood Potential Index mapping using weights of evidence, decision Trees models and their novel hybrid integration.斯托克。环境。res。Risk Assess. 33, 1375–1402 (2019).
文章一个 Google Scholar一个
Ohlmacher, G. C. Plan curvature and landslide probability in regions dominated by earth flows and earth slides.工程。Geol。 91, 117–134 (2007).
文章一个 Google Scholar一个
Brath, A., Montanari, A. & Moretti, G. Assessing the effect on flood frequency of land use change via hydrological simulation (with uncertainty).J. Hydrol. 324, 141–153 (2006).
文章一个 Google Scholar一个
Hounkpè, J., Diekkrüger, B., Afouda, A. A. & Sintondji, L. O. C. Land use change increases flood hazard: a multi-modelling approach to assess change in flood characteristics driven by socio-economic land use change scenarios.纳特。危险 98, 1021–1050 (2019).
文章一个 Google Scholar一个
Shan, X., Yin, J. & Wang, J. Risk assessment of shanghai extreme flooding under the land use change scenario.纳特。危险 110, 1039–1060 (2022).
文章一个 Google Scholar一个
Rahmati, O., Pourghasemi, H. R. & Zeinivand, H. Flood susceptibility mapping using frequency ratio and weights-of-evidence models in the Golastan Province, Iran.Geocarto Int 31, 42–70 (2016).
文章一个 Google Scholar一个
Wang, Y., Fang, Z., Hong, H., Costache, R. & Tang, X. Flood susceptibility mapping by integrating frequency ratio and index of entropy with multilayer perceptron and classification and regression tree.J. Environ。管理。 289, 112449 (2021).
文章一个 Google Scholar一个
Yang, J. et al.Divergent shifts in peak photosynthesis timing of temperate and alpine grasslands in China.遥感环境。 233, 111395 (2019).
文章一个 Google Scholar一个
Kebede, T. A., Hailu, B. T. & Suryabhagavan, K. V. Evaluation of spectral built-up indices for impervious surface extraction using Sentinel-2A MSI imageries: A case of Addis Ababa city, Ethiopia.环境。Chall. 8, 100568 (2022).
文章一个 Google Scholar一个
致谢
We sincerely thank the three anonymous reviewers for their thoughtful comments and helpful suggestions, which have contributed to improving this paper.We would also like to express our heartfelt thanks to our colleagues Bangdong Chen and Lianghao Zhang for their generous technical guidance and support throughout the research process.This research is co-funded by the National Youth Science Fund Project of the National Natural Science Foundation of China (52108050), the Guangdong Basic and Applied Basic Research Foundation (2023A1515011653), the Guangdong Basic and Applied Basic Research Foundation (2024A1515011547), the National Social Science Foundation (22VHQ009), and the China Scholarship Council (202306150061).
道德声明
竞争利益
作者没有宣称没有竞争利益。
附加信息
Publisher’s note关于已发表的地图和机构隶属关系中的管辖权主张,Springer自然仍然是中立的。
补充信息
权利和权限
开放访问This article is licensed under a Creative Commons Attribution-NonCommercial-NoDerivatives 4.0 International License, which permits any non-commercial use, sharing, distribution and reproduction in any medium or format, as long as you give appropriate credit to the original author(s) and the source, provide a link to the Creative Commons licence, and indicate if you modified the licensed material.您没有根据本许可证的许可来共享本文或部分内容的改编材料。The images or other third party material in this article are included in the article’s Creative Commons licence, unless indicated otherwise in a credit line to the material.If material is not included in the article’s Creative Commons licence and your intended use is not permitted by statutory regulation or exceeds the permitted use, you will need to obtain permission directly from the copyright holder.要查看此许可证的副本,请访问http://creativecommons.org/licenses/by-nc-nd/4.0/。重印和权限
引用本文

Qin, X., Wang, S., Meng, M.
等。Enhancing urban resilience through machine learning-supported flood risk assessment: integrating flood susceptibility with building function vulnerability.npj Urban Sustain5 , 19 (2025).https://doi.org/10.1038/s42949-025-00208-w
已收到:
公认:
出版:
doi:https://doi.org/10.1038/s42949-025-00208-w