
使用机器学习技术预测小麦和大麦作物的土地适用性
作者:Sitote, Tilahun Melak
介绍
农业约占全球国内生产总值(GDP)的33.3%,其增长增长了共同的繁荣1。农业增长通过最大程度地减少粮食短缺来减轻极端贫困。根据最近的估计,埃塞俄比亚有68.7%的人口在多维上很差2。尽管努力使该国经济多样化,但农业仍然是收入的主要来源,80%的人民的生计取决于它。农业用地是一种有限的资源,需要必要的保护,必须明智地使用。人口的增长会导致需求增加,并对土地的可用性施加压力3。土地利用和土地覆盖增加导致农业土地可用性短缺,这导致粮食短缺4。因此,需要创新的方法来满足不断增长的人口的粮食需求5。
埃塞俄比亚的农业用地面临着各种问题,例如侵蚀,滑坡,森林砍伐和地下水耗尽。该国的农场规模平均不到每个家庭一公顷6。即使牲畜相当大,并且超过了放牧土地的能力,但它仍然不足。因此,最佳使用可用土地至关重要。土地评估是最佳土地使用计划过程中的重要一步。确定针对特定作物的土地适用性可以支持土地利用计划中的决策并提高作物产量3,,,,6。但是,缺乏知识来确定最能表征土地和适合特定土地的农作物的特征是影响生产力的挑战。在埃塞俄比亚,农业专家进行土地适用性评估。他们使用地理信息系统(GIS)和AHP将土地分为特定农作物的适用性类别。根据食品和农业组织(FAO)指南,有效的土地适用性分类需要一个巨大的过程来绘制具有农作营养需求的土地属性,这会消耗大量时间,需要大量的努力,而且价格昂贵,而且很昂贵3。实际要求与土地实施的内容之间的不匹配影响农作物产量4。因此,确定特定作物的合适土地的土地适用性评估是提高作物产量的重要过程。
由于已经在农业中使用了机器学习方法来提高多个领域的生产率,例如物种识别,土壤管理,土地适应性预测,物种育种,水管理,作物管理,产量预测,作物质量管理,作物疾病检测,杂草识别和牲畜管理。该方法可用于本研究,这是土地适用性预测5。
在这项研究中,我们预测了埃塞俄比亚,小麦和大麦的两种通常种植的谷物作物的土地适用性6,使用机器学习技术。土壤,气候,地形和农作物的特征已被用来预测土地适用性。我们认为,有效的土地适用性分类可能有助于农民确定土地的适当农作物并提高农作物产量7。
相关作品
确定特定农作物的合适土地是提高作物产量的关键过程。已经对使用机器学习技术进行土地适用性识别进行了许多研究。主要相关作品已讨论如下:
Komolafe等。提出了木薯的土地适用性预测模型8。支持向量机(SVM)和决策树已用于预测土地适用性。数据是从伊巴丹农业,研究和培训研究所(IART)收集的。它是尼日利亚的主要农业研究所。该数据集包含诸如独立的化学特性,物理特性,气候和地形等特征,并具有依赖性的土地适用性。共有252个记录。该模型的准确性为87.5%,其中12.7%的实例被错误分类。该数据集对于基于机器学习的建模很小。在这项研究中,还没有映射有农作物需求的土地属性。
肯尼迪等。使用平行的随机森林分类器预测着高粱的土地适用性9。数据集由八个特征组成:排水,年降雨,生根深度,盐度危害(ECE),Sodicity危害(ESP),水分持有能力(MHC),坡度和平均年温度。他们训练了不同的机器学习模型,例如随机森林(RF),逻辑回归(LR),潜在的Dirichlet分配(LDA),K-Nearest邻居(KNN),Gaussian Nain-NaâveBayes(GNB)和SVM。评估了模型的性能。在十倍的交叉验证下,RF的表现优于其他模型,其精度为90%。在这项研究中,未考虑pH,n和p等土地适合性的最佳决定因素特征。
Fereydoon等。使用SVM预测伊朗库欣地区小麦的土地适用性10。该数据集由32个代表性的土壤概况和10个土地特征组成。特征包括降水和温度等气候因素,浮雕和坡度,以及与土壤质地,CACO3,OC,粗片段,pH和石膏参数等与土壤相关的因素。他们在非线性类边界上实现了两级SVM模型。他们使用MATLAB 8.2训练和测试模型。在性能评估指标中,它们的均方根误差(RMSE)为3.72,确定系数(R平方)为0.84。这项研究中的RMSE值大于最佳RMSE值,该值在0.2和0.5之间。尚未明确说明具有不同内核值的模型调整或高参数调谐。
Bhimanpallewar和Narasinagrao使用决策树确定了Jowar的土地适用性11。已经使用了包括气候(温度和降雨),地形(坡度),土壤(pH,EC,N,K,P和土壤水分)以及Jowar作物需求范围的特征。班级标签是适合的:高度合适,适中,略适合,目前合适且永久不适合。他们已经使用粮农组织方法将土地属性映射到农作物的要求并计算土地适用性。数据集是使用汇总报告收集的实时数据。该模型的准确性为98.9%。在这项研究中,未详细探讨实时数据的细节。绩效评估并不全面,尚未证明足够的验证表明该模型尚未过度拟合。
Ogunde和Olanbo提出了一种基于网络的决策支持系统,用于评估土壤适用性的木薯作物12。他们从审查的有关木薯种植园的土壤适用性的文章中获取了次要数据。数据集包含pH,NPK和有机物等土壤的属性,作为独立特征和土地适合性作为依赖性特征。适用性预测模型的准确性为76.5%。使用J48决策树算法进行分类。在这项研究中,仅使用五个土壤属性特征来确定土地适用性。不考虑对确定土地适用性至关重要的气候和地形数据。性能也不是很好,大约有23%的错误分类。
Schmidt等人使用机器学习技术在伊朗的库尔德斯坦进行了灌溉小麦和大麦作物的土地适用性评估41。这项研究的主要目的是进行土地适用性评估,并使用参数和机器学习算法(例如RF和SVM)将其绘制为两种雨水喂养的作物。将结果与传统方法进行了比较。他们得出的结论是,基于机器学习的方法在准确性方面优于传统的土地适用性映射。在这项研究中,没有与其他机器学习模型进行比较。
我们可能会看到相关工作中的缺点,包括大量的错误分类和容易拟合的小数据集。因此,它们对现实世界的应用不太概括。只有一两个相关作品在小麦和大麦上。由于作物和区域的背景下的变化,模型也可能不适用于。相关作品的摘要包括所使用的方法和差距已显示在表中1。因此,我们进行了这项研究,以解决这些缺陷。我们认为,通过使用适当的机器学习技术和超参数优化,可以提高性能。
材料和方法
研究区域
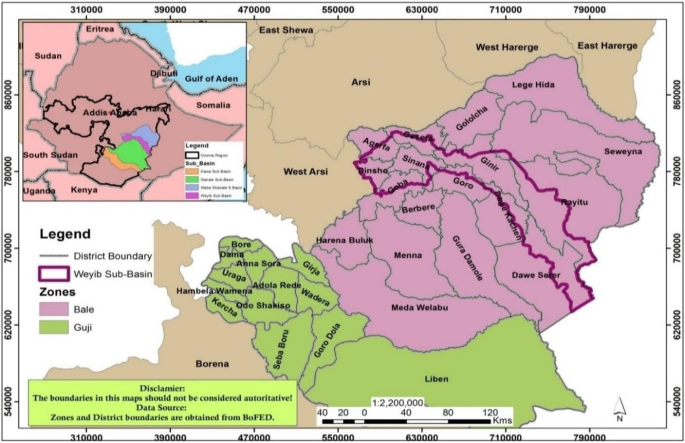
根据土壤调查公司的一份土壤调查员工报告,Ababa Quality Quartia Qualte的总土地实验室测试包括气候,以及小麦的地形数据,大麦作物约为1,086,436.84公顷Weyib Sub-Basin,根据Oromia的土壤调查员工报告,Akaki质量,Addis Ababa,Esteripia,Addis Ababa。Weyib Sub-Basin完全位于Bale Zone,Oromia地区,涵盖了Dinsho等地区,部分覆盖了Agarfa,Goba,Sinana,Gasera,Gasera,Gineer,Gineer,Goro,Dawe Kachen,Dawe Kachen,Dawe Sarar和Rayitu的地区。从西到东部的位置范围为39.59至41.68°,向北为5.73至7.43°。从研究区域的地质结构来看,韦伊布苏巴蛋白包括三个地质地层:中生代沉积岩,三级火山岩和沉积岩,以及第四纪火山和沉积岩石。中生代沉积岩包括主要的石膏单元,代表了研究区域中白垩统继承的最低部分。该研究区域具有多种景观,会导致各种微气候。这允许生产各种作物。数字1下面说明了Weyib sub-basin的地图。此外,研究区域的土壤类型,土壤质地,气候和地形在14。

Weyib Subbasin的位置图。
数据源
用于本研究的小麦和大麦农作物的土地适用性数据集是从埃塞俄比亚的Oromia(ECO)工程公司获得的。该研究所以前称为Oromia Water Works设计和监督企业,提供工程咨询,社区服务和土地使用计划15。小麦和大麦是研究区域中通常种植的主要谷物作物之一。气候和地形数据集是从埃塞俄比亚Oromia地区Weyib Subbasin,Bale区的研究区域获得的土壤实验室测试结果。
针对两种农作物的土地适用性建模的原始数据集包括有关土壤物理和化学特性的数据,包括温度和降雨在内的气候特征以及斜坡等地形特征。该数据集用小麦和大麦作物,气候和地形要求绘制了绘制,其中FAO框架设置了范围16如土壤调查报告中所用14取自Eco。然后,标记是在粮农组织框架中确定的土地适用性课程进行的16例如S1(高度合适),S2(中适中),S3(略适合),N1(当前合适)和N2(永久不合适),这是本研究的类标签。该数据集由农业专家审查。表2和3根据粮农组织指南,展示了将土地属性与小麦和大麦作物的适用性绘制的标准14,,,,16,,,,17,,,,18。表2小麦的适用性标准范围。表3大麦的适用性标准范围。预处理从ECO获得的数据集包括丢失的值,噪声,不正确的值,不一致和无关的实例。
由于KNN以数据点之间标量产品的形式利用距离或相似性,因此对特征缩放很敏感。
因此,为KNN完成了功能的缩放。另一方面,RF和GB对特征缩放不敏感19。标准化基于等式。1。
$$ x \ prime = \ frac {{x -x _ {\ min}}}} {{x _ {\ max} - x _ {\ min}} $
(1)
X X是新变化的功能,x最大限度和x最小分别是最大和最小特征值。
此外,这项研究被使用了几种开发工具和包装来实施提出的解决方案,以解决提出的问题,并填补在土地适用性预测中确定的空白以增强小麦,并按照预期的是使用机器学习方法来精确地使用大麦作物生产。因此,使用Python编程语言用于实施和实验每个提出的解决方案,从预处理阶段到模型构建。它还用于评估实现的分类器以识别最佳模型。因此,Python是需要开发机器学习模型的开发人员,研究人员和数据科学家的首选编程语言。
功能选择
特征选择方法,例如从过滤器方法中的单变量,递归功能消除以及包装器方法的顺序前向选择更易于使用20。因此,在本研究中使用它们从原始数据集中选择相关功能。单变量特征选择是一种特征选择方法,该方法可以单独检查每个功能,以识别其与目标特征的关系。递归功能消除(RFE)是一种非常常见的特征选择算法,因为它易于配置和使用,并且非常有效地选择训练数据集中的功能,这些功能与预测目标变量最相关20。它可以与交叉验证一起使用。在应用这些特征选择技术之前,使用标签编码对土壤纹理和作物名称等分类数据进行了编码。
单变量特征选择(UFS)
单变量特征选择方法,也称为方差分析(ANOVA),根据应用Scikit-Learn特征选择软件包的单变量统计测试选择了最佳特征,该测试选择了K最佳例程,从而消除了所有其他功能,但可以保留最高的K分数功能。此方法独立排名每个功能,忽略了跨特征的任何相互依赖性21。
交叉验证(RFECV)消除递归特征
它是预测变量的向后特征选择方法。它在整个功能集中构建了一个模型,计算每个功能的重要性得分。在删除了最小重要分数的预测变量后,将重新训练,并再次计算重要性得分。然后确定估计每个子集大小所需的特征子集数量。子集大小作为RFE的参数调整。根据功能的重要分数排名和提高标准的功能子集的大小选择最佳功能(S)。最后一个机器学习预测模型是使用最有效的亚组训练的。交叉验证的RFE用于从初始功能集中提取最佳特征集(表4)。
顺序远期选择(SFS)
此功能选择方法始于一个空集,并依次添加评估功能选择的功能。从尚未添加到集合中的功能集中的其余可用功能中选择要添加到每个迭代的功能集中的功能。因此,与添加任何其他功能相比,新的扩展功能集应导致最小分类错误。重复此过程,直到选择了预定数量的功能23。SFS广泛用于其易用性和速度。由于这个原因,它已在这项研究中使用。它已应用于选定的机器学习模型。在每次迭代中计算其精度。然后根据模型的性能选择最佳功能子集。
机器学习模型建设
这项研究旨在使用机器学习技术预测土地适用性,以使用已经准备好的土地适用性数据集来提高小麦和大麦作物生产力。因此,由于它们在先前的研究中的成功应用,因此选择了三种受监督的机器学习算法,例如随机森林,梯度提升和K-Nearest邻居算法,以及它们相对良好的准确性,稳健性和易用性3,,,,10,,,,13,以及它们适合班级分布不平衡的能力。
随机森林(RF)
RF是Breiman在2001年提出的决策树预测因素的组合31。它被广泛用于回归和分类问题。整体学习由取决于随机向量值的决策树组成。随机矢量对森林中所有树木的分布进行独立采样。这是一种监督的机器学习算法,生成多个随机取样的树木3。在本研究中,我们选择RF作为机器学习技术之一的原因有不同的原因。过度拟合的风险很低,因为随着决策树的合奏的平均,模型差异会降低32。它有效地捕获数据中的非线性模式。它为单个决策树提供了提高的准确性。它也很快且耐噪音。由于这些原因,它已在各个应用领域使用,包括与深度学习技术进行比较33。RF伪代码如图2和图2所示。2和3。

随机森林伪代码34。

随机森林预测伪代码34。
k-near最邻居(KNN)
在KNN中,指定的数字(k)数据集中的数据记录,该数据记录以其输入变量值与数据集中的每个数据记录最接近要预测的数据记录。35。然后,确定的k数据记录用于计算测试数据集的类变量值。彼此靠近的值被认为是相似的。新的数据点是根据基于距离的相似性度量进行分类的。欧几里得和曼哈顿是最常用的距离指标,该指标计算k最近的数据点24。KNN已成功用于许多分类任务35,,,,36,,,,37,,,,38,,,,39。KNN伪代码如图2所示。4。

k-nearest邻居伪代码34。
梯度提升(GB)
整合学习的方法是,组弱预测模型(通常是决策树)和所得算法,这些算法被称为梯度增强的树25。增强算法将弱学习者算法结合在一起,成为一个强大的学习者。最近对梯度增强算法的家族进行了广泛的探索。它在分类任务方面取得了成功。测试了不同的属性以提高梯度。这些属性包括学习率,树的最大深度,子采样率,查找最佳拆分时要考虑的特征数量以及分开内部节点所需的最小样本数量。迭代过程需要适当地正规化以避免过度拟合。
所提出的结构如图所示。5。数据集最初是原始数据。因此,进行预处理,包括清洁,处理缺失值和处理分类值,以使其适合机器学习算法。然后,实现功能选择以识别相关功能。单变量特征选择,递归特征消除与交叉验证以及顺序的正向特征选择已用于特征选择。RF,GB和KNN用于建立预测模型。选择这些模型以自动化多类土地适用性。使用分层K-折叠验证与Kâ= 10的分层k-折叠进行评估,并没有特征选择方法进行评估。分层的k折交叉验证是k折交叉验证的修改版本,它进行分层采样而不是随机采样,以确保具有给定标签的数据集的每个倍数都具有相同的实例26。

拟议模型的架构。
高参数调整
网格搜索和随机搜索是两种最常用的用于高参数优化的算法。网格搜索是一种传统的方法,可以在训练算法的超参数空间的给定子集上进行完整的搜索,并详尽地从指定的参数值网格中生成候选者。该方法的缺点之一是它遭受了高维空间的苦难。但是,它通常很容易平行,因为它使用的超参数值通常是彼此独立的27。随机搜索通过随机选择对所有组合的完整选择。它的表现优于网格搜索,尤其是如果只有少数超级参数会影响机器学习算法的性能27。结果,我们已经随机搜索了这项研究。
模型性能评估
在预测埃塞俄比亚两种常见的谷物作物的土地适用性时,已经使用了不同的绩效评估方法来衡量三种机器学习技术的性能,并且有和没有特征选择。目的是确保模型适合数据集并在看不见的数据上表现良好。绩效评估提供了对机器学习技术的全面,客观评估,并检查了模型的可推广性。将数据集分为培训和测试至关重要。该模型的性能有时会受到培训和测试数据集的随机选择的影响40。交叉验证是解决此问题的解决方案。尽管如此,K折的跨验证的每个折叠可能与每个标签的观测值相同。因此,已使用Kâ= 10分层的K折交叉验证已将数据集分为训练和测试。对折叠进行分层以使每个折叠中值的类分布与初始数据大致相同。精度,精度,召回,F1得分,灵敏度和特异性已用于测量模型的性能。下面已经讨论了绩效评估的指标。准确性
广泛用于评估机器学习分类器的性能。它是测试数据集中正确分类值的百分比,如等式所示。2。
$$准确= \ frac {{{{\ text {tp}}} + {\ text {tn}}}}}}}}} {{{{\ text {tp}}} + {\ text {\ text {tn}}}}} + {\ text {\ text {fp}}}}}}
(2)
在哪里TP是真正的积极,TN是真正的负面,fp是假阳性,并且fn是假否定的。
精确如公式中所示3。
$$ precision = \ frac {tp} {{tp + fp}} $$
(3)
记起是一个积极的认可率。如等式中所示,它是正确分类阳性的一部分。4。
$$回忆= \ frac {tp} {{tp + fn}} $$
(4)
F1得分以精确和回忆的方式显示了模型的性能。这是精确和回忆的谐波平均值,如方程式所示5。
$$ f1-得分= 2*\ frac {precision*回忆} {{precision*回忆}} $$
(5)
结果与讨论
数据集功能描述
用于本研究的数据集是从位于埃塞俄比亚亚的斯亚贝巴Akaki Kality的Oromia(ECO)的工程公司(ECO)收集的。ECO是一家坚定的公司,它提供了可持续工程解决方案的知识基础,该解决方案可以促进我们国家的发展以及整个国际社区的发展。Eco提供了研究,并在农业,灌溉,水资源研究和供应,土地使用研究和计划以及水质测试,土壤肥力测试,岩土技术测试和材料测试等实验室服务方面进行培训,这是Eco的核心社区服务15。因此,土壤实验室测试结果是为Oromia农村土地管理所做的,并在2016年使用Weyib Sub-Basin上使用局,并从ECO中获得了土壤调查报告,该报告用作本研究的数据集。该报告可帮助研究人员详细了解每个参数和数据集标签。因此,Weyib sub-basin用作这项研究的研究领域。通过靶向来识别小麦的适用性水平来收集数据,研究区域中的大麦作物是五级分类。因此,收集了土壤数据,地形和气候数据,并包含2024行,其中包含16列(包括一个目标类别)。
数据集的色谱柱是土壤质地,土壤疾病,平均温度,平均最大温度,年降雨,土壤深度,坡度,坡度,pH,ec,k,CEC,CEC,T_N,O_M,O_M,AV_P,作物名称和适合性类别(表)5)。
数据集类别分布
为了将数据集标记为其适合性类别,例如S1,S2,S3,N1和N2,与研究领域的农业专家和土壤调查报告进行了直接沟通。该标签的数据集再次由农业专业人员进行了审查,最后,它包含2024行,其中包含16列,包括目标类别,如表所示5多于。在收集到的数据集降雨的特征中6)。
总小麦和大麦作物土壤特征,气候参数,例如年降雨,最高和最低温度,包括地形数据,这些数据是从1,086,436.84公顷的研究区收集的,韦伊布子basin。在收集的总实例中,有1016个是大麦的实例,而1008个是小麦的实例。如图图所示。6,1008个小麦实例的班级分布分为139个高度或S1,总研究区域为6.23%,161个中等或S2分布,或S2分别为13.15%,占研究区域的13.15%,为少量合适或S3,总研究区域的5.41%,目前为236,为236,或N1的总数为N1,总计16.63%,总计为239个持久性或n29.58.58.58.58.58.58.58.58。同样,大麦1016个实例的班级分布为高度或S1,占研究区域总数的10.5%,中度或S2的班级分布,或S2,其中14.05%的总研究区域为14.05%,有条不紊地合适或S3,总研究区域的11.37%,目前为240,或N1的总研究区域为240,总研究区域为11.35%,总数不适合246和N2的总数。

小麦和大麦的班级分布。
特征选择结果
为本研究应用了特征选择方法,以选择适当的特征集。UFS,RFECV和SFS技术已用于选择相关的功能集。原始功能集包含16个功能。在表中7,已经显示了每个选定模型的16个功能中每个特征选择技术的选定功能。在表中,已显示通过不同特征选择方法与原始特征不同模型选择的功能。RFECV只能应用于公开coeff_或feature_importance_attribute的模型,因此在这种情况下无法使用机器学习算法(例如KNN)30。因此,RFECV不能与KNN一起使用。

从我们的数据集中的离群检测和删除。
模型性能和评估结果
The performance of the selected models is stated and evaluated with each feature selection method and compared with the performance of the models on the original features.The performance of the selected models has been evaluated with and without feature selection.This has been useful to identify the most performing model with the corresponding feature selection method.
Performance of models with original features
The first experiment of modeling for land suitability prediction of wheat and barley has been carried out with the selected three machine learning models, such as RF, GB, and KNN, with original features.None of the feature selection techniques have been applied for this experiment.Stratified tenfold cross-validation has been used for the experiments for each of the three models.The dataset has been divided into ten folds, where one-fold was used as the test set and the remaining folds were used iteratively as the training set.The classification models were built on the dataset with five class classifications.The trained models were evaluated using stratified tenfold cross-validation, and the result of each evaluation in terms of all performance metrics has been discussed.
The stratified tenfold cross-validation accuracy of each fold for RF, GB, and KNN models has been shown in Table8。GB has the highest accuracy.The other performance metrics of the three algorithms are shown in Table9。GB outperformed the other models.
Performance of models with feature selection
The next experiment was modelling with feature selection.Three feature selection techniques, such as UFS, RFECV, and SFS, have been used to select the best feature subset.The performances of the models have been computed under stratified tenfold cross-validation with each feature selection method.The performance is then compared with the previous experiment using the original feature set.The first feature selection experiment was implemented using UFS with tenfold cross-validation.The resulting performance evaluation metrics have been shown in Table10。
The other performance metrics, such as precision, recall, and F1-score, of the three models with univariate feature selection have been shown in Table11。
As it can be seen from the previous results in Tables8,,,,9,,,,10和11, the performances of RF, GB, and KNN models with original feature sets are better than those of UFS.Therefore, the UFS feature selection method with RF, GB, and KNN models has inferior performance compared to the performance of RF, GB, and KNN models with original feature sets.
RFECV is the second feature selection technique used in this study.RFECV cannot be applied to models that do not show feature importance.Hence, machine learning algorithms such as KNN and SVM, other than linear kernels, cannot be used with this feature selection technique28。Therefore, RFECV has been used only with RF and GB models to select the relevant set of features in this study.Performance evaluation results of RF and GB models with the RFECV under stratified tenfold cross-validation have been shown in Table12。Selected features with cross-validation of RF and GB have been shown in Fig.8。

Selected features with cross-validation of RF and GB.
The performance metrics such as precision, recall, and F1-score of RF and GB with RFECV have been shown in Table13。
As it can be seen in Table13, RF and GB with RFECV perform better as compared to RF and GB with the original feature set in all performance metrics.Even though RF with RFECV performs better, it is still less than GB with the original feature set in all performance metrics under stratified tenfold cross-validation.
SFS is the third feature selection technique used under stratified tenfold cross-validation in this study.The performance metrics of the three models with the SFS feature selection have been discussed.The classification performance evaluation results of the three models with the SFS are shown in Table14。
The performance metrics such as precision, recall, and F1-score of RF and GB with SFS have been shown in Table15。
Generally, the performance of RF, GB, and KNN with SFS has superior performance compared to other feature selection methods such as UFS and RFECV and with original feature sets.The performance of GB with SFS has the highest performance.
In order to explore the best-performing model’s performance with the best feature selection method, we have discussed the confusion matrix.The performance of GB with SFS has been shown in the confusion matrix in Fig.9。GB correctly classified 474 instances out of 476, 484 instances out of 485, 268 instances out of 271, 358 instances out of 362, and 428 instances out of 430 as N1, N2, S1, S2, and S3, respectively.It wrongly classified 1, 1 instance of N1 as N2 and S3, respectively, 1 instance of N2 as N1, 3 instances of S1 as S2, 1, 2, 1 instance of S2 as N1, S1, and S3, respectively, and 2 instances of S3 as S2.The normalized confusion matrix for GB has been shown on the right side of Fig.9。It is the same as the left, except it indicates correctly classified instances in percentage.

Confusion matrix of GB with SFS without and with normalization.
The performance summary results of the three models with and without feature selection are shown in Table16。In the table, the number of selected features by each feature selection method and the performance of the models with each feature selection method are shown.
Result of KNN based on feature scaling
KNN is a distance-based learning algorithm that is based on the calculated distance between two data samples.Which means it can be affected by feature scaling.Therefore, min–max feature scaling has been applied to the dataset to build the KNN model.The result has been compared with the KNN model built on the dataset without feature normalization, as shown in Table17。The result of the comparison showed that KNN with min–max feature scaling has inferior performance to KNN built on a dataset without applying feature scaling.Therefore, normalizing the features of the dataset to ranges between zero and one has no improvement on the accuracy of the KNN model.
Hyperparameter tuning
Cross-validated randomized search hyperparameter tuning has been used in this study.Both grid search and randomized search cross-validation have been experimented with in this study.Randomized search cross-validation has better performance than grid search.The list of selected parameters used in RF and the values of parameters recommended by randomized search cross-validation are shown in Table18。For the rest of the parameters, default values have been used.
The list of selected parameters used in GB and the values of parameters recommended by randomized search cross-validation are shown in Table19。For parameters not listed in Table19, default values have been used.
The list of selected parameters used in KNN and the values of parameters recommended by randomized search cross-validation are shown in Table20。For the rest of the parameters, default values have been used.
讨论
Around 80–85% of Ethiopia’s population rely on agriculture as their primary source of livelihood2。It is the source of livelihood for many people, particularly those who live in rural areas.As a result, the agricultural sector is the priority focus area of policies and initiatives by stakeholders.There are many agricultural research centers in the country with the aim of improving food security and farmers’ living standards.They carry out research in various areas to achieve these objectives.One of the areas of their research is land suitability evaluation to identify which land unit is best suited to which crop.For instance, an assessment of land suitability for wheat and barley was carried out using a GIS-based multi-criteria approach17。They have used topographic, soil, and climatic data and mapped it with wheat and barley crop requirements to identify land suitability classes in the study area as set by FAO guidelines.There are also similar works that have aimed to evaluate land suitability for various crops based on the FAO framework4,,,,29, 和30。These research works performed land evaluation by taking a given land unit in a given area along with data associated with that area and dividing the area into its suitability classes using GIS and AHP software based on FAO criteria.However, the existing land suitability estimation methods have shortcomings.They have limitations in predicting the level of land suitability for various crops automatically and accurately.Mapping crop nutrient requirements to their suitability classes takes a long time.We believe that these shortcomings can be overcome with the current study.Hence, we aim to predict the land suitability of wheat and barley using machine learning techniques in this study.We believe this will enhance crop productivity by improving land suitability prediction accuracy and saving time.The study was carried out using machine learning techniques such as RF, GB, and KNN with and without feature selection under stratified cross-validation.The dataset consisting of soil, topographic, and climate data with soil survey reports from the ECO has been used.According to the FAO framework16, to perform land suitability evaluation, soil data such as soil physical and chemical parameters, climate data such as temperature regime and rainfall parameters, and topographic data such as slope in percentage are mandatory features and should be included in the dataset.Therefore, data were collected by considering those features individually.GB with SFS has the best performance.Hence, GB with SFS is recommended for land suitability prediction due to its high accuracy, precision, recall, and F1-score of 99.41%, 99.37%, 99.34%, and 99.35%, respectively, under stratified tenfold cross-validation31。The relevant features selected by SFS are 10 such as soil texture, mean minimum temperature, mean maximum temperature, annual rainfall, soil depth, maximum slope in percentage, soil electronic conductivity, soil potassium, available phosphorus, and crop name.
Many studies were carried out using the machine learning approach in the agricultural domain to improve productivity and quality of the crop, combat poverty, enhance food security, and improve countries’ economies in general and farmers’ lifestyles in particular.A way to evaluate land suitability for crop productivity using soil, climate, and topographic data has been carried out based on guidelines set by FAO to identify whether the particular land unit is highly, moderately, marginally suitable, currently, or permanently not suitable for a specific crop to enhance its productivity.In this study, machine learning techniques for predicting land suitability to enhance wheat and barley productivity have been proposed.It was aimed at increasing agricultural wheat and barley crop yields.The results of the study have been compared with previous studies on land suitability classification.
Komolafe et al.predicted suitable land using SVM and the DT model for the cassava crop.They have used a dataset of 252 total instances and got an accuracy of 87.5% using a tenfold cross-validation12。The dataset was small.Cassava crop nutrients required range mapping with soil, climatic, and topographic data to label the dataset, which was not stated.The performance can also be said to be inferior when it is compared with this study.
A parallel RF classifier for predicting land suitability for sorghum crop production was studied13。In this paper, RF, LR, LDA, KNN, GNB, and SVM models have been used.The maximum accuracy is 96% with the RF classifier and is evaluated using tenfold cross-validation.It has four target classes: highly, moderately, marginally, and unsuitable.No feature selection technique has been applied, and the performance can also be said to be inferior when compared with this study.
Sarmadian et al.proposed SVM-based land suitability analysis for rainfed agriculture to predict land suitability for wheat production based on the FAO land evaluation framework10,,,,14。It is a binary class classification to identify whether the study area was moderately or marginally suitable for wheat production, and feature selection techniques were not applied, which may improve the model performance.They used a train-test split and got an RMSE of 3.72 and an R square of 0.84.
Bhimanpallewar et al.have proposed to assess crop-specific suitability for small or marginal-scale crop lands for Jowar crop productivity using a machine learning approach11,,,,15。They have used 74,737 total datasets, which were collected in real-time, and the DT model with a holdout method was applied to evaluate the model, which has an accuracy of 98.9%.Our proposed study outperforms this study by applying different feature selection methods and hyperparameter tuning algorithms.Accordingly, GB with SFS feature selection has 99.41% accuracy under stratified tenfold cross-validation.
Ogunde et al.proposed soil suitability evaluation for cassava crop cultivation using web-based decision support using the DT model12,,,,16。It has four land suitability classes as a target class.The accuracy is 76.5%.According to FAO guidelines, to assess land suitability, climatic, topographic, and soil data must be considered16。Climate and topographic datasets were not included in this work.The comparison of this study with previous studies is shown in Table21。
We believe that this study can have an important contribution.It automates the conventional methods of land suitability evaluations.It can help farmers identify the suitability level of their land if they get soil, climate, and topographic data on their land unit from experts.The performance is superior to the previous studies.Additional features have been included and cover more areas with more data compared to previous studies.
结论
Meeting the demands of food for growing population is a long-lasting challenge, particularly in developing countries like Ethiopia.The government and stakeholders have implemented policies and strategies to address this problem.Land suitability identification is part of agricultural activities aimed at increasing crop yield.Current methods are time-consuming, expensive, and less accurate.Hence, this study was carried out to predict land suitability for the two widely grown cereal crops in Ethiopia—wheat and barley—using machine learning techniques.RF, GB, and KNN were used with three feature selection methods, such as UFS, RFECV, and SFS.These machine learning approach have been selected because they are appropriate to the study.The reasons to select them include their success in previous classification tasks, low risk of overfitting, and effectiveness in capturing non-linear patterns in data.The selection of the models has been justified by their performances.A dataset of soil (soil physical and chemical properties), climate (temperature and rainfall), and topography (slope) was used that has been obtained from ECO.Different experiments have been carried out with the original feature set and with the three feature selection methods.From the modelling experiment with the original feature set, GB has the best performance and KNN has the worst performance.Performances of RF, GB, and KNN models with UFS are inferior performances with the original feature set in all performance metrics.The performance of RF with RFECV is better than that of RF with the original feature set, but it is inferior to that of GB with the original feature set.GB with RFECV has the same performance as GB in the original feature set.The performance of RF, GB, and KNN has been improved with SFS in all performance metrics.GB with the SFS and 10 relevant feature sets exhibits highest performance with performance metrics such as accuracy of 99.41%, precision of 99.37%, recall of 99.34%, and F1-score of 99.35% under stratified tenfold cross-validation.Comparisons of the results have been made with related works in previous research.The proposed model of GB with SFS has superior performance.Therefore, GB with SFS has been the best-performing model in all performance metrics for predicting wheat and barley.We believe that a very accurate decision support system for the land suitability identification of the two crops can be developed based on the results of this study.This can be helpful to agricultural experts, land evaluators, and farmers to accurately and timely classifying suitable lands for the two crops.In the future, the work can be extended to the other relevant crop’s land suitability prediction.
未来的工作
Even though this study shows a significant improvement over the existing study on land suitability prediction to enhance wheat and barley crop productivity using machine learning approach and using collected and prepared dataset that helps agricultural experts, land evaluators, and hence farmers who perform agricultural land suitability assessments, it is better to extend this study into Internet of Things based system to get real-time soil, climate, and topographic data, where sensors are installed in the farming to detect soil nutrients, temperature, and rainfall data directly, that is used as input to the model for prediction.So that farmers can get an informed decision regarding how much their land unit is suitable for their respective crop via a message sent into their mobile phone.