
Performance of machine learning models for predicting high-severity symptoms in multiple sclerosis
作者:Heller, Katherine
Introduction
Multiple sclerosis (MS) is an immune-mediated disease characterized by the accrual of demyelinated lesions within the central nervous system (CNS). The symptoms imposed by such lesions can vary greatly on account of differences in lesion location, the extent of damage, and the nervous system’s fluctuating adaptations to neuronal injury. Such diverse disease phenotypes call for individualized approaches to care. Currently, care in MS is limited to infrequent snapshots of disease course captured in semi-annual visits and annual MRIs.
Digital health technology could fill the gap in the data needed to manage MS symptomatology better, and to catch subtle changes in function. Device ubiquity makes smartphones an ideal instrument for measuring chronic disease, especially with the advent of phone-based research platforms that can prompt surveys, perform assessments through phone sensors, and link to other devices. Ease of use and scale lend themselves naturally to capturing a diverse set of experiences by collecting a wide array of data, unlocking the potential for machine learning (ML) to be used. ML approaches have enabled insights using healthcare data at individual and population levels in a suite of domains such as neurology1, radiology2,3,4, pathology5,6, ophthalmology7,8, nephrology9, and genomics10,11. Within multiple sclerosis research, ML has predicted disease progression, facilitated MS sub-typing, detected MRI lesions, and refined several clinical endpoints12,13,14,15,16. A majority of these approaches primarily rely on using clinically-acquired information such as magnetic resonance imaging (MRI)16, clinical laboratory tests or clinical history14. Under this paradigm, disease progression data of an individual is obtained only infrequently during clinic visits and hence the subtle changes that may occur between visits are missed. Mobile technology enables continual collection of data and can pave the path for predicting complex aspects of MS such as symptoms and disease courses. We might learn what symptoms MS subjects are likely to develop, why they are experiencing the ones they have, and what treatments are more suited for their current disease burden. A few recent studies have demonstrated that mobile-based multiple sclerosis apps can reliably measure functional impairments of MS17,18.
To this end, we conducted the MS Mosaic observational study that leverages mobile devices to collect continual, subject-centered data so that ML methods can generate actionable clinical predictions on this data collected on a large-scale. We investigated whether ML techniques can be used to continually predict the occurrence of high-severity symptoms within a forward-looking window of three months. The symptoms we chose to focus on are fatigue, sensory disturbance, walking instability, depression or anxiety, and cramps (clinically referred to as spasms), such that they are clinically actionable and a wide array of potentially affected functions are represented. If these predictions prove reliable, this line of research can inform future study/app developments that provide app users and care providers with insights that can profoundly impact self-efficacy and self-care. We also evaluated model performance on different subgroups of the data sliced according to multiple sclerosis subtypes and age to investigate whether the models can capture a part of the individual experience. Moreover, we performed feature ablation studies to understand the performance contributions of different modalities of data collected via the MS Mosaic app, so that in the future we reduce the data entry burden for patients suffering from chronic health conditions.
Results
Overview of approach
We developed the MS Mosaic mobile application during a two-year collaboration between a professional software development team, MS care providers, data scientists, and MS participants. User experience research studies were performed involving MS subjects which informed the design of the app. We publicly launched the app in the United States on the Apple App Store and ran a prospective, case-control, site-less study across three years from September 29, 2017, until December 19, 2020. After the completion of the study, the recorded data was retrieved and de-identified. Subsequently, for each subject, we partitioned the entire time period into sliding subject-time instances (across the time dimension) that contain the subject’s data at a specific period of time. In our study, the instance length was chosen to be seven days to accommodate the weekly surveys. For each instance (i.e. triggered at weekly intervals), we predicted whether the median self-reported severity of one of the five symptoms would be above a score of two (moderate disability) in the next three months. More specifically, when constructing the labels, we check whether the symptom with the given threshold has occurred at any point within the prediction window and we set it to 1 (or True) if so. This means that at every time point we are predicting whether or not the symptom will appear at all, with a given severity, over the next 3 months. The symptoms were chosen in a way that successfully predicting them is clinically actionable. For model development, we only used subjects (N = 713) who used the app for more than three months. The dataset was divided randomly by participants into 80% (N = 567) development and 20% blind test (N = 146) cohorts for model development and testing, respectively. We used the development cohort to train and validate the models using the 5-fold cross validation approach. Three classical machine learning (logistic regression, multi-layer perceptron, and gradient boosted classifier) and two deep learning methods (recurrent neural network and temporal convolutional network) were separately trained to find the best performing model.
Characteristics of study population
A total of 1804 participants downloaded the MS Mosaic app and enrolled in the study. Since the prediction horizon was set to three months, only participants who used the App for more than three months were considered for this analysis. This led to a cohort of 713 participants comprising 39.52% of users who downloaded the app. The amount of time each participant dedicated to the study varied, with the mean, median and standard deviation reported in Table 1. On average, participants used the app for at least a year, with the lower quartile at 146 days for the development set and 162 days for the test set, and the upper quartile at 598 days for the development set and 665 days for the test set. We want to also note, we saw a sharp drop in participants in March 2020 at the onset of the pandemic, which would skew these averages. The study was stopped in December 2020, meaning there were around 6 months of low utilization.
As a part of the initial survey, 623 participants (87.37%) of the cohort chose to report their age (mean [SD], 46.27 [11.46]). The development cohort and blind test cohort were chosen randomly and consisted of 567 (mean [SD] age, 46.42 [11.51]) and 146 (mean [SD] age, 45.71 [11.29]) participants respectively. Table 1 includes characteristics for the development and blind test cohorts. The mean [SD] number of days the participants used the app were 378 [267] and 388 [262] for the development and blind test set respectively. The mean [SD] diagnosis age of MS was 30.64 [10.99].
Across the 623 participants considered in this study, the most frequently reported comorbidities were: vitamin D deficiency (318 [51.04%]), hypertension (117 [18.78%]), thyroid disease (82 [13.16%]), cancer (34 [5.46%]), diabetes (34 [5.46%]), and seizure or epilepsy (32 [5.14%]). We report further details on all comorbidities reported by the participants in the Supplemental material. In addition, 146 [23.4%] participants reported a family history of MS.
A total of 482 (77.37%) participants had relapsing-remitting, 37 (5.94%) had primary progressive, 33 (5.30%) had secondary progressive, 11 (1.77%) had progressive relapsing MS (a term the medical community has since moved away from, but for the purposes of staying true to the data that was collected we report it here separately), and 21 (3.37%) were control participants.
Out of the 19 symptoms included in the daily symptom surveys, Fatigue was reported most frequently (33,754 [90.88%]), followed by weakness (31,126 [76.43%]) and bladder problems (30,874 [68.44%]). Cognitive changes or brain fog (30,433 [78.96%]), depression or anxiety (24,976 [77.14%]) and walking instability of coordination problems (24,667 [75.88%]) closely followed. The weekly relapse survey data showed that 1631 relapses were reported by 311 unique participants.
When looking at wearable data, a total of 713 participants from the leftover cohort recorded step and sleep counts. Percentage-wise that represents 31% of the development set, and 7% of the test set.
A more in-depth look at the frequency and dropout in per-feature imputation is presented in the supplementary material.
Model discrimination
Table 2 displays the performance of all models on predicting whether the median severity of self-reported symptoms within a forward-looking prediction window of 3 months is above two (moderate to high severity). The key performance measures assessing the performance obtained by each model on predicting the occurrence of high-severity symptoms are provided in Table 2. Gradient boosting Classifier outperformed other ML and DL models for all 5 symptoms. On the blind test cohort, GBC achieved an AUROC of 0.886 (95% CI 0.870–0.901) for cramps, 0.881 (95% CI 0.868–0.895) for depression or anxiety, 0.824 (95% CI 0.813–0.836) for Fatigue, 0.899 (95% CI 0.883–0.915) for sensory disturbance, and 0.899 (95% CI 0.891–0.909) for walking instability or coordination problems. The fact that GBC outperformed deep learning algorithms is not surprising and has been observed in relatively smaller and tabular datasets19.
Based on AUROC, the best performing deep learning model and the second best performing model overall was TCN. GBC demonstrated an increase in 0.155, 0.136, 0.042, 0.143 and 0.125 of AUROC compared to TCN on predicting the incidence of high-severity cramps, depression or anxiety, fatigue, sensory disturbance, and walking instability or coordination problems respectively.
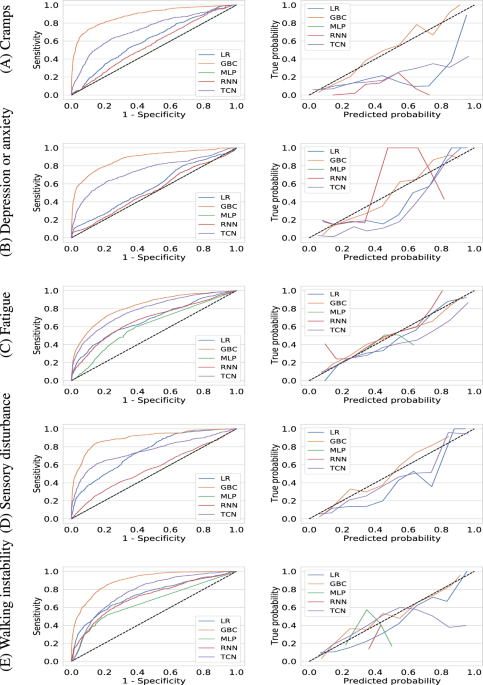
With a 0.5 probability as the cutoff, GBC achieved a PPV and sensitivity of 0.771 [95% CI 0.736–0.815] and 0.459 [95% CI 0.427–0.498] for cramps, 0.800 [95% CI 0.772–0.827] and 0.538 (0.508, 0.573) for depression or anxiety, 0.731 [95% CI 0.704–0.752] and 0.593 [95% CI 0.573–0.616) for fatigue, 0.772 [95% CI 0.732–0.812] and 0.443 [95% CI 0.402–0.483] for sensory disturbance, 0.763 [95% CI 0.735–0.794] and 0.527 [95% CI 0.504–0.562] for walking instability or coordination problems respectively. We show the receiver operating characteristic curves for all models in Fig. 1 which further demonstrates the superiority of GBC.

Receiver operating characteristic curves (left column) and calibration curves (right column) for machine learning models (gradient boosting classifier, logistic regression, multi-layer perceptron, recurrent neural network, and temporal convolutional network) for predicting whether the median value of a user-reported symptom will be of high-severity (\(>2\)) in the next three months. The symptoms considered are (A) cramps, (B) depression or anxiety, (C) fatigue, (D) sensory disturbance, and (E) walking instability or coordination problems respectively.
Model calibration
In addition to having good discriminative performance, machine learning models need to be well-calibrated. We use the Brier score to evaluate model calibration which are shown in Table 2 and the calibration curves are shown in the supplementary material. The trained Gradient Boosting Classifier models reports the lowest Brier score for all 5 symptoms thereby demonstrating their predictions have the lowest uncertainty. We verify this by visually inspecting the calibraton curves shown in Fig. 1 which demonstrate that the trained GBC models are well-calibrated for all symptoms.
Subgroup analyses
To evaluate the model performance in different multiple sclerosis subtypes, we selected participants from the blind test cohort who have self-reported to have one of the four common MS subtypes: relapsing remitting (103 participants), primary progressive (3 participants), secondary progressive (6 participants), and progressive relapsing (2 participants). The subgroups in this case were fairly small because there were not many participants in the full dataset who met the criteria for those subgroups. We would also like to acknowledge that the field has moved away from the term “progressive relapsing”, however at the time of the study design this was still in use and therefore we have left it in to report the data as collected. In future iterations these participants would be collapsed into a “progressive MS” group. The AUROC obtained by the GBC model for these subtypes are shown in Fig. 2. Overall the performance obtained on relapsing-remitting and secondary progressive participants were of higher quality compared to primary progressive and progressive relapsing. We reckon this is possibly due to the lower number of participants available for these subtypes both in the development and blind test set.
In addition, we also partitioned the blind test cohort according to age and report the performance obtained by GBC in Fig. 2. We followed the categorization of Table 1, however, removed the “age \(> 70\)” subgroup since it contained only one participant in the blind test cohort. The remaining subgroups “ age \(< 30\)”, “30 \(<=\) age \(< 50\)”, and “50 \(<=\) age \(< 70\)” contained 9, 67, and 44 participants respectively in the blind test set. Overall we observe AUROC to be in similar range across age-based subgroups.

Area under the receiver operating characteristic curve (AUROC) obtained by Gradient boosting classifier (GBC) for predicting occurrence of high-severity symptoms on different subgroups of the data: (A) four subtypes of multiple sclerosis and (B) three age groups. We include the 95% confidence intervals as error-bars. The bar representing “age \(< 30\)” for Cramps is missing from the figure due to the absence of participants in that intersection.
Identification of key predictive features
Figure 3 showcases the Gradient Boosting Classifier’s performance using only the elements of distinct feature groups: symptoms, demographics (only included age in our case), functional tests, passive signals, active features (union of symptoms and functional tests), and finally a set with all features. Note that age is the only static feature in our feature set, while others are continually collected.
The “all features” group has the highest performance out of all the segments, however the results depict that symptoms alone account for the biggest performance contribution compared to all remaining groups in most cases. Out of the sequential features, passive signals are found to be least predictive for all symptoms. The performance of functional tests come between symptoms and passive signals (four out of five symptoms). Overall the static “demographics” feature show the least performance compared to the dynamic feature groups.
In addition to investigating the impact of categories of features, we identified importance of individual features by performing permutation feature importance for the GBC model20. We found that the most predictive feature for a particular symptom is its past trajectory—consistent across all five symptoms considered in Table 2. This is as expected, and serves as a sanity check for our resulting models. The next most predictive features are not predictable and can be either other symptoms, functional tests, or passive signals. For example in the case of cramps we can see that the top 5 predictive features are all related in some way to spasticity, but bladder spasticity is an interesting one to make the top 5. We provide the top five features and their importance scores for each symptom in the Supplementary material.
Feature ablation studies
One important thing to note is that when the model is predicting the future trajectory of a particular symptom, it’s past data is included in the feature set. First, we ran an ablation study where for each symptom label we removed the predicted symptom from the feature set, so that when the model is predicting whether a symptom will be severe three months in the future, it has no information of what happened in the past. Results are reported in Table 2. AUROCs obtained were 0.755 [95% CI 0.734–0.773], 0.763 [95% CI 0.753–0.775], 0.744 [95% CI 0.727 0.761], 0.821 [95% CI 0.81–0.836], and 0.840 [95% CI 0.826 0.852] for cramps, depression or anxiety, fatigue, sensory disturbance, and walking instability, demonstrating a drop of 0.131, 0.083, 0.071, 0.090, and 0.048 respectively. On one hand, the performance drop indicates that a particular symptom’s past data is important while predicting its future trajectory. This finding is consistent with the feature importance analysis described in “Identification of key predictive features” section. On the other hand, even without that and by using data from solely other symptoms, functional tests, passive signals, and demographics, high performance could be achieved. This is also consistent with “Identification of key predictive features” section where we report that other predictive features apart from top most feature don’t follow a pattern. This highlights the importance of considering all available data collectively, which proves the need for methods that can analyze a wide range of data simultaneously.
Second, we included a simple rule-based algorithm as a baseline in Table 2 which produces a positive prediction if the median value of the severity score of the symptom in the previous three months was above threshold i.e. propagates the past. We term this rule as the “symptom propagation method” and it substantially under-performs GBC. This is meant to serve as proof that simply taking into account the symptom’s past values is not enough for an accurate assessment of that symptom’s future trajectory.

Area under the receiver operating characteristic curve (AUROC) achieved by Gradient Boosting Classifier (GBC) while predicting the incidence of high-severity symptoms on different groups of features: symptoms, demographics (only included age in our case), functional tests, passive signals, active features (combination of symptoms and functional tests), and lastly a set with all features. 95% confidence intervals have been included as error-bars.
Discussion
Through this multi-year cross-discipline study we have shown that the creation of a mobile app for people suffering with a chronic health condition is a vital step in collecting quality data that can be used for downstream prediction tasks. People affected by MS want to better understand their disease course, and to that end can contribute a wealth of information to aid the development of better predictive models.
Furthermore, using both active and passive data, we demonstrate that ML algorithms can predict high-severity symptoms in MS using functional tests and symptom surveys collected via a mobile app and passive signals from wearable devices. Symptomatic uncertainties associated with MS can have a substantial impact on quality of life, as individuals struggle to anticipate how they will feel each day, whether their symptoms will impede daily tasks, or know if particular symptoms originate from their MS. By focusing on actionable prediction of high-severity symptoms, the algorithm described here could improve anticipatory guidance and symptom management. For example, forecasting a change in walking ability can enable a clinician and subject to proactively discuss current activities and motivate the utilization of resources, such as physical therapy, before symptoms progress. Similarly, for predicted sensory disturbances or depression, mitigating medications can be discussed and considered preemptively. This avoids care delays or preventable burdens to subjects or caregivers who might need additional trips for further testing or procedures. The MS Mosaic App generated symptom summary reports for the participants on demand (e.g. for the previous 6 months), so that this report could be used in clinical conversation. Given the baseline results were close to random when using that information in isolation, we envision our model’s purpose is to provide additional context by summarizing a large amount of data points and predicting what the symptom trajectory might look like in the next 3-6 months. We believe this data will accelerate reactive conversations during clinical encounters and improve quality of life.
Gradient Boosting Classifiers (GBC) outperformed all other models and could predict whether the five chosen symptoms would cross over a moderate discomfort threshold three months in advance. While deep learning models perform well on large datasets, our work shows that more classic methods outperform them in this context, showcasing that it’s only sometimes necessary to use the most complex setup21. It has been demonstrated earlier that tree ensemble models outperform deep neural networks for tabular datasets. Since our dataset is tabular, sequential, and relatively small, GBC, a tree ensemble model, outperformed deep learning models such as TCN and RNN. We do note that overall TCN was the second best model.
Feature ablation studies showed that while the complete feature set demonstrated the highest model performance (based on AUROC), models without demographic information performed similarly. This result suggests that recording demographic data for predictive purposes may be optional. Future work is warranted to investigate whether demographic data benefits model performance and clinical utility, enabling additional vital considerations regarding the balance between data needs and privacy.
We also acknowledge certain limitations of this study which we discuss alongside potential solutions which we incorporated in further iterations of the app. First, symptom experience is subjective, so the same recorded score on the Lickert scale may be interpreted and assigned differently by different individuals. More effort could be made in future work to help individuals calibrate and standardize responses. Second, elements of data collection requiring significant effort may limit data completeness in some cases. In addition there was a noticed drop-off in engagement—from the 1804 participants who downloaded the app, only 713 participants reliably provided at least three months’ worth of data, with the median engagement overall being approximately seven weeks. Participant dropoff may also lead to some response bias in the data based on who signed up and continued to engage over time. Specifically, the population regularly engaging with the app represented a younger population than current epidemiological estimations suggest22. The app being restricted to English speakers, and iPhone users also contributed to this bias. To correct this, newer versions of the app have been designed for both iOS and Android, and have significantly improved upon the data entry burden. The solution employed in the study to improve retention consisted of daily notifications, with each day’s survey auto-populated with the previous entry’s responses - thus reducing the participant’s “entry burden” to documenting the changes in symptom severity or medication usage since the last survey. Third, some of the patients were treated with symptomatic therapies to manage the studied symptoms—a limitation of the observational nature of this study. The participants were asked to log their medication usage to account for potential symptom modifier effects in retrospective analysis, however the medication data was not standardized leading to a large number of different medications and categories (in the order of hundreds) which introduced a lot of noise in our models. We made the decision to cut them from the current study, and re-evaluated the medication imputation feature in the new version of the app. Fourth, instead of using validated survey instruments such as the Multiple Sclerosis Quality of Life Inventory (MSQLI), we used light-weight surveys. MSQLI was designed for use during clinical encounters and was meant to be collected on a less frequent basis. We anticipated that replicating it in the smartphone context would lead to a significantly greater burden on the participants where surveys were asked on a daily basis. We used the light-version to improve retention. Lastly, while substantial efforts were made to inform app development from machine learning and clinical perspectives, the app’s user experience could be further optimized for usability and engagement for the intended user population. This has now been iterated upon, and future versions of the app have accessibility at the top of mind.
To sum up, in this study we designed, built and launched an app that collected MS related data; ran the study for over 3 years; and we developed a model for symptom prediction in MS using subject provided responses and wearable data over time. This approach has the potential to empower subjects as experts of their own experience in order to improve symptom management, and to optimize the often limited interactions with physicians and clinical experts.
Methods
Study design and participants
We performed a prospective, case-control, siteless study through a mobile application, MS Mosaic for data collection and retrospectively developed machine learning models. The mobile application was designed during a two-year collaboration between a professional software development team (Thread Research) and MS care providers, data scientists, MS subjects, and computer science undergraduates recruited at Duke University. An overview of the study design and development steps can be seen in Fig. 4. Institutional review boards at Duke University and Duke Health approved the relevant aspects of the mobile application development process and the primary research protocol. All methods were performed in accordance with the relevant guidelines and regulations of Duke University and Duke Neurology who sponsored the study. All study data are stored in a HIPAA-compliant trench of Amazon Web Services. The analyses presented here were performed in collaboration with Google data scientists.

Study diagram showcasing all the steps from inception to research output.
The app was available in the United States for download from the Apple App Store from the study’s launch on September 29, 2017, until December 19, 2020. Eligibility criteria included possessing a compatible Apple iPhone, being 18 or older, United States residency, and proficiency in English. Participation was not limited to people with multiple sclerosis since we deemed it necessary to obtain a baseline from healthy controls. All participants provided electronically signed informed consent, which included permissions on data sharing. The analyses presented here were performed on the large subset of participants that permitted sharing their anonymized data with collaborators outside of Duke University. The study’s consent form and methods used for anonymization are provided in the Supplementary material. The study app confirmed eligibility, offered study education, obtained consent, assisted participants through various study-related tasks, provided curated disease education, and summarized submitted data for the participant’s use. Newly enrolled participants would complete an initial background survey for general demographics (age, gender, geographic region where they grew up, smoking history, history of mononucleosis). Contributors were then asked if they had been diagnosed with MS and, if so, answered basic information about the nature and length of their MS experience (type of MS, age at diagnosis, history of previous disease modifier use) and more in-depth surveys regarding their MS symptoms. Participants were then prompted daily to record their medication adherence and rate symptom severity on a 5-point Likert scale23 from a pre-populated list of the most common MS-associated symptoms. Each day’s symptom survey was pre-populated to reduce data entry fatigue with the most recent responses. Participants only needed to rate a given symptom by how much it had changed since the last entry. The medications were removed from the final list of features, due to the large amount of non-standard entries which expanded the feature space by more than 10,000. This huge amount of sparsity made learning impossible, and in the future we plan to standardize at least the medication category and mode of action.
Participants also completed the following open-source performance assessment tests in a bi-weekly cadence: two finger tapping interval, timed 25-foot walk, PASAT, nine-hole peg test, and spatial memory Test. The two finger tapping interval asks the participants to tap their fingers on their phone’s screen and is meant to measure speed, coordination, and rate of fatigue. The timed 25-Step Walk prompts to measure a 25-foot walk with the phone in the participants pockets for measuring gait and balance. The PASAT test asks users to add a series of numbers together and tap on the correct sum at the bottom of the screen to test auditory information processing speed and flexibility, and calculation ability. The nine-hole peg test prompts participants to “pinch” a solid circle and move it to the proper place on the screen for measuring upper-extremity function. The spatial memory test causes flowers to light up on the screen. The participants are asked to tap on the flowers in the same pattern that they appeared for testing short-term memory.
Lastly, the Apple Health app passively collected three optional physiologic measures: daily step counts, sleep data, and heart rate. No participants were obligated to share this physiological data, and they had the option to specify exactly what (if any) information they would like to share as part of the consent process. The initial baseline assessments took up to thirty minutes to complete, whereas each day’s diary entries were intended to be completed within 2 minutes. This gave an excellent overview of many aspects of a participant’s health state while providing a good picture of what items were more cumbersome to obtain based on the missingness in the data. Participants were asked to participate in the study for at least six months. The study collected data from September 2017 to July 2021, and 1804 participants enrolled in total. This data collected by Duke was then de-identified by a third party before being transferred to Google for this research, and as such only age remains as a demographic feature.
Data preprocessing
The preprocessing pipeline consisted of transforming the data into a sequential representation that was then used for modelling purposes, similar to our prior work24. The raw data is taken through a set of processing steps into a common sequential representation called Subject (inspired from previous work on EHR datasets25), after which a Label Creator runs on all processed data and enriches it with the symptom labels. All categorical features are one-hot encoded based on an established vocabulary that’s training set dependent. After training, a prediction format is used to save all model output. This in turn gets fed into the metrics pipeline which can provide results at both population and subgroup levels.
From the total number of participants who downloaded the app, we excluded those that did not use the app for at least 3 months. This was meant to reduce noise from participants who provided only limited data points. Furthermore, eighteen accounts for which the initial survey was filled multiple times were excluded because we could not be confident that the data belonged to a single person. We also conducted symptom-level de-duplication. In some cases, the same symptoms were recorded by the app in quick succession. In these instances, we only considered the final symptom-associated value for the given block of symptom recordings.
Ground-truth labels using self-reported symptoms
Keeping clinical actionability as the primary goal, we focused on early prediction of high-severity symptoms. Out of the nineteen symptoms recorded in the MS Mosaic app, we chose five (cramps, depression or anxiety, fatigue, sensory disturbance, and walking instability or coordination problems) since these can be alleviated by interventions and occurred with high-frequency in the dataset. For example, clinicians may use physical therapy to control fatigue and walking instability, anticonvulsants for sensory disturbance, mood stabilizers for depression and anxiety, and muscle relaxants for cramps.
The symptom information in the dataset is self-reported and consists of the symptom name, date, and time it was registered, and the severity rated on a Likert scale23. We performed continuous predictions triggered at weekly intervals on whether the median severity of one of the five symptoms would be above two in the next three months in the future. The prediction window was chosen based on clinical input, keeping deployment in mind. Prediction was formulated as a binary classification task, but we noted high class-imbalance. Positive labels (i.e. instances where symptom severity in the next three months will be greater than two) were the minority class and constituted 17.82%, 24.71%, 41.00%. 16.07%, and 28.39% of the dataset for cramps, depression or anxiety, fatigue, sensory disturbance and walking instability respectively.
A severity of 0 would be the equivalent of a symptom not experienced currently. Participants were asked to report new symptoms or any changes to the existing symptoms daily. In the cases where nothing changed, their previous answers would be propagated downstream. The intention was that a clinician could check whether their subject would be at risk of any significant symptom evolution before their subsequent visit and provide anticipatory guidance or take preventive measures.
Model development
For each subject in the cohort, we created a sequence of instances by partitioning the entire period. Each instance contained the information recorded by the MS Mosaic app within a three year period. The available data within each instance was combined across the time dimension to form a feature set used as input to our predictive models.
We divided the data randomly by participant into 80% (N = 567) development and 20% blind test (N = 146) cohorts for model development and testing, respectively. We compared five modeling strategies: 3 classical ML algorithms (logistic regression (LR) , gradient boosting classifier (GBC)26, multilayer perceptron (MLP) and two sequential deep neural networks (recurrent neural networks (RNN)27 and temporal convolutional neural (TCN) networks28). To implement the classical ML algorithms, we used the Python scikit-learn library (Python Software Foundation) version 1.0.229. TensorFlow30 and Keras31 were used to implement the deep neural network models. The development cohort was used to train and validate the models through 5-fold cross-validation. We replaced missing values in the data with zeros. Note that we pre-populate the daily surveys with a participant’s previous responses, hence a lack of response will not lead to a zero entry rather the response the participants entered previously. The best performing model for each of the five modeling strategies was then evaluated on the blind test cohort which had not been used for model training. All data processing and analysis were implemented in Python version 3.9.14, NumPy version 1.23.2, and Apache beam version 2.43.0.
Statistical analysis
We evaluated the discriminative performance by comparing two performance metrics: the area under the receiver operating characteristic curve (AUROC) was used to assess the trade-off between sensitivity and specificity across varying thresholds, and the area under the precision recall curve (AUPRC) presented further information for imbalanced prediction tasks when the percentage of positive labels was low32. For both the AUROC and AUPRC, values closer to 1 correspond to more accurate models.
Model calibration was measured by computing the Brier score which represents the mean squared error between the observed and predicted risk. The lower the Brier score is for a set of predictions, the better the predictions are calibrated.
In addition, we reported the receiver operating characteristic, precision-recall, and calibration curves as a visual verification of the discriminatory and calibration performance of the models.
The metrics were implemented using the scikit-learn version 1.0.2 Python library29. 95% confidence intervals were obtained through bootstrapping using 200 bootstrap estimators.
Multiple sclerosis can have four subtypes: relapsing-remitting, secondary-progressive, primary-progressive, and progressive-relapsing. To assess the ability of the ML models in different MS subtypes, we divided the blind test cohort into these four groups and computed the performance metrics. In addition, we stratified the blind test cohort by age (only demographic attribute that was available in the data) to demonstrate performance across subgroups. We were unable to retrieve the gender information of participants due to technical failure during data storage.
We performed different feature ablation experiments to assess each feature group’s association with symptom prediction. We divided the feature set into the following groups: demographics, questionnaires, functional tests, and passive signals, and evaluated performance when the models were trained separately on these feature groups.
Data availability
The data used for the development and blind test set were collected through the publicly launched MS Signals App developed at the Duke University and transferred to a secure data centre with strict access controls in de-identified format. Anonymized data can be made available upon reasonable request for academic purposes. Please contact fletcher.hartsell@duke.edu for details.
Code availability
We make use of several open-source libraries to conduct our experiments: the machine learning framework Scikit-Learn (https://scikit-learn.org/stable/), TensorFlow (https://github.com/tensorflow/tensorflow) along with the TensorFlow library Keras (https://www.tensorflow.org/api_docs/python/tf/keras), which provides implementations of individual model components. Our experimental framework makes use of proprietary libraries and we are unable to publicly release this code. We detail the experiments and implementation details in the Methods and Supplementary Information to allow for independent replication.
References
Monteiro, M. et al. Multiclass semantic segmentation and quantification of traumatic brain injury lesions on head CT using deep learning: An algorithm development and multicentre validation study. Lancet Digit. Health 2(6), e314–e322. https://doi.org/10.1016/S2589-7500(20)30085-6 (2020).
Choy, G. et al. Current applications and future impact of machine learning in radiology. Radiology 288(2), 318–328. https://doi.org/10.1148/radiol.2018171820 (2018).
Mazurowski, M. A., Buda, M., Saha, A. & Bashir, M. R. Deep learning in radiology: An overview of the concepts and a survey of the state of the art with focus on MRI. J. Magn. Reson. Imaging 49(4), 939–954. https://doi.org/10.1002/jmri.26534 (2019).
Saba, L. et al. The present and future of deep learning in radiology. Eur. J. Radiol. 114, 14–24. https://doi.org/10.1016/j.ejrad.2019.02.038 (2019).
Echle, A. et al. Deep learning in cancer pathology: A new generation of clinical biomarkers. Br. J. Cancer 124(4), 686–696. https://doi.org/10.1038/s41416-020-01122-x (2021).
Hongming, X., Cheng, L., Berendt, R., Jha, N. & Mandal, M. Automatic nuclear segmentation using multiscale radial line scanning with dynamic programming. IEEE Trans. Biomed. Eng. 64(10), 2475–2485. https://doi.org/10.1109/TBME.2017.2649485 (2017).
Gulshan, V. et al. Development and validation of a deep learning algorithm for detection of diabetic retinopathy in retinal fundus photographs. JAMA 316(22), 2402–2410. https://doi.org/10.1001/jama.2016.17216 (2016).
Rahimy, E. Deep learning applications in ophthalmology. Curr. Opin. Ophthalmol.29(3) (2018).
Tomašev, N. et al. A clinically applicable approach to continuous prediction of future acute kidney injury. Nature 572(7767), 116–119. https://doi.org/10.1038/s41586-019-1390-1 (2019).
Montesinos-López, O. A. et al. A review of deep learning applications for genomic selection. BMC Genomics 22(1), 19. https://doi.org/10.1186/s12864-020-07319-x (2021).
Zou, J. et al. A primer on deep learning in genomics. Nat. Genet. 51(1), 12–18. https://doi.org/10.1038/s41588-018-0295-5 (2019).
Pinto, M. F. et al. Prediction of disease progression and outcomes in multiple sclerosis with machine learning. Sci. Rep. 10(1), 1–13. https://doi.org/10.1038/s41598-020-78212-6 (2020).
Rodriguez, J. D., Perez, A., Arteta, D., Tejedor, D. & Lozano, J. A. Using multidimensional Bayesian network classifiers to assist the treatment of multiple sclerosis. IEEE Trans. Syst. Man Cybern. Part C (Appl. Rev.) 42(6), 1705–1715. https://doi.org/10.1109/TSMCC.2012.2217326 (2012).
Seccia, R. et al. Considering patient clinical history impacts performance of machine learning models in predicting course of multiple sclerosis. PLoS ONE 15(3), 1–18. https://doi.org/10.1371/journal.pone.0230219 (2020).
Tommasin, S. et al. Machine learning classifier to identify clinical and radiological features relevant to disability progression in multiple sclerosis. J. Neurol.https://doi.org/10.1007/s00415-021-10605-7 (2021).
Zhao, Y. et al. Exploration of machine learning techniques in predicting multiple sclerosis disease course. PLoS ONE 12(4), 1–13. https://doi.org/10.1371/journal.pone.0174866 (2017).
Montalban, X. et al. A smartphone sensor-based digital outcome assessment of multiple sclerosis. Mult. Scler. J. 28(4), 654–664. https://doi.org/10.1177/13524585211028561 (2022).
van der Walt, A. et al. Developing a digital solution for remote assessment in multiple sclerosis: From concept to software as a medical device. Brain Sci.https://doi.org/10.3390/brainsci11091247 (2021).
Shwartz-Ziv, R. & Armon, A. Tabular data: Deep learning is not all you need. Inform. Fusion 81, 84–90. https://doi.org/10.1016/j.inffus.2021.11.011 (2022).
Breiman, L. Random forests. Mach. Learn. 45(1), 5–32. https://doi.org/10.1023/A:1010933404324 (2001).
Shwartz-Ziv, R. & Armon, A. Tabular data: Deep learning is not all you need. CoRR. arXiv:abs/2106.03253 (2021).
The Multiple Sclerosis International Federation. Atlas of MS. https://www.msif.org/resource/atlas-of-ms-2020/. Accessed Sep 3 2020 (2020).
Likert, R. A technique for the measurement of attitudes. Arch. Psychol. 22(140), 55 (1932).
Roy, S., Mincu, D., Proleev, L., Rostamzadeh, N., Ghate, C., Harris, N., Chen, C., Schrouff, J., Tomašev, N., Hartsell, F. L. & Heller, K. Disability prediction in multiple sclerosis using performance outcome measures and demographic data. In Proceedings of the Conference on Health, Inference, and Learning, volume 174 of Proceedings of Machine Learning Research (eds. Flores, G., Chen, G. H., Pollard, T., Ho, J. C. & Naumann, T.) 375–396. (PMLR, 2022). https://proceedings.mlr.press/v174/roy22a.html.
Tomašev, N. et al. Use of deep learning to develop continuous-risk models for adverse event prediction from electronic health records. Nat. Protoc. 16(6), 2765–2787. https://doi.org/10.1038/s41596-021-00513-5 (2021).
Friedman, J. H. Greedy function approximation: A gradient boosting machine. Ann. Stat. 29(5), 1189–1232. https://doi.org/10.1214/aos/1013203451 (2001).
Rumelhart, D. E. & McClelland, J. L. Learning Internal Representations by Error Propagation, 318–362 (1987).
Bai, S., Kolter, J. Z. & Koltun, V. An Empirical Evaluation of Generic Convolutional and Recurrent Networks for Sequence Modeling (2018).
Pedregosa, F. et al. Scikit-learn: Machine learning in Python. J. Mach. Learn. Res. 12, 2825–2830 (2011).
Abadi, M., Agarwal, A., Barham, P., Brevdo, E., Chen, Z., Citro, C., Corrado, G. S., Davis, A., Dean, J., Devin, M., Ghemawat, S., Goodfellow, I., Harp, A., Irving, G., Isard, M., Jia, Y., Jozefowicz, R., Kaiser, L., Kudlur, M., Levenberg, J., Mané, D., Monga, R., Moore, S., Murray, D., Olah, C., Schuster, M., Shlens, J., Steiner, B., Sutskever, I., Talwar, K., Tucker, P., Vanhoucke, V., Vasudevan, V., Viégas, F., Vinyals, O., Warden, P., Wattenberg, M., Wicke, M., Yu, Y. & Zheng, X. TensorFlow: Large-Scale Machine Learning on Heterogeneous Systems (2015). https://www.tensorflow.org/. Software available from tensorflow.org.
Chollet, F. et al. Keras. https://github.com/fchollet/keras (2015).
Davis, J. & Goadrich, M. The relationship between precision-recall and roc curves. In Proceedings of the 23rd International Conference on Machine Learning, ICML ’06, pp. 233–240, New York, NY, USA. Association for Computing Machinery. ISBN 1595933832. https://doi.org/10.1145/1143844.1143874 (2006).
Acknowledgements
We would like to thank our colleagues and collaborators: Noah Broestl, Jessica Schrouff, Nenad Tomasev, Negar Rostamzadeh, Stephen Pfohl, Natalie Harris, Emily Salkey, Jared Sisk, and Alex Norcliffe for fruitful discussions and reviews.
Ethics declarations
Competing interests
The authors declare no competing interests.
Additional information
Publisher's note
Springer Nature remains neutral with regard to jurisdictional claims in published maps and institutional affiliations.
Supplementary Information
Rights and permissions
Open Access This article is licensed under a Creative Commons Attribution-NonCommercial-NoDerivatives 4.0 International License, which permits any non-commercial use, sharing, distribution and reproduction in any medium or format, as long as you give appropriate credit to the original author(s) and the source, provide a link to the Creative Commons licence, and indicate if you modified the licensed material. You do not have permission under this licence to share adapted material derived from this article or parts of it. The images or other third party material in this article are included in the article’s Creative Commons licence, unless indicated otherwise in a credit line to the material. If material is not included in the article’s Creative Commons licence and your intended use is not permitted by statutory regulation or exceeds the permitted use, you will need to obtain permission directly from the copyright holder. To view a copy of this licence, visit http://creativecommons.org/licenses/by-nc-nd/4.0/.
About this article

Cite this article
Roy, S., Mincu, D., Proleev, L. et al. Performance of machine learning models for predicting high-severity symptoms in multiple sclerosis. Sci Rep 15, 18209 (2025). https://doi.org/10.1038/s41598-024-63888-x
Received:
Accepted:
Published:
DOI: https://doi.org/10.1038/s41598-024-63888-x
关于《Performance of machine learning models for predicting high-severity symptoms in multiple sclerosis》的评论
发表评论
摘要
相关讨论
- 在新加坡做面试官的经历 (Interviewer Experience for UI/UX Designer in Singapore)
- Global Neck Cream and Mask Sales Market Surges with Demand for Targeted Skincare Solutions and Anti-Aging Innovations
- 刷Leetcode (01) Remove Duplicates from Sorted Array
- 分享一个消息:新加坡奇缺数据科学方面人才
- 大早上打扰了,请教审核问题 3.1: Apps or metadata that mentions the name of any other mobile platform will be rejected