

Comparative analysis of natural language processing methodologies for classifying computed tomography enterography reports in Crohn’s disease patients
作者:Baumgart, Daniel C.
Introduction
Crohn’s disease (CD)1, an inflammatory bowel disease2 (IBD), results from an inappropriate immune response towards the commensal microbiota3 in genetically4 susceptible individuals. It is exacerbated and promoted by environmental factors such as Western lifestyle, diet, and industrialization. It cannot be cured and requires lifelong medical therapy5. CD primarily affects the digestive tract, but due to its systemic nature can involve virtually all parts of the human body through extraintestinal manifestations and associated autoimmune diseases6,7,8.
Canada’s vast geographic area and low population density pose profound challenges for access to highly specialized health care for remote and rural residents. Only 2.4% of all specialists practice in rural and small-town Canada according to the Canadian Institute of Health Information. Rural patients need to travel far, often >500 km, for access to a specialist and even farther for an IBD expert9.
The new gold standard to determine disease extent, activity, complications as well as treatment success and complications are imaging endpoints10. Although professional guidelines for image interpretation11,12 have been published, in reality, expert physicians are only available in select centers, never around the clock, and there is debate about the utility of some of the available scoring systems. On the other hand, artificial intelligence (AI) enhanced computer vision has shown great promise in objective, reproducible image processing.
Computed tomography (CT) enterography (CTE)13 is used to non-invasively evaluate small bowel involvement of CD in daily clinical practice, especially in North America. To eventually develop automated AI-enabled image interpretation for IBD, a critically important step is to distinguish (classify and label) studies that show disease-specific features from those that do not. Here we evaluate the utility of different natural language processing (NLP) methods to accurately detect the diagnosis of CD on CTE radiologist-dictated textual reports and label the studies accordingly, a critical step towards training a large imaging model.
Results
Rationale extraction to classify CTE reports
The experimental results for the rule-based and rationale extraction methods are summarized in Table 1. The rule-based system produced a Recall of 0.875—higher than any rationale extraction technique. However, on all other metrics, the Bi-LSTM classifier, without any rationale extraction, obtained the highest scores. In this situation, the entire radiology report is passed into the classifier without processing to extract rationales. Furthermore, for techniques that employed rationale extraction, longer average rationale lengths tended to produce higher metrics. This concurs with reports on rationale extraction from non-medical domains14,15.
The rule-based classifier provided explanations and allowed human experts to investigate and modify the rules. An example of the decision-making process of using the extracted strong indicators for identifying a report with Crohn’s disease can be found in Supplementary Fig. 1. In addition, as shown in the experimental results, the rule-based classifier using the strong rationale extraction indicators is competitive with the original rationale extraction model in terms of predictive performance.
However, compared with the CNN, Bi-LSTM-based rationale extraction models showed a much higher variance in terms of accuracy and rationale length. During the experimental runs of the same hyperparameter settings (i.e., for selection and contiguity loss), the Bi-LSTM-based model sometimes selected very few words as rationales and then showed poor prediction performance that is close to random guessing. For example, over the 10 experiments for the Bi-LSTM-based rationale extraction model with the hyperparameters \({\lambda }_{1}\) = 0.001 and \({\lambda }_{2}\) = 0, we obtained the averaged rationale length of [21.80, 15.85, 16.42, 0.15, 0.20, 12.38, 16.86, 13.48, 23.12, 0.13] in words. These average rationale lengths had predictive accuracies of [0.833, 0.838, 0.803, 0.480, 0.510, 0.798, 0.793, 0.803, 0.833, 0.525] respectively. Note that average rationale lengths of [0.15, 0.20, 0.13] words corresponded to average predictive accuracy of [0.480, 0.510, 0.525]. This is close to the expected accuracy of 0.5 for random guessing in a binary classification task, like ours. The standard deviation of accuracy for measuring the predictive performance of the methods can be found in Table 1. When comparing the results of different hyper-parameter settings for rationale constraints, i.e., \({\lambda }_{1}\) and \({\lambda }_{2}\) from (Eq. (1)), we focused on \({\lambda }_{1}\) as it constrains the rationale length which is essential for rationales to contain more discriminative features. The use of \({\lambda }_{2}\) helps to tune the rationale contiguity, which is optional depending on user preferences.
Several generations of large language models to classify CTE reports
The experimental results for the language model-based methods are summarized in Table 2. DistilBERT produced the highest (best) Precision at 0.914. On all other metrics, IBDBERT produced the highest (best) scores among LLMs, followed by BioClinicalBERT. IBDBERT also produced higher (better) Accuracy, Precision, F1 and AUC values than any of the rule-based or rationale-extraction methods. IBDBERT’s Recall, 0.856, was the 2nd highest score among all methods evaluated, and the highest among the LLMs. During our development of IBDBERT, we observed that the learning rate for the language modeling pretraining had a significant effect on the predictive performance of its downstream classification task of detecting CD from CTE reports. Intuitively, the LR controls the rate at which training weights are changed based on classification errors, so higher LR means faster change across epochs of training. Among all the LR values we have experimented with (i.e., [1e–6, 5e–6, 1e–5, 2e–5, 3e–5, 4e–5, 5e–5]), IBDBERT achieves the highest classification accuracy (i.e., 88.6%) when the pretraining LR is set to be 1e–5. The result seems reasonable as a larger LR might cause BERT to “forget” its previous general language understanding and a small LR might cause BERT to be unable to learn much from the added IBD knowledge. When the LR is smaller or larger than 1e–5, overall, the performance separately increases or decreases as the LR changes (i.e., the peak performance is achieved by LR = 1e–5). The detailed performance of IBDBERT over the different values of LR is depicted in Fig. 1. Generally, under multiple LR settings, IBDBERT achieved a predictive accuracy of around 88% in the task of classifying CD; this outperforms the original BERT and BioClinicalBERT by more than 1%.
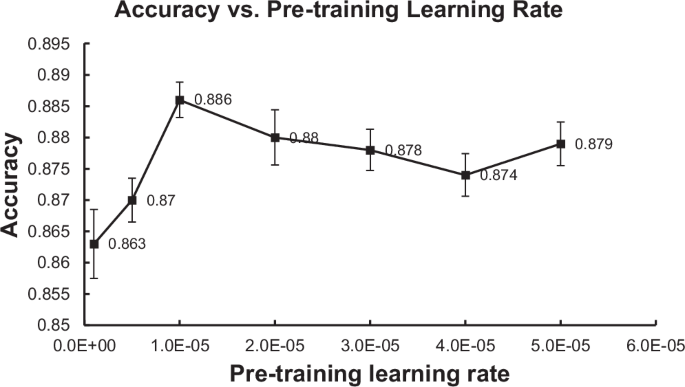
Each point represents the mean from 5 repeated experiments. The error bars indicate the standard error of the mean.
In addition, we conducted t tests comparing the AUC values of IBDBERT with each of the BERT-based models. All p values were below 0.05, indicating that IBDBERT demonstrated significantly better performance than the other BERT-based models. For example, the comparison between IBDBERT and the baseline BERT model yielded a t-statistic of 2.383 and a p value of 0.023, rejecting the null hypothesis that the two models have equal mean AUC values. These results support the effectiveness of our methodology in developing IBDBERT. The ROC curves for BERT and IBDBERT are shown in Fig. 2, and the complete set of p-values from these statistical tests is summarized in Table 2.

IBDBERT had an AUC of 0.945 while BERT had an AUC of 0.936, which were significantly different on t-test (p = 0.023). For clarity, we show only two curves, IBDBERT and BERT, with AUC values for other models listed in Table 2.
The off-the-shelf LLMs LLaMA-3.3-70B-Instruct and DeepSeek-R1-Distill-LLaMA-70B achieved predictive classification accuracies of 91.2% and 88.9% respectively. Since LLM responses do not provide meaningful prediction probabilities for calculating AUC, we instead report their F1 scores. LLaMA and DeepSeek achieved F1 scores of 0.907 and 0.874, respectively, compared to 0.879 for IBDBERT. The p values from the t tests suggest that LLaMA outperforms IBDBERT, while DeepSeek performs comparably. Evaluation details for all the language models used, along with the results of statistical tests on F1 scores comparing each model to IBDBERT, are provided in Table 2.
Error analysis of large language models
To further understand model behavior and limitations, we conducted an error analysis on both false positive and false negative cases from the three best-performing models: IBDBERT, LLaMA, and DeepSeek. This analysis revealed several noteworthy trends in the models’ decision-making processes (see Table 3 for selected model-specific misclassification examples and Table 4 for shared failure cases across all models).
One key pattern observed was the tendency to over-rely on the clinical history or indication section at the beginning of radiology reports, rather than critically assessing the imaging findings. This behavior was particularly pronounced in the large language models (LLMs), such as LLaMA and DeepSeek, but also evident in IBDBERT. A representative example, shown in Table 4, is the shared false positive case, where the opening line reads: “CT enterography known ileocolonic dx complicated by PSC liver c?, 2 week hx of increasing abdo pain, Crohn’s flare up.” All three models classified this case as positive for Crohn’s disease, despite the imaging findings clearly stating “no mural thickening, or any abnormality of enhancement of the wall… no evidence of obstruction,” which should have led to a negative classification. This suggests that the models may give excessive weight to prior diagnosis or referring physician’s impressions rather than grounding predictions in the evidence provided in the current imaging.
False negatives also revealed model weaknesses. For instance, in a shared false negative case, (also in Table 4), the report included findings such as “submucosal fatty infiltration involving the terminal ileum” and “luminal narrowing… possibly due to peristalsis rather than a fixed stricture.” Despite these features often being associated with Crohn’s disease, all three models predicted “No”, likely due to the report’s lack of explicit mention of Crohn’s.
IBDBERT, although fine-tuned on task-specific expert annotations, sometimes failed to recognize subtle indicators of Crohn’s disease when phrased indirectly. For instance, in a false negative case (Table 3), the report clearly described “aphthous ulcers in terminal ileum, likely to be Crohn’s disease,” yet the model predicted “No.” This suggests IBDBERT struggles with implicit diagnostic suggestions that are not confirmed in absolute terms. In the case of LLaMA, the model justified its “Yes” answer in a false positive case based on the presence of “ileal Crohn’s disease” in the history field, while explicitly acknowledging “no bowel wall thickening” in the imaging. Similarly, in a false negative, the model emphasized lack of inflammation or stricture while overlooking a report section mentioning disease extent and mucosal changes. This indicates that LLaMA may struggle to integrate conflicting or nuanced inputs. DeepSeek frequently generated lengthy reasoning chains, often beginning with confirmation of a patient’s medical history (e.g., “on Remicade for Crohn’s disease”) and then overlooking the absence of active disease in imaging findings. For example, in one false positive, it noted “no evidence of acute inflammatory bowel disease” but still concluded “Yes” based on past history and medication use.
These findings, detailed in Tables 3, 4, underscore the importance of ensuring that models are grounded in current imaging evidence rather than prior clinical context alone.
Discussion
In a systematic set of experiments based on a data sample captured in 106 hospitals and 40 primary care networks representative of an entire Provincial population of 4.7 million citizens, we evaluated two fundamentally different experimental approaches (rule or rationale extraction based versus large language model based) to classify CTE radiology reports from patients with CD. Ultimately, the large language model-based approach was superior. Moreover, we were able to show that our custom large language model, augmented with a relatively small IBD expert knowledge outperformed generic and classic clinical BERT-based LLMs trained on non-specific health or extremely specialized, irrelevant (i.e. ICU data in MMIC-III) health records. Note that this augmentation of so-called “pretrained” LLMs is a common process of augmenting large language models that have already been fully trained on generic knowledge, which provides the basis for their facility with natural language processing. Through a series of model refinements, we were able to achieve superior performance in detecting CD on CTE textual reports.
The results of our work are a step forward to eventually develop automated digestive image interpretation, which requires among other challenges labeling of large volumes of imaging data to train interpretable models. Accurate diagnosis detection (classification) from radiologists’ textual reports is the first critical step, which was the goal of this study.
To the best of our knowledge, this is the first study to look at identifying chronic disease from textual reports using rationale extraction. This has not yet been widely applied in medical tasks, except for hospital readmission prediction14,15. We are also the first to adapt BERT16 to IBD using domain-specific pre-training with text from professional clinical guidelines and textbooks, i.e. IBD expert knowledge. This is unlike MedBERT17, BioClinicalBERT18 CancerBERT19, and BEHRT20 that were all trained on generic or highly specialized (ICU) electronic health records including The Medical Information Mart for Intensive Care III (MIMIC-III)21, Clinical Practice Research Datalink (CPRD)22 and unstructured solid tumor pathology reports containing 121 million words. The superior performance of IBDBERT over BioClinicalBERT likely results from the BioClinicalBERT’s training source MMIC-III, a database containing electronic health records from ICU patients at the Beth Israel Hospital in Boston, MA. Since IBD and in particular Crohn’s disease fortunately rarely require critical care, a model trained on such a (largely IBD irrelevant dataset) appears to be inferior.
IBDBERT’s training corpus only contained around 0.9 million words, which is a relatively small dataset compared to 3300 million words used for the original BERT and the extra data collected from 0.28 million, 1.6 million, and 20 million patients for CancerBERT, BEHRT, and MedBERT, respectively. It is encouraging that our augmented BERT model specific to IBD (IBDBERT) showed the highest performance among BERT-based models, highlighting the value of high-quality, domain-specific expert annotations.
Our findings offer nuanced insights for both the research community and the broader public. The general-purpose LLM LLaMA 3.3 70B ultimately achieved the highest predictive performance. However, LLaMA 3.3 and DeepSeek are each over 600 times larger than IBDBERT (70B parameters in LLaMA 3.3 and DeepSeek vs. 110 M parameters in IBDBERT). Furthermore, the difference between IBDBERT and DeepSeek-R1 was not statistically significant. This suggests that smaller, fine-tuned models built on expert-curated data can perform on par with or close to state-of-the-art large language models in specialized clinical tasks.
These results reinforce the importance of investing in high-quality, domain-specific datasets for LLM development. Even as general-purpose LLMs grow in size and capability, targeted models like IBDBERT remain valuable tools—particularly in healthcare settings where expert knowledge and interpretability are critical.
Our work is a milestone in the application of NLP to textual data in IBD. A purported promise of AI in IBD is to infer patient disease states, including disease -extent, -activity, and -complications as well as extraintestinal manifestations6,7 and associated autoimmune disorders, from unstructured clinical notes and reports23. Although this hasn’t yet been fully realized in cross-sectional imaging study reports in particular, the detection of extraintestinal manifestations in outpatient clinical notes and also the phenotypic characterization of small bowel CD using magnetic resonance (MR) enterography (MRE) reports were published24,25.
There are several limitations of this work. The control group was atypical (i.e., did not include exclusively healthy individuals, but some with suspected, but then not confirmed CD or other unrelated medical conditions such as iron deficiency anemia, where CTE was deployed to investigate a small intestinal source of bleeding for instance); the control group is also not fully gender- and age-matched population to compare against. Therefore, these models may not extrapolate or perform as well at detecting CD in textual reports from an ideal healthy population (which then again is usually not exposed to ionizing radiation that occurs in CTE for diagnostic medical purposes). Another limitation and lesson learned was heterogeneity: the extent, language, and quality of radiology textual reports vary greatly, particularly between interpreters (different radiologists with different levels of training, experience, and dictation style). Medical jargon, grammatically incorrect words, and lack of structure are important challenges in working with this data. In a perfect world, we would have clearly structured reports, with separate indications, findings, and interpretation/conclusion sections. However, these challenges must be overcome to get the most value from this type of rich data which is abundant in the healthcare systems26. It is also a stark reminder that in order to take full advantage of electronic health record (EHR/EMR) systems and develop AI-based clinical decision support27,28, a cultural change among health professionals to move away from dictating copious volumes of unstructured text and move towards collecting and recording structured data in EMR/HER systems is essential and will accelerate discovery and innovation in digital health that began some two decades ago28.
We recognize that there has been a recent and rapid proliferation of several alternative proprietary LLMs, e.g., Bard (Google Inc., Mountain View, CA, USA) or ChatGPT (OpenAI, San Francisco, USA), as well as open-source LLMs the Pythia series (EleutherAI, New York, NY, USA), StableLM series (StabilityAI Ltd., London, UK), OpenLLaMA (Berkeley AI Research, Berkeley, CA, USA) and MPT (MosaicML Pretrained Transformer) (Mosaic ML, San Francisco, CA, USA). Our experimental design is general enough that it could be adapted to future experiments with emerging LLMs, but with the constraint to avoid proprietary LLMs.
The question of interpretability of machine-learned predictive classification outputs is a very general challenge that is the focus of much current research on explainable AI systems (XAI)29. In our specific case for binary predictions of CTE-positive or CTE-negative, the identified rationales as fragments of text serve as the vocabulary for predictive explanation, and the quality of those explanations critically depends on the clinical user’s familiarity with the identified rationales. A more detailed evaluation of this foundation of XAI would be to develop an explicit process of engaging clinicians, not just in the labeling of classification data, but also in the development of consensus on acceptable rationales that would serve as explanations for predictive model outputs. In the developing field of XAI, general methods for explanation evaluation remain elusive.
In future work, we aim to improve tokenization of the textual reports which ay in turn improve the performance of models, as this has been shown to improve the performance of BERT models in breast cancer cross-sectional imaging study textual reports30. Furthermore, we will explore if more specific domain knowledge can be provided to the models, through expert labeling or more precise fine-tuning with domain knowledge.
We plan to characterize CD not just at a global patient or report level, but disease activity at specific anatomical regions of the image as described in the textual reports. We believe this would be another step towards a clinically relevant and practical task to aid clinicians in decision-making and enhance the care of IBD.
Methods
Setting: the healthcare system in Alberta
Alberta is home to more than 4.7 million people. The population has diverse ethnic and cultural origins with 250 distinct groups including First Nations and immigrants from all continents according to the latest census of Statistics Canada31. All legal residents of Alberta are entitled to publicly funded and administered healthcare that is delivered across 106 acute care hospitals and in 40 primary care networks to all its citizens. Their care is documented in the Alberta Electronic Health Record Information System (EHRIS) dating back to 1997 that is jointly operated by Alberta’s Ministry of Health and Alberta Health Services32. All available data items are cataloged in the Alberta Health Data Asset Directory and the Alberta Health Services Data Asset Inventory Summary.
Patient population: the Alberta inflammatory bowel disease patient registry
A population representative (please see above for details) IBD patient registry (n = ) was developed and implemented by author DCB in the Provincial Electronic Health Record System Connect Care, based on a highly customized version of Epic Hyperspace (Epic Inc., WI, USA). All patients who were diagnosed at least once with IBD from 2002 to 2020 with the Canadian versions of the WHO International Classification of Diseases (ICD) codes ICD-10CA and ICD-9CA were included.
Ethics approval
The study did not require informed consent and the protocol was approved by the Health Research Ethics Board of the University of Alberta Institutional Review Board (Pro00093304).
Report selection and preparation for natural language processing
Our patient registry was filtered with a previously validated algorithm which detects CD with a specificity of >99% and a sensitivity of 99.1%33. This algorithm is based upon the number of IBD-related hospitalizations, physician contacts and ambulatory care contacts within a 2 year timeframe. Importantly for our application, this algorithm does not use information contained in radiology reports. Consequently, there may be some discrepancy between this algorithm and radiology reports regarding IBD diagnosis.
The CTE radiology report inclusion process is depicted in Fig. 3. 2839 CTE reports of patients with CD and controls collected from all healthcare and diagnostic imaging facilities across Alberta (see above for details) were available for analysis after removal of the personally identifiable information using regular expression pattern matching for anonymization. The reports were then reviewed by a clinical expert (DCB) and split into two groups: 1858 reports of CD patients (CTE-positive for CD); and 981 reports without CD (CTE-negative for CD). We randomly selected 981 CTE-positive for CD reports and combined these with the 981 CTE-negative for CD reports to create a balanced dataset of 1962 reports. Table 5 lists the characteristics of patients included in the balanced dataset in detail.

2839 CTE reports of patients with CD and controls collected from all healthcare and diagnostic imaging facilities across Alberta were used for the construction of the CTE dataset used by the machine learning models for CD classification.
The balanced dataset was randomly split into 3 groups: a training group of 1568 reports (80%); a development group of 196 reports (10%); and a test group of 198 reports (10%). The test group of 198 reports contained 96 CTE-positive for CD and 102 CTE-negative for CD reports. Within each report the sections labeled “indication”, “objective findings” and “subjective findings” were extracted, combined, and truncated to 200 words.
Natural language processing classification of CT enterography textual reports
We evaluated two categories of natural language processing (NLP) tools to classify CTE text reports. The first of these, rationale extraction (RE), is targeted towards high interpretability. The second, language modeling (LM), is targeted towards high classification performance. Each is described in turn below.
Rationale extraction to classify CTE reports
A rationale is defined as a span of text extracted from the source document, which provides sufficient evidence for predicting the correct document class. A current best practice in NLP of text uses AI methods to locate rationales, which are intended to identify the most salient components of medical texts. So, rationale extraction identifies text segments as attributes to explain a classifier’s predictions34,35,36,37. The overall process confirms the value of extracted rationales by computing an approximate semantic relationship amongst them, usually by determining their gradient relationships in a predefined text space (e.g., the original vocabulary of the medical texts). That ranking can be used to identify the most important text rationales from any medical text.
Our rationale extraction architecture is described in Fig. 4. It includes an extractor, and a classifier, working jointly: the extractor identifies a subset of text (i.e., a rationale) from the original CTE textual report. The rationale is expected to cover discriminative information for diagnosis. Then the classifier makes a prediction based solely on the extracted information. It’s worth mentioning that a rationale is technically considered to be a faithful explanation since a rationale is the only input used for a neural classifier to make its prediction; faithfulness of an explanation means the explanation is the true basis for the prediction38.
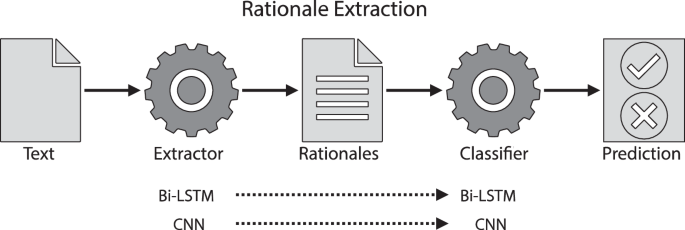
The extractor selects discriminative tokens from a report and the classifier makes a classification solely based on the selected tokens.
We used two neural architectures to implement extractors and classifiers: (1) bi-directional long short-term memory neural networks (Bi-LSTM), i.e., a bi-directional version of LSTM39; and, (2) convolutional neural networks (CNN)40. In each case the neural architecture was used as both the extractor and classifier (Fig. 4). These models were trained with instance-level supervision (i.e., a report used for training was labeled as either “CTE-positive for CD” or “CTE-negative for CD”). The model learned to identify discriminative information from the reports for classification.
The RE training process is summarized as follows34. First, we used the GloVe41 algorithm to “embed” words in each report. Embedding converts text into a numerical representation that preserves meaning and allows computational processing. Briefly, GloVe is a deep neural network that has been trained to learn a set of high-dimensional vectors to represent a pre-specified English vocabulary. GloVe decomposes long words into a set of sub-words or word components called ‘tokens.’ With this approach, unknown words outside the pre-specified vocabulary can be decomposed into a series of known tokens and encoded using GloVe. Each token is mapped onto a unique learned vector containing 100 floating point values. This vector is normalized to have a magnitude of 1.0. Words with similar meanings produce vectors with similar values which tend to cluster in the high dimensional vector space.
Given the embedded tokens of a textual report, the extractor outputs the probability of each token being selected. Subsequently, a mask, with binary values indicating if a token is chosen or not, is applied to the outputs of the extractor (i.e., the probabilities) to create a rationale (i.e., a subset of the original report). Based on that rationale, the classifier labels the report as either “CTE-positive for CD” or “CTE-negative for CD.” Classification errors drive a loss function which is used to adjust trainable parameters in both the extractor and classifier. The loss function is a sum of three terms (each encapsulated in round brackets in Eq. (1)): (1) predictive loss, (2) selection loss, and (3) contiguity loss:
$${loss}\left(z,x,y\right)=\left({\Vert f\left(z,x\right)-y\Vert }_{2}^{2}\right)+\left({\lambda }_{1}\Vert z\Vert \right)+\left({\lambda }_{2}\mathop{\sum }\limits_{i=1}^{l-1}|{z}_{i}-{z}_{i+1}|\right)$$
(1)
In this function, \(x\) is an input textual report of \(l\) tokens, \(z\) is a mask, and y is the ground-truth report label (“CTE-positive for CD” or “CTE-negative for CD”). Furthermore, a rationale is denoted by \(\left(z,x\right)\) meaning the mask over the input, \(f\left(z,x\right)\) is a classification prediction arising from providing the rationale to the classifier \(f\). The hyperparameters \({\lambda }_{1}\) and \({\lambda }_{2}\) are used to tune the length and contiguity of rationales. The predictive loss, the first term in (Eq. (1)), drives the model to select better discriminative rationales and make correct predictions. The selection loss, the second term in (Eq. (1)), and the contiguity loss, the last term in (Eq. (1)), separately encourage the model to select more concise and contiguous rationales, which is intended to improve human interpretability.
The original rationale extraction model, which uses non-differentiable masking for generating rationales, is referred to as REINFORCE34,42. REINFORCE randomly samples many rationales for gradient estimation. This complicates the training process and results in high variance and sensitivity to parameters35. Therefore, we investigated three improved methods for differentiable masking: Gumbel-Softmax43; HardKuma36; and SPECTRA44.
Rationale extraction-guided insights for classification
From the rationales generated by our rationale extraction model, we furthermore discovered strong phrase or word-level indicators which provide straightforward insights for classification. The process of automatically discovering strong indicators is described in Fig. 5.

From the rationales generated by our rationale extraction model, we furthermore discovered strong phrase or word-level indicators which provide straightforward insights for classification.
Given a rationale, we first decomposed it into disjoint phrases or words which can be viewed as potentially strong indicators. By applying the decomposition step for all the reports used for training, we obtained a pool of all indicators (say n of them).
For each indicator \({i}_{k}\) in the pool, two simple rules can be created: if \({i}_{k}\) exists in a report and the report is CTE-positive for CD; or, if \({i}_{k}\) exists in a report and the report is CTE-negative for CD. This gives us a pool of rules (2*n of them). In this combination of discriminatory indicators, each rule makes a classification prediction based on the existence of some indicator. After verifying the rules on the labeled training reports, the predictive performances of all the rules together with their numbers of occurrences in the training reports can be measured. We then selected top indicators by applying a filter on the rules based on their performances and occurrences (i.e., predictive accuracy >80% and occurrences >10 in our experiments).
Rule-based classifier using top indicators
In any rationale extraction model, a classifier makes a prediction by consuming the rationale extracted by its extractor. In our case, we could use only the extracted rationales, but we wanted to demonstrate the potential value of rule-based classifiers constructed from such rationales. Note that if the extractor fails to provide a good rationale that contains important information for some specific report, the classifier may not be capable of making a correct prediction. However, the top indicators might help in cases where a rationale extraction model can fail because the top indicators may be verified to be working well globally in all the training reports.
With that motivation, we also constructed a companion rule-based classifier by using the automatically discovered top indicators from our rationale extraction architecture as shown in Fig. 5. The rule-based algorithm was designed to make predictions by simply comparing the numbers of the occurrences of top indicators for CTE-positive for CD and CTE-negative for CD (e.g., if a report contained more top indicators for CTE-positive for CD than CTE-negative for CD, the report is predicted as CTE-positive). Formally, given the collections of top indicators separately for CTE-positive and CTE-negative (say \({I}^{+},{I}^{-}\)) and an input report \(x\), we have:
$$h\left(x,{I}^{+},{I}^{-}\right)=\sum _{i\in {I}^{+}}\delta \left(i,x\right)-\sum _{i\in {I}^{-}}\delta \left(i,x\right)$$
(2)
where \(\delta \left(i,x\right)\) is a binary value denoting the existence of indicator \(i\) in report \(x\) (i.e., \(\delta \left(i,x\right)=1\) if \(i\) is in \(x\); \(\delta \left(i,x\right)=0\) if \(i\) is not in \(x\)). The final prediction is defined by the conditional function
$${pred}(x,{I}^{+},{I}^{-})=\left\{{CD},h\left(x,{I}^{+},{I}^{-}\right) > 0\,{not}\; {CD},h\left(x,{I}^{+},{I}^{-}\right) < 0 \right.$$
(3)
In the cases where this algorithm does not apply (i.e., \(h\left(x,{I}^{+},{I}^{-}\right)=0\)), we assumed the original rationale extraction model’s predictions, i.e., the machine learning-based rationale extraction model’s rationale will be used for explanation. If \(h\left(x,{I}^{+},{I}^{-}\right)\) is not 0, we use the existing indicators that contribute to the final prediction as an explanation.
Rationale extraction model implementation and training details
Our CNN used filter sizes of [3,4,5] and 100 filters were used for each filter size. Bi-LSTM had 1 recurrent layer and a hidden dimension of 32. For both CNN and Bi-LSTM, the number of training epochs was 30; the dropout rate was set to be 0.2; the batch size was 128; Adam45 was used as the optimizer with a weight decay rate of 5e–6 and a learning rate of 1e-3. GloVe of 100-dimensional word embedding was used41. Gumbel-Softmax was used as differentiable masking to simplify gradient computation. The initial Gumbel temperature was set to 1 with a decay rate of 1e–5. These parameters were used for both the extractor and classifier components of the RE pipeline. Model accuracy was evaluated on the developing dataset at the end of each epoch. The highest performing model on this dataset was saved for further use.
Large language models for classification of CTE reports
In addition to RE methods, we also evaluated three language models (LMs) based on the BERT (Bidirectional Encoder Representations from Transformers Model)46 architecture. These included: (1) DistilBERT47, a distilled version of BERT; (2) BioClinicalBERT18, a biomedical domain specific variant; and, (3) IBDBERT, a new inflammatory bowel disease -specific LM we created. Of note, a domain can be a field, i.e. biomedical research or healthcare, a disease (i.e. Crohn’s disease) or a group of diseases (i.e. cancer or IBD). We developed IBDBERT to investigate the impact on classification performance from training on a comparatively small corpus of subject matter expert knowledge.
BERT is one of the first LMs that uses the encoder from the original transformer model48. It has been widely adopted in medicine for domain-specific pre-training (e.g., MedBERT17, BioClinicalBert18, CancerBERT19, and BEHRT20) and related text classification tasks49,50. A BERT model can be augmented by using an unlabeled corpus via a masked language modeling (MLM) process. This is implemented by augmenting the model with texts containing 15% of randomly masked words and then, based on how well the model predicts the masked words, adjusting the appropriate weights within the model. The task of predicting a masked word is implemented as a classification process over the whole BERT vocabulary (i.e., around 30,000 words for the original BERT). Cross entropy is used as prediction loss to refine the accuracy of the BERT network. Note – this process is self-supervised and does not require human intervention. Therefore, large training corpora can be used (e.g., the original BERT was trained on BookCorpus51 and English Wikipedia). Pre-training forces the model to learn the syntax, structure, and specific vocabularies of domain-specific documents. Once pre-training is completed, a second stage of training is typically performed to tune the model for a specific task, such as question answering, or document classification. The second stage often uses a smaller set of data labeled by human experts. Our process of developing IBDBERT, which covers the pretraining and the fine-tuning steps, can be found in Fig. 6.

Pretraining with the corpus on IBD knowledge and finetuning with CTE reports.
Development of an inflammatory bowel disease domain specific large language model—IBDBERT
IBDBERT was developed by augmenting the original BERT via pre-training with a text corpus that included two multi-author IBD textbooks2,52 and leading professional society guidelines (i.e., American Gastroenterological Association (AGA), American College of Gastroenterology (ACG) and European Crohn’s and Colitis Organization (ECCO) consensus guidelines)11,12,53,54,55,56,57,58,59,60,61,62,63,64,65,66,67,68,69,70,71,72. The purpose of the augmentation was to extend the original BERT model with IBD-related language and knowledge without diminishing the general language understanding captured by the original BERT.
BERT implementation and training details
The structural designs of BERT models, encompassing BERT (specifically, bert-base-uncased), DistilBERT, and BioClinicalBERT, were employed in their publicly released versions and standard configurations, using those settings for dropout probabilities, attention heads, and vocabulary dimensions. During the classification training of these BERT models (the fine-tuning process), a batch size of 8 was used, with the Adam algorithm equipped with standard parameters serving as the optimizer, and a specified learning rate of 1e–5. The BERT models can be accessed by using the respective model names at https://huggingface.co.
In the context of pretraining IBDBERT via masked language modeling, a block size of 256 and a batch size of 8 were adopted, signifying that each block contained 256 tokens as input and each batch comprised of 8 blocks. For masked language modeling, where chosen words were replaced with a [MASK] token, the likelihood of any given word being masked was set at 15%, indicating that, on average, 15% of the tokens in each 256-token block were masked.
IBDBERT MLM pre-training was conducted with 7 different learning rates (LRs): [1e–6, 5e–6, 1e–5, 2e–5, 3e–5, 4e–5, 5e–5]. For each LR, MLM was repeated 5 times, each with a different random selection of masked words. Classification fine-tuning was then repeated 5 times, each with a different initial random initialization of weights. A total of 175 training runs were performed: 7 different LRs x 5 random MLM initializations x 5 repeated classification tunings. The upper limit for steps in each pre-training iteration was set at 5000. All remaining parameters adhered to their default settings. The coding for MLM was adapted from the publicly accessible Hugging Face repository.
When each training epoch finished, the cross-entropy loss of the model on the developing dataset was computed for predictive performance. The version of the model among the training epochs that achieved the best performance was selected as the final version. This was then used for inference on the testing dataset to calculate its predictive performance.
Comparison of IBDBERT to two more recent LLMs
To evaluate the potential superiority of more recent, general-purpose LLMs, we used Meta LLaMA-3.3-70B-Instruct and DeepSeek-R1-Distill-LLaMA-70B Both models were used off the shelf (i.e., without fine-tuning) and deployed locally in 16-bit precision. They were set to output a maximum 500 and 1000 tokens, respectively, and took approximately 1 and 2 h to process the 198 test cases. In our observations, DeepSeek-R1 tended to generate lengthy ‘thinking’ processes, which required a higher number of maximum output token limit. Each experiment was repeated twice for improved reliability. After multiple rounds of incremental and extensive prompt engineering to enhance predictive performance on the training data, we selected the following prompt for the test data: Does this patient have Crohn’s disease? Answer “Yes” if the patient has a history of Crohn’s or if this study includes evidence of active or inactive Crohn’s disease. The correct answer is “No” if Crohn’s disease was suspected but not confirmed. Provide your answer on a line by itself. Then provide a short justification for this conclusion.
Statistical analysis
R 4.2.3 and RStudio (Posit Inc., Boston, MA, USA) were used for descriptive and exploratory analysis of demographic variables73. Pearson Chi-squared analysis was done for categorical demographic variables. Frequency distributions of categories were tabulated and differences in distributions were compared across subgroups using the χ 2 test. P-values were reported using the null hypothesis of no difference in frequency distribution with 95% confidence interval. Median and interquartile range (IQR) were calculated for continuous variables and compared using the Mood’s Median test.
Natural language processing models were built using torch 2.0.0 and transformers 4.28.1 in Python 3.8.10. Four GPUs of NVIDIA (Santa Clara, CA, USA) A100-SXM4-80GB with CUDA 11.8 were used for training the BERT neural network. Inference with Meta LLaMA (Meta, Menlo Park, CA, USA) and DeepSeek (DeepSeek-AI, Hangzhou, Zhejiang, China) was performed locally on two A100 80GB GPUs. Results are reported as averages and standard deviations across repeated runs. Models’ performance was evaluated using accuracy, recall, precision, and F1-scores. As a binary classification problem, AUROC values and ROC curves were used to compare and visualize model performance where applicable.
Data availability
Due to local legislation and the nature of the research, the health dataset used in this research cannot be released. However, reasonable inquiries for aggregate data or additional details can be made.
Code availability
Code for data preprocessing and statistical analysis is available upon reasonable request.
References
Baumgart, D. C. et al. Crohn’s disease. Lancet 380, 1590–1605 (2012).
Baumgart, D.C. ed. Crohn's Disease and Ulcerative Colitis From Epidemiology and Immunobiology to a Rational Diagnostic and Therapeutic Approach. (Springer Nature, 2017). https://doi.org/10.1007/978-3-319-33703-6.
Lloyd-Price, J. et al. Multi-omics of the gut microbial ecosystem in inflammatory bowel diseases. Nature 569, 655–662 (2019).
Graham, D. B. et al. Pathway paradigms revealed from the genetics of inflammatory bowel disease. Nature 578, 527–539 (2020).
Baumgart, D. C. et al. Newer biologic and small-molecule therapies for inflammatory bowel disease. N. Engl. J. Med. 385, 1302–1315 (2021).
Rogler, G. et al. Extraintestinal manifestations of inflammatory bowel disease: Current concepts, treatment, and implications for disease management. Gastroenterology 161, 1118–1132 (2021).
Hedin, C. R. H. et al. The pathogenesis of extraintestinal manifestations: Implications for IBD research, diagnosis, and therapy. J. Crohns Colitis 13, 541–554 (2019).
Baumgart, D. C. et al. Network analysis of extraintestinal manifestations and associated autoimmune disorders in Crohn's disease and ulcerative colitis. Nat. Digit Med 8, 209 (2025).
Benchimol, E. I. et al. Rural and urban disparities in the care of Canadian patients with inflammatory bowel disease: A population-based study. Clin. Epidemiol. 10, 1613–1626 (2018).
Turner, D. et al. STRIDE-II: An update on the selecting therapeutic targets in inflammatory bowel disease (STRIDE) initiative of the international organization for the study of IBD (IOIBD): Determining therapeutic goals for treat-to-target strategies in IBD. Gastroenterology 160, 1570–1583 (2021).
Sturm, A. et al. ECCO-ESGAR guideline for diagnostic assessment in IBD Part 2: IBD scores and general principles and technical aspects. J. Crohns Colitis 13, 273–284 (2019).
Maaser, C. et al. ECCO-ESGAR guideline for diagnostic assessment in IBD Part 1: Initial diagnosis, monitoring of known IBD, detection of complications. J. Crohns Colitis 13, 144–164 (2019).
Fletcher, J. G. Computed Tomography Enterography and Inflammatory Bowel Disease. In: Baumgart, D. C. (eds) Crohn's Disease and Ulcerative Colitis. (Springer Nature, 2017). https://doi.org/10.1007/978-3-319-33703-6_19.
Taylor, N. et al. Rationale production to support clinical decision-making. ArXiv abs/2111.07611 (2021). https://doi.org/10.48550/arXiv.2111.07611.
Sha, L. et al. Learning from the best: Rationalizing predictions by adversarial information calibration. Proc. AAAI Conf. Artif. Intell. 35, 13771–13779 (2021).
Hugging Face: Code for masked language modeling for BERT models: https://huggingface.co/docs/transformers/main/en/tasks/masked_language_modeling.
Rasmy, L. et al. Med-BERT: Pretrained contextualized embeddings on large-scale structured electronic health records for disease prediction. Nat. Digit. Med. 4, 86 (2021).
Alsentzer, E. et al. Publicly Available Clinical BERT Embeddings. In Proceedings of the 2nd Clinical Natural Language Processing Workshop, pp 72–78, Minneapolis, Minnesota, USA, Association for Computational Linguistics, (2019). https://doi.org/10.18653/v1/W19-1909.
Mitchell, J. R. et al. A question-and-answer system to extract data from free-text oncological pathology reports (CancerBERT Network): Development study. J. Med. Internet Res. 24, e27210 (2022).
Li, Y. et al. BEHRT: Transformer for electronic health records. Sci. Rep. 10, 7155 (2020).
Johnson, A. E. W. et al. MIMIC-III, a freely accessible critical care database. Sci. Data 3, 160035 (2016).
Herrett, E. et al. Data resource profile: Clinical practice research datalink (CPRD). Int J. Epidemiol. 44, 827–836 (2015).
Stidham, R. W. & Takenaka, K. Artificial Intelligence for Disease Assessment in Inflammatory Bowel Disease: How Will it Change Our Practice? Gastroenterology 162, 1493–1506 (2022).
Stidham, R. W. et al. Identifying the presence, activity, and status of extraintestinal manifestations of inflammatory bowel disease using natural language processing of clinical notes. Inflamm. Bowel Dis. 29, 503–510 (2023).
Luke, M. et al. P126 Phenotypic characterisation of suspected small bowel Crohn’s disease with natural language processing of MRE reports. Gut 70, A107.2–A108 (2021).
Baumgart, D. C. An intriguing vision for transatlantic collaborative health data use and artificial intelligence development. Nat. Digit. Med. 7, 19 (2024).
Sutton, R. T. et al. An overview of clinical decision support systems: benefits, risks, and strategies for success. Nat. Digit. Med. 3, 17 (2020).
Baumgart, D. C. Personal digital assistants in health care: experienced clinicians in the palm of your hand? Lancet 366, 1210–1222 (2005).
Kim, M.-Y. et al. A multi-component framework for the analysis and design of explainable artificial intelligence. Mach. Learn. Knowl. Extr. 3, https://doi.org/10.3390/make3040045 (2021).
Kuling, G., Curpen, B. & Martel, A. L. BI-RADS BERT and using section segmentation to understand radiology reports. J. Imaging 8, 131 (2022).
Statsitics Canada. https://www.statcan.gc.ca/en/start (2021).
Baumgart, D. C. Digital advantage in the COVID-19 response: Perspective from Canada’s largest integrated digitalized healthcare system. Nat. Digit. Med 3, 114 (2020).
Rezaie, A. et al. Development and validation of an administrative case definition for inflammatory bowel diseases. Can. J. Gastroenterol. 26, 711–717 (2012).
Lei, T. et al. Rationalizing Neural Predictions. In Proceedings of the 2016 Conference on Empirical Methods in Natural Language Processing, pp 107–117, Austin, Texas, Association for Computational Linguistics. https://doi.org/10.18653/v1/D16-1011 (2016).
Jain, S. et al. Learning to Faithfully Rationalize by Construction. In Proceedings of the 58th Annual Meeting of the Association for Computational Linguistics, pp 4459–4473, Online. Association for Computational Linguistics. https://doi.org/10.18653/v1/2020.acl-main.409 (2020).
Bastings, J. et al. Interpretable Neural Predictions with Differentiable Binary Variables. In Proceedings of the 57th Annual Meeting of the Association for Computational Linguistics, pp 2963–2977, Florence, Italy, Association for Computational Linguistics. https://doi.org/10.18653/v1/P19-1284 (2019).
Paranjape, B. et al. An Information Bottleneck Approach for Controlling Conciseness in Rationale Extraction. In Proceedings of the 2020 Conference on Empirical Methods in Natural Language Processing (EMNLP), pp 1938–1952, Online. Association for Computational Linguistics. https://doi.org/10.18653/v1/2020.emnlp-main.153 (2022).
Lipton, Z. C. The Mythos of Model Interpretability. Queue 16, 31–57 (2016).
Hochreiter, S. et al. Long Short-Term Memory. Neural Comput. 9, 1735–1780 (1997).
Kim, Y. Convolutional Neural Networks for Sentence Classification. In Proceedings of the 2014 Conference on Empirical Methods in Natural Language Processing (EMNLP), pp 1746–1751, Doha, Qatar, Association for Computational Linguistics. https://doi.org/10.3115/v1/D14-1181 (2014).
Pennington, J. et al. GloVe: Global Vectors for Word Representation. In Proceedings of the 2014 Conference on Empirical Methods in Natural Language Processing (EMNLP), pp 1532–1543, Doha, Qatar, Association for Computational Linguistics. https://doi.org/10.3115/v1/D14-1162 (2014).
Williams, R. J. Simple statistical gradient-following algorithms for connectionist reinforcement learning. Mach. Learn. 8, 229–256 (1992).
Jang, E. et al, Categorical Reparameterization with Gumbel-Softmax. ArXiv abs/1611.01144, https://doi.org/10.48550/arXiv.1611.01144 (2016).
Guerreiro, N. M. & Martins, A. F. T. SPECTRA: Sparse Structured Text Rationalization. ArXiv abs/2109.04552, https://doi.org/10.48550/arXiv.2109.04552 (2021).
Kingma, D. P. & Ba, J. Adam: A Method for Stochastic Optimization. CoRR abs/1412.6980, https://doi.org/10.48550/arXiv.1412.6980 (2014) .
Devlin, L. et al. BERT: Pre-training of Deep Bidirectional Transformers for Language Understanding. In Proceedings of the 2019 Conference of the North American Chapter of the Association for Computational Linguistics: Human Language Technologies, Vol 1 (Long and Short Papers), pp 4171–4186, Minneapolis, Minnesota, Association for Computational Linguistics. https://doi.org/10.18653/v1/N19-1423 (2019).
Sanh, V. et al. DistilBERT, a distilled version of BERT: smaller, faster, cheaper and lighter arXiv abs/1910.01108v4: https://doi.org/10.48550/arXiv.1910.01108.
Vaswani, A. et al. arXiv: abs/1706.03762v7, https://doi.org/10.48550/arXiv.1706.03762.
Wu, Y. et al. BERT-based natural language processing of drug labeling documents: A case study for classifying drug-induced liver injury risk. Front Artif. Intell. 4, 729834 (2021).
Khadhraoui, M. et al. BERT-Base Models for Scientific Text Classification: COVID-19 Case Study. Appl. Sci. 12, 2891 (2022).
Zhu, Y. et al. Aligning books and movies: Towards story-like visual explanations by watching movies and reading books. IEEE Int. Conf. Comput. Vis. (ICCV) 2015, 19–27 (2015).
Baumgart, D. C. ed. Crohn's Disease and Ulcerative Colitis From Epidemiology and Immunobiology to a Rational Diagnostic and Therapeutic Approach. (Springer Nature, 2012). https://doi.org/10.1007/978-1-4614-0998-4.
Kucharzik, T. et al. ECCO-ESGAR topical review on optimizing reporting for cross-sectional imaging in inflammatory bowel disease. J. Crohn’s. Colitis 16, 523–543 (2022).
Brandt, L. J. et al. ACG clinical guideline: Epidemiology, risk factors, patterns of presentation, diagnosis, and management of colon ischemia (CI). Am. J. Gastroenterol. 110, 18–44 (2015).
Farraye, F. A. et al. ACG clinical guideline: preventive care in inflammatory bowel disease. Am. J. Gastroenterol. 112, 241–258 (2017).
Gerson, L. B., Fidler, J. L., Cave, D. R. & Leighton, J. A. ACG clinical guideline: diagnosis and management of small bowel bleeding. Am. J. Gastroenterol. 110, 1265–1287 (2015).
Lacy, B. E. et al. ACG clinical guideline: Management of irritable bowel syndrome. Am. J. Gastroenterol. 116, 17–44 (2021).
Lichtenstein, G. R. et al. ACG clinical guideline: Management of Crohn’s disease in adults. Am. J. Gastroenterol. 113, 481–517 (2018).
Lindor, K. D. et al. Clinical guideline: Primary sclerosing cholangitis. Am. J. Gastroenterol. 110, 646–659 (2015).
Pimentel, M. et al. ACG clinical guideline: Small intestinal bacterial overgrowth. Am. J. Gastroenterol. 115, 165–178 (2020).
Rubin, D. T. et al. ACG clinical guideline: Ulcerative colitis in adults. Am. J. Gastroenterol. 114, 384–413 (2019).
Strate, L. L. et al. ACG clinical guideline: Management of patients with acute lower gastrointestinal bleeding. Am. J. Gastroenterol. 111, 459–474 (2016).
Johnson, D. A. et al. Optimizing adequacy of bowel cleansing for colonoscopy: recommendations from the US multi-society task force on colorectal cancer. Gastroenterology 147, 903–924 (2014).
Adamina, M. et al. ECCO guidelines on therapeutics in Crohn’s Disease: Surgical treatment. J. Crohn’s. Colitis 14, 155–168 (2020).
van Rheenen, P. F. et al. The medical management of paediatric Crohn’s disease: An ECCO-ESPGHAN guideline update. J. Crohns Colitis 7, jjaa161 (2020). Online ahead of print.
Kucharzik, T. et al. ECCO guidelines on the prevention, diagnosis, and management of infections in inflammatory bowel disease. J. Crohns Colitis 15, 879–913 (2021).
Raine, T. et al. ECCO guidelines on therapeutics in ulcerative colitis: Medical treatment. J. Crohn’s. Colitis 16, 2–17 (2022).
Spinelli, A. et al. ECCO guidelines on therapeutics in ulcerative colitis: Surgical treatment. J. Crohns Colitis 16, 179–189 (2022).
Torres, J. et al. ECCO guidelines on therapeutics in Crohn’s disease: Medical treatment. J. Crohn’s. Colitis 14, 4–22 (2020).
Sengupta, N. et al. Management of patients with acute lower gastrointestinal bleeding: An updated ACG guideline. Am. J. Gastroenterol. 118, 208–231 (2023).
Torres, J. et al. European Crohn’s and Colitis guidelines on sexuality, fertility, pregnancy, and lactation. J. Crohn’s. Colitis 17, 1–27 (2023).
Kemp, K. et al. Second N-ECCO consensus statements on the european nursing roles in caring for patients with Crohn’s disease or ulcerative colitis. J. Crohn’s. Colitis 12, 760–776 (2018).
R Development Core Team (2010) R: A Language and Environment for Statistical Computing. R Foundation for Statistical Computing, Vienna, Austria. http://www.R-project.org.
Norgeot, B. et al. Minimum information about clinical artificial intelligence modeling: The MI-CLAIM checklist. Nat. Med. 26, 1320–1324 (2020).
Acknowledgements
This work has been supported by research grants from the University of Alberta, Alberta Health Services, the Canadian Institute for Advanced Research (CIFAR), the Canadian Institutes of Health Research (CIHR) Canada Vanier Program, the National Sciences and Engineering Council of Canada (NSERC) [DGECR-2022-00369, RGPIN-2022-0346, 565078-2022], Mathematics of Information Technology and Complex Systems (Mitacs), the Alberta Machine Intelligence Institute (Amii), University Hospital Foundation and Alberta Innovates including the Health Innovation Platform Partnership Program (HIPP). This work is part of the International Collaborative Research and Training Experience (NSERC CREATE) “From Data to Decision (FD2D)—Digital Transformation and Artificial Intelligence from Data Value Chain to Human Value” (https://fd2d.org) led by DCB.
Ethics declarations
Competing interests
D.C.B. is a deputy editor of this journal. He was not involved in the editorial processor or decision making of this manuscript. The authors declare no competing interests.
Additional information
Publisher’s note Springer Nature remains neutral with regard to jurisdictional claims in published maps and institutional affiliations.
Supplementary information
Rights and permissions
Open Access This article is licensed under a Creative Commons Attribution-NonCommercial-NoDerivatives 4.0 International License, which permits any non-commercial use, sharing, distribution and reproduction in any medium or format, as long as you give appropriate credit to the original author(s) and the source, provide a link to the Creative Commons licence, and indicate if you modified the licensed material. You do not have permission under this licence to share adapted material derived from this article or parts of it. The images or other third party material in this article are included in the article’s Creative Commons licence, unless indicated otherwise in a credit line to the material. If material is not included in the article’s Creative Commons licence and your intended use is not permitted by statutory regulation or exceeds the permitted use, you will need to obtain permission directly from the copyright holder. To view a copy of this licence, visit http://creativecommons.org/licenses/by-nc-nd/4.0/.
About this article

Cite this article
Dai, J., Kim, MY., Sutton, R.T. et al. Comparative analysis of natural language processing methodologies for classifying computed tomography enterography reports in Crohn’s disease patients. npj Digit. Med. 8, 324 (2025). https://doi.org/10.1038/s41746-025-01729-5
Received:
Accepted:
Published:
DOI: https://doi.org/10.1038/s41746-025-01729-5