
An adaptive AI-based virtual reality sports system for adolescents with excess body weight: a randomized controlled trial
作者:Li, Huating
Main
Adolescent obesity has become a global public health crisis with the prevalence rising rapidly1. Obesity during adolescence increases the risk of cardiometabolic disorders and enduring cognitive changes2. Moreover, adolescent brains are particularly vulnerable to obesity-related cognitive impairments, potentially affecting executive functions like working memory3. Although physical activity is a first-line treatment4, barriers like low sports motivation, adverse peer experiences5 and limited access to personalized coaching6 restrict adolescents’ willingness to engage in physical activity and actual engagement. Thus, safe and empathetic sports interventions are crucial for encouraging adolescents with obesity to engage in physical activities, offering substantial health benefits7.
Virtual reality (VR), which immerses users in a computer-generated, interactive environment8, has been applied to address healthcare challenges, including neurological assessment9 and medical training10. However, most existing VR sports systems offer one-size-fits-all experiences11, and are not tailored to meet the requirements of adolescents with excess body weight. Meanwhile, there are few rigorous randomized controlled trials (RCTs) validating the effectiveness of VR therapy12. In addition, the differential impacts of VR-based versus real-world physical sports on adolescents and the underlying mechanisms have yet to be investigated.
To address these gaps, we developed the REVERIE system, a VR sports system designed for adolescents, whose Chinese name is ‘Lingjing’. We proposed a two-stage, template-driven and feedback-oriented, deep reinforcement learning strategy to empower transformer-based virtual coaching agents in the REVERIE system, which guided users to learn soccer and table tennis techniques through empathetic guidance. This strategy involved initially training virtual coaching agents with the coaching templates before deployment, followed by continuous optimization through interactive sessions with adolescents after deployment. The VR sports environment and the coaching templates were iteratively refined by incorporating insights from a panel of expert coaches. Comparative experiments and a pilot user study were conducted to evaluate the immersion, safety and performance of the REVERIE system.
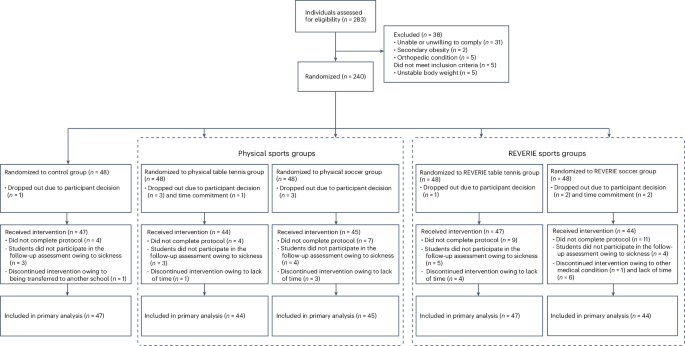
Our study further evaluated the efficacy of the REVERIE system as a sports intervention tool tailored for adolescents. We conducted an RCT (ChiCTR2300068786)13 involving 227 adolescents with excess body weight (Figs. 1 and 2). We compared the metabolic, physical, psychological and cognitive outcomes of the REVERIE sports (VR sports) group versus the control group, as well as the physical sports (real-world physical sports) group versus the control group. A comparison between the REVERIE sports and physical sports groups was also performed in an exploratory manner. Functional magnetic resonance imaging (fMRI) was used to investigate neuroplasticity patterns, including neural activation and functional connectivity across groups. Multi-omics analyses were also conducted to provide comprehensive insights into participants’ distinct biological responses to REVERIE and physical sports. Our evidence-based study demonstrates that the REVERIE sports system holds promise as an empathetic solution to address the challenges of physical inactivity and obesity among adolescents and may suggest the underlying mechanisms of VR sports.

Study flow diagram. CONSORT, Consolidated Standards of Reporting Trials.

a, Schematic of REVERIE system development and system evaluation. Professional coaches provide feedback to build the VR sports environment and coach templates. A transformer-based virtual coaching agent, REVERIE Coach, is trained to guide adolescents. Participants engage in table tennis or soccer using VR equipment and sport-specific controllers, performing guided motions with REVERIE Coach instruction. AI–human interactions during VR therapy are used to adaptively optimize REVERIE Coach through deep reinforcement learning. This strategy addresses challenges of participants during VR sports interventions, enabling empathetic sports interventions. System evaluations demonstrate that the REVERIE system delivers an immersive VR sports experience with minimal cybersickness, biomechanical performance comparable to real-world sports and an AI–human collaborative coaching tool. b, Design of the RCT. In this RCT, 227 adolescents with excess body weight were randomly allocated into the physical sports group, the REVERIE sports group or the control group. Both sports groups contained two sport types including table tennis and soccer. The effects of interventions were assessed in terms of metabolic, physical, psychological and cognitive outcomes. Meanwhile, fMRI and multi-omics analyses (including metagenomics, metabolomics, lipidomics and proteomics) were conducted.
Results
System overview and evaluation
We developed a VR sports system named REVERIE, powered by deep reinforcement learning, combining sports expert knowledge with AI-driven personalization to provide deeply empathetic sports technique instructions for adolescents with excess body weight (Fig. 2a). The system comprises four modules: (1) the REVERIE-Environment module (module I), which integrates expertise from a professional coaching panel to create the VR sports environment and coaching template (Supplementary Fig. 1); (2) the REVERIE-Rendering module (module II), in which a sports-oriented deep immersive rendering neural network is designed to render the VR sports scene while reducing cybersickness (Supplementary Fig. 2); (3) the REVERIE-Agent module (module III), in which a two-stage, template-driven and feedback-oriented deep reinforcement learning technique is proposed with a digital twin stage and an AI–human interaction stage, enabling the REVERIE Coach for empathetic sports technique guidance (Extended Data Fig. 1); and (4) the REVERIE-Assistance module (module IV), which supports human coaches in optimizing instruction schedules based on adolescents’ training data within REVERIE (Supplementary Fig. 3). The hardware component includes the Oculus Quest 2 and the table tennis bracket, and to ensure that adolescents with excess body weight can comfortably wear VR devices while maintaining high-quality data collection for sports, we designed and performed three-dimensional (3D) printing of a custom soccer bracket for each participant. Additionally, we integrated a wireless heart rate telemetry sensor to support VR sports interventions (Supplementary Fig. 4).
Comparative experiments and a pilot user study demonstrated that the REVERIE system could attain moderate-to-high exercise intensities14, provide safe, immersive and effective sports guidance, and reach biomechanical performance comparable to that of real-world physical sports (Extended Data Fig. 2 and Supplementary Figs. 5 and 6), demonstrating its capability to achieve comparable effects in promoting physical activity among adolescents.
RCT for the REVERIE system
From 1 March 2023 to 1 May 2023, a total of 240 adolescents with excess body weight (mean age 14.24 ± 1.77 years; 162 boys, 78 girls) who met the eligibility criteria were enrolled in our study (ChiCTR2300068786). Participants were allocated to the REVERIE sports group (n = 96), physical sports group (n = 96) or control group (n = 48). Both sports groups contained two types of sports: table tennis and soccer. Baseline characteristics of participants were balanced across groups (Table 1). The primary analysis was performed based on the modified intention-to-treat population, including participants with at least one baseline observation (Fig. 1). Participants in the sports intervention groups attended three additional 45-min classes per week, while the control group maintained regular physical education (PE) lessons (Fig. 2b). The average heart rate and exercise intensity were maintained consistently in the physical and REVERIE sports groups during classes (Extended Data Fig. 3a,b). The intervention lasted for 8 weeks, during which all participants followed nutritionist-recommended meal plans (Supplementary Table 1). There was no difference in sports intervention compliance between physical and REVERIE sports groups, with the median of both groups over 90% (Extended Data Fig. 3c). Similarly, no significant difference was found in the adherence to diet (Extended Data Fig. 3d). There were no significant changes in eye diopters after both sports interventions (Supplementary Table 2). The sports-related injuries occurring during interventions were all minimal injuries15. The average recovery time for these injuries was 1.86 ± 0.90 days for the REVERIE group and 1.67 ± 0.89 days for the physical sports group. Minimal injuries were reported in 7 (7.69%) participants in the REVERIE group and 12 (13.48%) participants in the physical sports group. No serious adverse events were reported. Full trial details are available in the published protocol13 and Supplementary Information.
For the primary outcome, fat mass was significantly decreased after an 8-week physical and REVERIE sports intervention and the net absolute changes relative to the control group were −5.06 kg (95% CI −7.13 kg to −2.98 kg, P < 0.001) and −4.28 kg (95% CI −6.35 kg to −2.22 kg, P < 0.001), respectively (Table 2 and Extended Data Fig. 3).
For secondary outcomes, regarding other metabolic evaluations, the body weight was significantly decreased after 8-week physical and REVERIE sports interventions, and the net absolute changes relative to the control group were −3.93 kg (95% CI −6.61 kg to −1.24 kg, P = 0.001) and −3.41 kg (95% CI −6.09 kg to −0.74 kg, P = 0.002), respectively. No significant changes in body weight were observed in the control group. Compared to the control group, both sports intervention groups showed significant increases in fat-free mass percentage. Similarly, both sports intervention groups showed significant reductions in alanine aminotransferase (ALT), gamma-glutamyl transferase (GGT) and low-density lipoprotein cholesterol (LDL-C) levels compared with the control group. The changes in triglyceride (TG) levels were significantly greater in the REVERIE sports group than in the physical sports group (Table 2 and Extended Data Fig. 3). In both REVERIE sport types, significant improvements in metabolic outcomes were observed relative to the control group (Supplementary Fig. 7). In general, these findings indicate that REVERIE sports interventions can obtain metabolic benefits in adolescents with overweight and obesity, with no significant difference compared to the physical sports group.
For sports-related and psychological outcomes, compared to the control group, the REVERIE group and the physical sports group both demonstrated significant improvements across all physical fitness parameters (all P < 0.05; Table 2). Besides, psychological assessments revealed substantial enhancements in self-efficacy, self-esteem, well-being, sleeping quality and eating behavior among participants in both sports groups (all P < 0.05). Sports willingness, an evaluation based on the physical activity guideline of the WHO (World Health Organization)14, increased significantly in both the physical and REVERIE sports groups, with REVERIE showing a greater increase than the physical sports group (mean 0.96 (95% CI 0.44 to 1.49); Table 2).
Notably, at a 6-month follow-up after the end of the intervention, the REVERIE sports group maintained significant improvements in standing long jump performance, self-efficacy, self-esteem, well-being, sleeping quality, eating behavior and sports willingness compared to the physical sports group (all P < 0.05; Extended Data Fig. 4). These results suggest that the REVERIE sports intervention still had impacts on the physical fitness, psychological well-being and sports willingness of adolescents with excess body weight at the 6-month follow-up.
For cognition-related outcomes, we evaluated olfactory measures and indicators derived from behavioral paradigms. Olfactory impairment could serve as an early indicator of cognitive decline16. Compared to the control group, the olfactory threshold, identification and overall score of threshold, discrimination and identification (TDI) were significantly increased after the REVERIE sports intervention, which was absent after the physical sports intervention (Table 2 and Extended Data Fig. 5). Specifically, the REVERIE sports group exhibited a significantly greater improvement in TDI score (mean 2.84 (95% CI 1.15 to 4.53)), compared to the physical sports group. The n-back task of behavioral experiments reflects working memory. Reaction times of n-back were significantly shortened following both sports interventions compared to the control group. In the 0-back and 1-back working memory tasks, none of the three groups showed significant changes in the accuracy of the behavioral measures. As working memory demands intensified, the REVERIE sports group demonstrated a significant improvement in 2-back accuracy (mean 10.88% (95% CI 1.19% to 20.56%)), compared to the physical sports group (Table 2 and Extended Data Fig. 5). In both REVERIE sport types, significant improvements in olfactory function and reaction time under higher working memory load were observed relative to the control group (Supplementary Fig. 8). These results indicated that the REVERIE sports intervention may have potential benefits on enhancing cognitive function beyond the physical sports.
In summary, both physical and REVERIE sports alleviated excess adiposity and improved metabolic outcomes, and REVERIE sports could offer potential benefits for enhancing cognitive function beyond physical sports. At the 6-month follow-up, REVERIE sports still demonstrated impacts on physical fitness, psychological well-being and sports willingness.
Neural alterations evaluated by fMRI
To further investigate the underlying neurological mechanisms, we assessed brain activation patterns in adolescents with excess body weight during working memory tasks, comparing responses between REVERIE sports and physical sports interventions using fMRI. Brain activity was measured during n-back tasks across three working memory load contrasts (1v0, 1-back versus 0-back; 2v1, 2-back versus 1-back; 2v0, 2-back versus 0-back) to capture task-specific activation changes associated with varying cognitive demands. After 8 weeks of intervention, both the physical and the REVERIE sports groups demonstrated significant group-by-time interaction effects in brain activity during the n-back task compared to the control group. The REVERIE sports group exhibited significant differences in brain activity compared with the physical sports group (Supplementary Fig. 9 and Supplementary Table 3).
Within-group changes in brain activation were further analyzed (Fig. 3a and Supplementary Table 4). In the physical sports group, decreased activation in bilateral frontal regions and the right temporal gyrus was observed under low working memory load condition (1v0). However, under higher working memory load conditions (2v1 and 2v0), increased activation was noted in the bilateral putamen and left parietal lobule. In the REVERIE sports group, increased activation was observed in left frontal areas, and decreased activation was observed in right frontal and bilateral superior temporal areas in 1v0. However, in 2v1 and 2v0 conditions, predominantly decreased activation was found in the frontal regions and cingulate areas, particularly in the left superior frontal gyrus, right frontal inferior orbital gyrus, right supplementary motor area and left anterior cingulate cortex. The REVERIE sports intervention induced more extensive correlations across different load conditions and showed a robust correlation between olfactory function and brain region activations, while these were absent in the physical sports group (Supplementary Tables 5 and 6).

a, Activation differences in brain regions in physical and REVERIE sports groups after an 8-week intervention (post-intervention versus pre-intervention conditions), represented by t-values from two-tailed paired Student’s t-tests. Results with cluster size ≥ 20 voxels and P < 0.05 are shown. b, t-statistics of each ROI pair for each PPI variable within each sports group at different task loads, before and after intervention. The y axis represents seed regions, and the x axis represents target regions. Under each task condition, the brain regions along the horizontal and vertical axes are the same, and the ordering is symmetrical along the diagonal from the top left to the bottom right. t-statistics were analyzed using a two-tailed paired Student’s t-test. Significant differences are indicated by white asterisks (*P < 0.05). Red signifies positive t-values, reflecting increased functional connectivity after intervention, while blue signifies negative t-values, reflecting decreased functional connectivity after intervention. n = 43 in physical sports group; n = 40 in REVERIE sports group. L, left; R, right; sup, superior; mid, middle; inf, inferior; ant, anterior; supp, supplementary; tri, triangular; orb, orbital; oper, opercular; COTC, cerebellar–occipital task control; SM, somatomotor.
To further elucidate the neural mechanisms underlying these activation changes, we examined functional connectivity under different working memory loads using psychophysiological interaction (PPI) analysis and then conducted paired Student’s t-tests to assess differences before and after intervention (Fig. 3b). In the REVERIE sports group, during low cognitive load (1v0), we observed significantly decreased functional connectivity primarily within and between regions of the frontoparietal task control (FPTC) network. Within the FPTC network, the left middle orbital frontal area showed decreased coupling with the right middle frontal area, suggesting selective disengagement between frontal executive regions during simple working memory tasks. Notably, the REVERIE sports intervention also modulated connectivity in the limbic system, with changes observed in the left rectus, indicating shifts in emotional and reward processing. As working memory load increased (2v1), the analysis revealed significant reorganization within the FPTC network, particularly between its dorsal and ventral components. Specifically, the left frontal middle region demonstrated decreased connectivity with the left superior parietal area, indicating load-dependent modulation of dorsal frontoparietal circuits during increased cognitive demand. At high cognitive load (2v0), significant alterations in cross-network interactions between the visual network and FPTC were observed, with the left fusiform gyrus showing decreased coupling with the left inferior frontal opercular area, and the right calcarine cortex exhibiting significantly decreased connectivity with orbital frontal regions. The physical sports group demonstrated limited changes in functional connectivity, with a notable increase in connectivity between the left angular gyrus and right middle frontal area, suggesting enhanced integration between regions of the default mode network (DMN) and FPTC network (Fig. 3b). These divergent connectivity patterns may indicate distinct neural mechanisms for cognitive enhancement in the REVERIE beyond the physical sports. These findings from the REVERIE sports group suggest a systematic modulation of visual–executive integration as cognitive demands rise. Notably, the connectivity matrices revealed a hierarchical organization pattern of network interactions, progressing from local FPTC modulation during simple tasks to more distributed cross-network interactions involving visual processing regions during complex operations. Moreover, the REVERIE sports group showed a general trend toward decreased DMN–FPTC connectivity as working memory load intensified (from the 1v0 to the 2v1 condition). In sum, the extensive modulation of brain networks, together with observed activation changes in the REVERIE group, suggests that VR sports could uniquely influence working memory processing, neuroplasticity and functional reorganization.
Multi-omics insights into the effects of VR sports
We performed in-depth multi-omics profiling (lipidomics, metabolomics, proteomics and metagenomics) at baseline and at the end of intervention and characterized the altered signatures in response to the two sports interventions (paired Student’s t-test or Wilcoxon signed-rank test, false discovery rate (FDR) < 0.25; Fig. 4). No significant changes were observed in the control group across the four omics datasets. In contrast, the 8-week sports interventions induced significant molecular or microbial changes with notably varied responses between the physical and the REVERIE sports groups, at the level of both overall profile and specific molecules or gut microorganisms (Fig. 4a, Extended Data Figs. 6 and 7 and Supplementary Tables 7–9).

a, Significant multi-omics changes in response to interventions. Two-tailed paired statistical tests were calculated for each group and divided different changes into six modes (FDR < 0.25). ‘Both-up’ indicates significant increase after both sports interventions. b–d, Heat maps representing changes (V3–V1) before and after the interventions in the lipidome (b), metabolome (c) and proteome (d). Two lipid subclasses (TAGs and DAGs) were further divided into three clusters based on the degree of changes (P = 0.002 for the difference in aliphatic chains of TAGs between cluster 2 and cluster 3). Box plots in b show the median (centerlines), lower/upper quartiles (box limits) and whiskers (the last data points 1.5 times the IQR from the lower or upper quartiles). Comparisons between different TAG subclusters were performed using two-tailed one-way ANOVA followed by a Fisher’s LSD post hoc test. e, Bubble chart of significant changes before and after the intervention in microbial species. In b–d, the colors of the six change modes are the same as those in a. The enrichment analysis of lipid/small metabolite classes and biological processes of proteins is shown in Extended Data Fig. 7a–d, and the FDR of the enrichment analysis is displayed in parentheses to the right of lipid class. f, Correlation network between changed multi-omics signatures and specific brain regions evaluated by fMRI. Node size represents the number of linked edges. The colors of ROI nodes and edges represent the areas that the (linked) ROIs belong to. ROI nodes with black borders indicate significant correlation with cognitive indicators. Lipid signatures are summed into categories. In a–e, a two-tailed paired Student’s t-test (proteome) or a Wilcoxon signed-rank test (lipidome, metabolome and metagenome) was used to assess the significant changes after each intervention. **P < 0.01, ****P < 0.0001; +FDR < 0.25, ++FDR < 0.1, +++FDR < 0.05. The proportion of differential signatures and the proportion of differential molecules in each enriched class/pathway are shown in Supplementary Table 9. Abbreviations of multi-omics molecules are shown in Supplementary Table 13. PC, phosphatidylcholine; LSM. lysosphingomyelin; ADA2, adenosine deaminase 2; GAPDH, glyceraldehyde-3-phosphate dehydrogenase; APOB, apolipoprotein B; NE, norepinephrine; PG, phosphatidylglycerol; 2-iPMA, 2-isopropylmalic acid.
In contrast to limited changes in lipids after physical sports, a variety of lipids including triacylglycerols (TAGs; n = 89, 48.1% of TAGs), diacylglycerols (DAGs; n = 14, 31.1% of DAGs), sphingomyelins (SMs; n = 22, 25.0% of SMs) and ceramides (Cers; n = 6, 18.8% of Cers) were significantly decreased after the REVERIE sports intervention (Fig. 4a,b and Extended Data Fig. 7a). Hierarchical clustering of TAG variation patterns across three groups revealed three different subclusters. TAGs in cluster 1 (C1_TAGs) contained fatty acids with longer aliphatic chains and higher degrees of unsaturation, exhibiting similar trends of change after the physical and the REVERIE sports, while those in cluster 3 (C3_TAGs) showed distinct changes after two sports interventions (Fig. 4b). Besides, a number of sphingolipid species, including ceramide 1-phosphate (Cer1P), dihydroceramide (DhCer) and glycosphingolipids represented by monosialodihexosylganglioside (GM3), were significantly decreased after REVERIE sports (Fig. 4b). Of note, ceramides and GM3 have been associated with metabolic abnormalities in individuals with obesity17 and cognitive functions18.
Regarding the metabolomics, more significant changes (n = 42, 17.0% of total metabolites for analysis) were observed after the REVERIE sports, while only six metabolites were significantly altered after physical sports (five were shared with the REVERIE group; Fig. 4a,c). Significant variations were detected in small metabolites involved in lipid metabolism, such as chenodeoxycholic acid, and acyl-carnitines and 2-hydroxybutanoic and 3-hydroxybutanoic acids (Fig. 4c and Extended Data Fig. 7b). These metabolites were reported to be related to metabolic and neurocognitive health19,20,21.
For the proteome, 47 proteins (5.6% of total proteins for analysis) significantly changed after physical sports, while 12 proteins (1.4% of total proteins for analysis) underwent significant changes after REVERIE sports, with 5 proteins (THBS1, APP, TLN1, TMSB4X, ACTB) decreased after both sports groups (Fig. 4a,d). Proteins upregulated after physical sports were mainly enriched in the hydrogen peroxide catabolic process (CAT, PRDX2) and oxygen transport (HBA1, HBB, HBD), consistent with existing literature22,23, while cell adhesion-related proteins (ICAM1 and ITGA2B) were specifically downregulated only after physical sports (Fig. 4d and Extended Data Fig. 7c,d).
No significant difference in microbiota diversity was observed, despite the trend of an increase in alpha diversity after both sports interventions (Extended Data Fig. 6c–e). Notably, while no species were significantly changed in the physical sports group, 23 microbial species (12.3% of prevalent species) were significantly altered in the REVERIE sports group (Fig. 4a,e). Among them, the 13 species showing increased abundance primarily belong to the Firmicutes phylum, such as Streptococcus thermophilus, a species associated with memory enhancement in mice through neurotransmitter production24. In addition, the 10 REVERIE-decreased microbial species included those previously associated with inflammation or impairment of cognition functions, such as Escherichia coli25, and species from the Klebsiella genus26.
The above analysis showed that signatures of the lipidome, metabolome and gut microbiome were remarkably altered following REVERIE sports, while more significant changes in proteins were found following physical sports. We further performed correlation analysis in an exploratory manner to investigate the possible relationship between changes in multi-omics signatures and the alterations in indicators related to metabolic, physical, mental and cognitive improvement (Extended Data Figs. 8 and 9 and Supplementary Tables 10 and 11). This highlights the complex interplay between exercise and circulating molecules or intestinal microbiota, and reveals different multi-omics underpinning between physical and REVERIE sports-induced benefits. Interestingly, the connections between exercise-induced multi-omics signatures and cognitive improvement, including olfactory function and working memory, were considerably more (48 correlations, P < 0.05) in the REVERIE sports group compared to the physical sports group (13 correlations, P < 0.05; Extended Data Fig. 9a,b and Supplementary Tables 10 and 11). Furthermore, we constructed a correlation network between multi-omics alteration and changes in specific brain regions after REVERIE sports, as evaluated by fMRI (Fig. 4f and Supplementary Table 12). As a whole, most regions of interest (ROIs) that correlated with multi-omics signatures were associated with behavioral indicators, particularly in cognition-related areas such as the frontal lobe, temporal lobe and precuneus. Proteins such as SPP1 and APOE, metabolites such as 2-isopropylmalic acid and 3-phosphoglycerate, lipids such as C1_TAG and fatty acids, and gut microbial species such as E. coli and Parasutterella excrementihominis were closely related to changes of neural activity in cognition-related and emotion-related regions after REVERIE sports. The integration of multi-omics, fMRI and cognitive outcomes discloses the cross-talk between brain cognitive function, circulating molecules and gut microbiota (Extended Data Fig. 9c). This offers molecular insights that may partially explain the cognitive enhancement by REVERIE, although the mechanism warrants further elucidation.
Discussion
Adolescent obesity has become an important public health concern, but effective intervention strategies remain lacking. Our study developed the REVERIE system, a deep reinforcement learning-ensembled VR sports system, which could provide a safe, immersive and empathetic VR sports intervention for adolescents. To comprehensively investigate the health impacts of VR sports interventions, we integrated the REVERIE system into an 8-week RCT for adolescents with excess body weight. This study offers evidence-based insights into VR sports intervention’s effects on metabolic, physical, psychological and cognitive outcomes via assessments of clinical phenotypes, brain functional imaging and multi-omics analyses. The REVERIE sports intervention was effective in reducing excess body fat, with no significant difference compared with physical sports. REVERIE sports further exhibited a more enduring influence on improving physical fitness, psychological well-being and willingness to engage in sports activities. Notably, REVERIE sports may have potential benefits in enhancing cognitive function beyond physical sports, as reflected by improved olfactory function and enhanced working memory. REVERIE could enhance frontal lobe engagement, cortical recruitment and neuroplasticity, with both interventions modulating brain activation during working memory tasks, as revealed by fMRI analysis. Multi-omics analysis of circulating lipids, metabolites, proteins and intestinal microbiota revealed distinct changes induced by physical and REVERIE sports, which were associated with the alterations of metabolic, physical, mental and cognitive indicators.
Unlike previous VR sports systems that provided a generic, rule-based sports experience27,28 and lacked clinical evidence on improving the physical and mental health of adolescents with excess body weight, our study introduced deep reinforcement learning to train virtual coaching agents, which could provide tailored sports guidance for adolescents with excess body weight. The adaptive nature of REVERIE enables personalized sports prescriptions while supporting standardized curriculum delivery, addressing both personalized health outcomes and broader educational objectives. Extensive experiments showed that REVERIE outperformed baseline deep reinforcement learning methods in mastering sports techniques. Our pilot user study revealed that participants under the REVERIE intervention exhibited comparable biomechanical performance to those guided by human coaches in physical-world sports. Furthermore, the REVERIE sports intervention performed excellently in deployment evaluations in terms of satisfaction, standardization, accessibility and empathy, thereby ensuring coaching quality (Extended Data Fig. 10). These results demonstrated the promise of AI-driven systems in physical education. By providing personalized sports guidance tailored to adolescents’ abilities, REVERIE reduced frustration and increased willingness to engage in physical activity, addressing key barriers to participation and long-term adherence in physical activity interventions for adolescents with excess body weight5,29.
The validation of current VR systems for adolescent interventions faces several challenges, due to the heterogeneity and lack of proper control12. The assessment of efficacy and clinical impact of VR sports systems requires RCTs to generate rigorous evidence. Our RCT found that the weight-loss effect and physical fitness improvement of REVERIE sports were comparable to those of physical sports. The REVERIE system in this study, designed around the principles of sports expertise-ensembled physical simulation and deep reinforcement learning-based virtual coaching agents, accurately reflects real-world physical conditions and achieves effective heart rates comparable to physical sports and then facilitates weight loss. Endurance exercise has been shown to alter thousands of multi-omics molecules involved in immune, metabolic, stress response and mitochondrial regulation30. In our study, the REVERIE sports group demonstrated more pronounced changes in lipids, small metabolites and gut microbiota, whereas the physical sports group exhibited more substantial alterations in protein profiles. There were distinct patterns of correlation between multi-omics changes and physical indicators between the physical and REVERIE sports. In summary, 8-week physical and REVERIE sports interventions exerted similar and effective metabolic and sports-related improvements, potentially with different multi-omics bases.
In addition to physical improvements, REVERIE sports also enhanced psychological health, with brain activation patterns closely linked to various psychological outcomes. Our findings revealed particularly strong and widespread negative correlations with eating behaviors, which align with the established role of the prefrontal cortex in regulating obesity and eating behaviors31. Additionally, as evidenced by the negative correlations between brain activations and sports willingness, REVERIE’s ability to enhance sports motivation may be mediated by neural changes in regions associated with motor planning and execution32. Additionally, molecular and microbial signatures were reported to be associated with specific psychological conditions33. In our study, gut microorganisms such as Klebsiella variicola and Klebsiella quasipneumoniae34 showed strong correlations with mental health improvement after the REVERIE sports intervention. These results offered possible insights into the sports-induced mental improvement, which were still observed even at the 6-month follow-up, expanding our understanding of the neural and molecular foundations underlying the benefits of VR-based sports.
In this study, the REVERIE sports exhibited superior efficacy over the physical sports in enhancing cognitive functions, evidenced by improvements in olfactory function and working memory performance. In children with overweight and obesity, exercise has been shown to positively impact intelligence and cognitive flexibility35. Besides, the Adolescent Brain Cognitive Development study observed that sports can influence cognition-related brain structures36,37. Under task-based fMRI, the physical sports group exhibited decreased activation in frontal regions under low cognitive demand, but increased activation in the bilateral putamen and left parietal lobule under higher demand, indicating enhanced motor–cognitive integration38,39. In contrast, the REVERIE sports group engaged a broader network, particularly in the frontoparietal and cingulate circuits, which potentially reveal the multifaceted cognitive demands of virtual environments40,41 and distinct patterns of brain activation between the two sports interventions. From correlation analyses, it was found that improved working memory performance after REVERIE interventions was associated with neural efficiency enhancement, supported by the negative correlations between n-back accuracy and activation in bilateral frontal gyri and the right supplementary motor area42,43. Notably, negative correlations between the TDI score and activation in frontal, temporal and cingulate regions provide further evidence that enhanced olfactory function is linked to more efficient neural processing across a distributed brain network. Furthermore, regarding functional connectivity, the REVERIE sports group showed decreased connectivity between the limbic system and several brain networks under low cognitive demand and greater reductions in both within-network and between-network connectivity under high cognitive demand, suggesting neural efficiency enhancement. Another decreased functional connectivity between visual and FPTC networks suggests VR’s visual information processing stimulation and its optimization of information integration during cognitive processes. These findings might derive from the immersive and novel nature of VR, which could enhance motivation in ways distinct from real-world physical exercise44,45,46. REVERIE interventions involved multiple cognitive domains, related to working memory, attention, decision-making and motor planning. The observed flexible adjustment and intensive network involvement demonstrated the potential of VR-based interventions to stimulate executive functions, promote cognitive control processes47 and enhance neuroplasticity in this population48.
We attempted to integrate multi-omics analysis to gain insights into the cognitive effects following REVERIE sports. On the one hand, the gut–brain axis may play a role in promoting the positive outcomes of REVERIE, potentially through mechanisms involving microbial metabolites, inflammatory mediators and neurotransmitters49. Bilophila wadsworthia, an important taurine-utilizing species in the gut50, was significantly correlated with circulating taurine here and both were associated with cognitive function. E. coli, which correlated with cognitive function and various circulating molecules in our study, has been reported to affect brain function through the vagus nerve pathway via prompting related proteins51,52. On the other hand, the interactions between circulating macromolecules and small molecules may affect brain cognition. A growing number of studies reported the close relationship between lipid metabolism and cognition53. In our study, APP54 and apolipoprotein APOE correlated with HexCer and C1_TAG, respectively, and they were all associated with cognition-related regions of the brain. In addition, the benefits of REVERIE may stem from VR’s rapid transitions between environments, which may facilitate robust context-dependent learning essential for memory encoding. Highly immersive environments that foster spatial associations can further enhance hippocampal recruitment55. However, the precise mechanisms underlying cognitive improvements upon VR sports require further investigation.
A survey from 146 countries found that 81.0% of adolescents were insufficiently physically active, and there was no clear pattern according to country income56. The WHO’s Global Accelerated Action for the Health of Adolescents concluded that investing in adolescent health and well-being provides long-term public health benefits that span generations57. Our study demonstrates that the REVERIE sports system can enhance exercise motivation in adolescents with obesity and improve metabolic, physical, psychological and cognitive functions, suggesting its potential as a strategy for treating adolescent obesity. By providing immersive and empathetic VR sports guidance tailored to adolescents, the REVERIE intervention increased participants’ willingness to engage in physical activity, thereby addressing key barriers58 to participation and long-term adherence in physical activity interventions for adolescents with excess body weight. Additionally, our findings still show improvements in psychological indicators, particularly the enhancement of self-efficacy at the 6-month follow-up. This improvement in self-efficacy was reported to further support the maintenance of these behaviors, creating a positive feedback loop.
The 8-week intervention period effectively demonstrated preliminary effects of REVERIE sports, yet we acknowledge several limitations. To further evaluate adherence and the long-term sustainability of VR sports therapy, future research should explore longer intervention durations and follow-up periods for adolescents with excess body weight through larger and multicenter trials. Given the potential cognitive implications of VR interventions, subsequent VR sports trials could prioritize cognitive evaluations as primary endpoints. In addition, in this study, we did not assess the impact of VR exercise on cardiorespiratory fitness. It is necessary to conduct more comprehensive assessments in future trials. Another limitation is the cost of initial hardware; however, with affordable VR headsets already available and as adoption expands globally59, this issue is likely to be a short-term concern. Additionally, since the REVERIE intervention included only two types of sports, future studies should consider incorporating a greater variety of sport types, which could enhance the generalizability and provide more comprehensive evaluations of their effects compared to traditional physical sports interventions.
In conclusion, the REVERIE system, a VR-based sports system integrated with deep reinforcement learning, demonstrated multifaceted benefits for adiposity reduction and diverse health improvements with evidence-based support. Our study suggests that VR sports could promote neuroplasticity and alter multi-omics signatures, which may complement real-world physical sports to achieve effective cognitive enhancement. Our research marks an initial stage in addressing this issue, paving the way for further exploration of the underlying mechanisms behind VR therapies as digital solutions in adolescent obesity intervention. If VR is indeed the Wonderland that Alice explored60, our study represents a small step into this land, with knowledge gaps still to be addressed. We believe that future research will venture deeper into the heart of this land, unearthing its inner mysteries. VR therapies hold the promise of promoting adolescents’ health not only today but also into their adulthood and for future generations. By exploring this undiscovered field together, we aim to harness the potential of VR in fostering healthier, more active lifestyles among adolescents, contributing to the global efforts to promote their health.
Methods
REVERIE system
Setup of the professional coaching panel
Since adolescents with excess body weight lacked standardized sports skills, we established standardized sports protocols for table tennis and soccer. To achieve this, we convened ten certified coaches (five for table tennis and five for soccer) to form a professional coaching panel. The table tennis panel is chaired by an Olympic champion, and the soccer panel is led by a Chinese national soccer player. They provided (1) the content of table tennis and soccer sports interventions and (2) the standardized instructions of sports techniques. Soccer and table tennis interventions are categorized into three distinct training difficulty levels: low, medium and high. The professional coaching panel collaboratively developed intervention schedules for each level, detailing the sports technique guidance and their associated characteristics. The details of the content of table tennis and soccer sports interventions are shown in ‘REVERIE RCT’. According to the well-established intervention schedules, five professional coaches in table tennis or soccer wearing motion capture equipment performed 100 instances of each sports technique guidance (details are shown in ‘Motion capture’). The high-speed camera was used to record the entire process in real time. We collected and analyzed the motion data of each coach during this process by Avatar Pro (Avatar Pro 2.0, Chingmu) and Visual 3D (Visual 3D 6.0 Professional, Has-Motion). Then, the professional coach panel voted on the collected instances of each sports technique guidance to determine if it met the established intervention schedules. The sports technique guidance that was unanimously approved by the vote was referred to as ‘valid sports technique guidance’. The results showed that each coach provided over 30 valid instances. We then randomly selected 30 instances from each coach’s valid set, yielding 150 valid instances for each sports technique guidance. After mapping the skeleton of 150 valid instances per sports technique guidance to a standard skeleton, we extracted the position and rotation parameters of the coach. Based on the high-speed video of the ball recorded by the high-speed camera, we obtained the initial linear velocity and initial angular velocity parameters of the ball. We then calculated the IQR of these parameters to establish the standardized parameter range, which were used to construct the standardized rules of sports technique guidance.
System development
REVERIE-Environment module
The REVERIE-Environment module is used to develop the VR sports environment and the coaching templates. The VR sports environment is a simulated, immersive virtual space that allows users to engage in interactive sports. The coaching templates are a set of instruction rules that emulate the standardized sports guidance from the professional coach panel. To achieve the full use of these resources, we propose a sports expertise-ensembled physical simulation method that iteratively refines the VR sports environment and coaching templates based on feedback from the professional coach panel (Supplementary Fig. 1). We construct VR sports environments using physical functions, Maya (Autodesk) and Unity3D (Unity). The VR sports environment contains static and dynamic environments. The static environment features sports venues, balls, rackets, goalposts and other objects.
The dynamic environment includes the collision and trajectory of the ball. During sports interventions, the motion of the ball is influenced by various forces (racket impact force and friction, gravity, air friction, table impact force and friction in table tennis and shoes or head impact force and friction, gravity, air friction, filed impact force and friction). For the collision of the ball, we define the impact force \({F}_{{ri}}\) which is perpendicular to the racket in table tennis (shoes or head in soccer) and friction \({F}_{{rf}}\) between the ball and the racket in table tennis (shoes or head in soccer). \({F}_{{ri}}\) is determined by the racket’s (shoes or head in soccer) speed \({v}_{h}\) and the materials of the racket (shoes or head in soccer). \({F}_{{rf}}\) is determined by the materials of the racket (shoes or head in soccer). The velocity of the ball in the direction of the \({F}_{{rf}}\) is \({v}_{{F}_{{rf}}}\) and in the direction of \({F}_{{ri}}\) is \({v}_{{F}_{{ri}}}\). The angular velocity (ω) of the ball is parallel to the plane of the racket (shoes or head in soccer). Given the incoming velocities of the ball, the ball mass and diameter, we obtain the output linear velocity, \({v}_{{F}_{{rf}}}\), which is in the direction of \({F}_{{rf}}\), the linear velocity, \({v}_{{F}_{{ri}}}\), which is in the direction of \({F}_{{ri}}\), and the angular velocity, \({\rm{\omega }}\), which is parallel to the plane of the racket (shoes or head in soccer). The collision simulation of the ball is the same when the ball hits the table in table tennis and hits the shoes or head in table tennis. After the collision, we simulate the trajectory of the ball. For the trajectory, in table tennis, the ball is affected by the air friction, \({F}_{{af}}\), air buoyancy, \({F}_{{ab}}\), gravity, \({F}_{g}\), and Magnus force, \({F}_{M}\). The trajectory equations in the x, y and z directions can be derived from the motion decomposition as given by equation (1):
$$\begin{array}{c}m\frac{{\text{d}}^{2}x}{\text{d}{t}^{2}}=-\left({F}_{M}{\rm{si}}{\rm{n}}{{\rm{\theta }}}_{x}+{F}_{{af}}\,{\rm{co}}{\rm{s}}{{\rm{\theta }}}_{x}\right){\rm{co}}{\rm{s}}{{\rm{\alpha }}}_{z},\\ m\frac{{\text{d}}^{2}y}{\text{d}{t}^{2}}=-\left({F}_{{af}}\sin {{\rm{\theta }}}_{x}+{F}_{M}\cos {{\rm{\theta }}}_{x}\right)\sin {{\rm{\alpha }}}_{z},\\ m\frac{{\text{d}}^{2}z}{\text{d}{t}^{2}}=-\left({F}_{g}-{F}_{{ab}}-{F}_{M}\cos {{\rm{\theta }}}_{x}+{F}_{{af}}\cos {{\rm{\theta }}}_{x}\right)\cos {{\rm{\alpha }}}_{z},\end{array}$$
(1)
where \({F}_{g}={mg}\) is the gravity, \({F}_{{af}}=\frac{1}{8}{\rm{\pi }}{C}_{d}{\rm{\rho }}{D}^{2}{v}^{2}\) is the air friction, \({F}_{{ab}}=\frac{1}{6}{\rm{\rho }}g\,{{\uppi}}{D}^{3}\) is the air buoyancy and \({F}_{M}=\frac{1}{8}{\rm{\pi }}{\rm{\rho }}{D}^{3}{nv}\) is the Magnus force. \(n\) is the spin frequency of the ball based on \({\rm{\omega }}\). \({{\rm{\theta }}}_{x}\) and \({{\rm{\alpha }}}_{z}\) represent the angle between linear velocity, \(v\), and the xoy plane and z axis, respectively. In soccer, the filed friction, \({F}_{{af}}\), is added into the equation (1). With the help of our professional coach panel, we iteratively refine the parameters of the above equations to ensure the realism. In REVERIE, \({{\rho }}\) is the density of the air (1.225 \({kg}{{m}}^{-3}\)), \({C}_{d}\) is the friction coefficient (0.2), \(g\) is gravitational acceleration (9.8 \(m{{s}}^{-2}\)), \(m\) is the mass of the ball (2.7 \(g\)) and \(D\) is the diameter of the ball (4 \({cm}\) in table tennis and 22 \({cm}\) in soccer).
For the coaching templates, their parameters are defined based on the standardized values (including initial linear velocities, initial angular velocities, positions and rotations) of instructional rules provided by the professional coach panel. After establishing these, professional coaches are asked to use the VR equipment to interact with the coaching templates within the VR sports environment and provide feedback. Based on this feedback, we iteratively adjust the parameters of the VR sports environment and coaching templates to achieve optimized results. The VR sports environment is not only presented to users but also serves as the training environment in the REVERIE-Agent module, while the coaching templates are used as the training environment in the REVERIE-Agent module.
REVERIE-Rendering module
The REVERIE-Rendering module renders the VR sports scene generated by the REVERIE-Environment module. To reduce cybersickness, in this module, we design a sports-oriented deep immersive rendering method (Supplementary Fig. 2). Given the current frame \({I}_{{ori}}\subseteq {\text{R}}^{\text{H}\times \text{W}\times 3}\), the sports-oriented deep immersive rendering method outputs an enhanced frame \({I}_{{eh}}\subseteq {\text{R}}^{\text{H}\times \text{W}\times 3}\), which highlights sport-related regions. Considering a satisfactory speed–accuracy trade-off, RTMDet-Ins61 is utilized to detect regions of sport-related objects. Given the current frame, \({I}_{{ori}}\), RTMDet-Ins predicts the pixel-level mask, \({M}_{s}\subseteq {\text{R}}^{\text{H}\times \text{W}\times 1}\), of sport-related objects. Using \({M}_{s}\), we split \({I}_{{ori}}\) into the sport-related sub-frame \({I}_{s}\) and the background sub-frame \({I}_{o}\). Finally, we apply the multilevel Gaussian filters, \({G}_{f}\), with different \({\rm{\sigma }}\left({ix},{iy}\right)\) to \({I}_{s}\) and \({I}_{o}\) to obtain the enhanced final foveated frame \({I}_{{en}}\).
For loss function, RTMDet-Ins is trained using the label loss, \({{\mathcal{L}}}_{{\mathcal{c}}{\mathcal{l}}{\mathcal{s}}}\); intersection over union (IoU) loss, \({{\mathcal{L}}}_{{\mathcal{r}}{\mathcal{e}}{\mathcal{g}}}\); and instance loss, \({{\mathcal{L}}}_{{\mathcal{i}}{\mathcal{n}}{\mathcal{s}}}\). The label loss is the focal loss as shown in equation (2):
$${{\mathcal{L}}}_{{\mathcal{c}}{\mathcal{l}}{\mathcal{s}}}=\frac{1}{{N}_{\text{pos}}}\sum _{({ix},{iy})}{{{\mathcal{L}}}_{{\mathcal{f}}{\mathcal{o}}{\mathcal{c}}{\mathcal{a}}{\mathcal{l}}}}_{\left({p}_{\left({ix},{iy}\right)},{c}_{\left({ix},{iy}\right)}\right)}$$
(2)
where \({c}_{\left({ix},{iy}\right)}\) is the class label of location \(\left({ix},{iy}\right)\) in the frame, \({p}_{\left({ix},{iy}\right)}\) is the classification score, and \({{\mathcal{L}}}_{{\mathcal{f}}{\mathcal{o}}{\mathcal{c}}{\mathcal{a}}{\mathcal{l}}}\) is the focal loss. \({N}_{{pos}}\) is the number of positive samples, that is, \({c}_{\left({ix},{iy}\right)} > 0\). The IoU loss \({{\mathcal{L}}}_{{\mathcal{r}}{\mathcal{e}}{\mathcal{g}}}\) penalizes the predicted box determined by the instance shown in equation (3):
$${{\mathcal{L}}}_{{\mathcal{r}}{\mathcal{e}}{\mathcal{g}}}=\frac{1}{{N}_{\text{pos}}}\sum _{x,\,y}{{{\bf{1}}}_{\left\{{c}_{\left({ix},{iy}\right)} > 0\right\}}{\mathcal{L}}}_{{\mathcal{i}}{\mathcal{o}}{\mathcal{u}}\left(\,{pr}{e}_{{box}},g{t}_{{box}}\right)}$$
(3)
where \({pr}{e}_{{box}}\) is \(\left({c}_{{ix}}-{rs},{c}_{{iy}}-{rs},{c}_{{ix}}+{rs},{c}_{{iy}}+{rs}\right)\), \(\left({c}_{{ix}},{c}_{{iy}}\right)\) denotes the mass center of the instance, \(s\) is the down-sampling ratio, \(r\) is a constant scalar, which is 1.5. \(g{t}_{{box}}\) is the ground-truth box. \({{\boldsymbol{1}}}_{\left\{{c}_{\left({ix},{iy}\right)} > 0\right\}}\) is the indicator function, being 1 if \({c}_{\left({ix},{iy}\right)} > 0\) and 0 otherwise. \({{\mathcal{L}}}_{{\mathcal{i}}{\mathcal{o}}{\mathcal{u}}}\) is the IoU loss. The instance loss \({{\mathcal{L}}}_{{\mathcal{i}}{\mathcal{n}}{\mathcal{s}}}\) punishes misclassified masks at the pixel level based on the dice loss as shown in equation (4):
$${{\mathcal{L}}}_{{\mathcal{i}}{\mathcal{n}}{\mathcal{s}}}=\frac{1}{{N}_{\text{pos}}}{\sum }_{x,y}\left({{\bf{1}}}_{\left\{{c}_{{ix},{iy}} > 0\right\}}{{\mathcal{L}}}_{{\mathcal{d}}{\mathcal{i}}{\mathcal{c}}{\mathcal{e}}}\left({\rm{MaskHead}}\left(\widehat{P{3}_{\left({ix},{iy}\right)}};{{{\theta }}}_{\left({ix},{iy}\right)}\right),{M}_{\left({ix},{iy}\right)}^{* }\right)\right)$$
(4)
where MaskHead() is the mask head of RTMDet-Ins. \({M}_{\left({ix},{iy}\right)}^{* }\) is the mask of the instance associated with location \(\left({ix},{iy}\right)\), being 1 for instance and 0 for others. \(\widehat{P{3}_{\left({ix},{iy}\right)}}\) is the fused feature combined with the relative coordinates in RTMDet-Ins. \({{\mathcal{L}}}_{{\mathcal{d}}{\mathcal{i}}{\mathcal{c}}{\mathcal{e}}}\) is the dice loss.
Above all, the overall loss function can be formulated according to equation (5):
$${{\mathcal{L}}}_{{\mathcal{o}}{\mathcal{v}}{\mathcal{e}}{\mathcal{r}}{\mathcal{a}}{\mathcal{l}}{\mathcal{l}}}={{\rm{\lambda }}}_{1}{{\mathcal{L}}}_{{\mathcal{c}}{\mathcal{l}}{\mathcal{s}}}+{{\rm{\lambda }}}_{2}{{\mathcal{L}}}_{{\mathcal{r}}{\mathcal{e}}{\mathcal{g}}}+{{\rm{\lambda }}}_{3}{{\mathcal{L}}}_{{\mathcal{i}}{\mathcal{n}}{\mathcal{s}}}$$
(5)
where \({{\rm{\lambda }}}_{1}\), \({{\rm{\lambda }}}_{2}\) and \({{\rm{\lambda }}}_{3}\) are hyperparameters that are used to balance the three losses. We set \({{\rm{\lambda }}}_{1}\) as 1.0, \({{\rm{\lambda }}}_{2}\) as 3.0 and \({{\rm{\lambda }}}_{3}\) as 1.0 based on our experiments.
REVERIE-Agent module
The objective of REVERIE-Agent module is to train and offer the REVERIE Coach, which provides empathetic guidance for sports techniques. To complete this task, we propose a two-stage, template-driven and feedback-oriented, deep reinforcement learning method to train the REVERIE Coach (Extended Data Fig. 1). The proposed method contains two stages: the digital twin stage and the AI–human interaction stage. In the digital twin stage, the REVERIE Coach is trained and conditioned on preset professional coaching templates and the VR sports environment built in the REVERIE-Environment module. In the AI–human interaction stage, the REVERIE Coach is fine-tuned based on the REVERIE Coach–adolescent interactions, which are collected by the REVERIE-Assistance module. Finally, the REVERIE Coach provides empathetic instructions (including position, rotation and impact force) of sports techniques for individual adolescents.
We define the proposed training strategy as a Markov decision process \({{\mathcal{M}}}_{{\mathcal{t}}{\mathcal{p}}}={\mathcal{ < }}{\mathcal{S}},{\mathcal{O}},{\mathcal{A}},F,C,{R}_{f,C} >\), where \({\mathcal{S}}\) is the space of training environment (including VR sports environment and coach templates), \({\mathcal{O}}\) is the space of the observed state, \({\mathcal{A}}\) is the set of sports actions, \(F\) is the sport technique type flag that determines current sport technique, \(C\) indicates the preset coach templates that provide standardized instructions of sport technique, and \({R}_{f,C}\) is the reward function. During training, \(C\) generates a set of observational variables denoted as \(O=\{{o}_{1},{o}_{2},{o}_{3},\ldots ,{o}_{T}\},{o}_{t}\subseteq {\mathcal{O}}\). We assume that the environment variables \(S=\{{s}_{1},{s}_{2},{s}_{3},\ldots ,{s}_{T}\},{s}_{t}\subseteq {\mathcal{S}}\) record the states of VR sports and include the key information of previous observational data, the sport actions represented as \(A=\{{a}_{1},{a}_{2},{a}_{3},\ldots ,{a}_{T}\},{a}_{t}\subseteq {\mathcal{A}}\). Our goal is to learn a policy \({{\rm{\pi }}}_{{\rm{\theta }}}\) to output the action \(\hat{{a}_{t}}\) by maximizing the sum of discounted rewards from time step \(t\).
For transformer-based REVERIE Coach, given the VR sport state \(s\), the REVERIE Coach outputs the sport actions \(\widehat{{a}_{t}}\), including position \(\left(x,y,z\right)\), rotation \(\left({{\rm{\phi }}}_{x},{{\rm{\phi }}}_{y},{{\rm{\phi }}}_{z}\right)\) and impact force \(\left(\,{f}_{x},{f}_{y},{f}_{z}\right)\). To capture the long-range sports motion clues, we use the transformer to model our REVERIE Coach. It contains five transformer blocks to encode and extract features of the states. One linear layer with the SoftMax function is used to produce the policy \({\rm{\pi }}\) and two linear layers are used to generate value \(V\). The critic network produces the action–value function \(Q\).
For observational data embedding and VR sports state representation, the observational data contain different sports actions, including \(C\)’s information (\(\left(x,y,z\right)\) coordinates, rotation \(\left({{\rm{\phi }}}_{x},{{\rm{\phi }}}_{y},{{\rm{\phi }}}_{z}\right)\), impact force \(\left({f}_{x},{f}_{y},{f}_{z}\right)\)) and ball information (coordinates \(\left({x}_{b},{y}_{b},{z}_{b}\right)\), linear velocity \(\left({v}_{x},{v}_{y},{v}_{z}\right)\), angular velocity \(\left({{\rm{\omega }}}_{x},{{\rm{\omega }}}_{y},{{\rm{\omega }}}_{z}\right)\)). We utilize the multimodal encoder based on the transformer to embed the observational data and output the VR sports state presentation. The observational data are embedded into tokens through embedding. Then, we concatenate these tokens with position embedding and send them to the encoder. The encoder contains two transformer layers and two fully connected layers. Given these tokens, the encoder outputs the VR sport representation as given by equation (6):
$$\begin{array}{l}s=\,W\left({\rm{Embed}}\left((x,\,y,\,z),\,({{{\phi }}}_{x},{{{\phi }}}_{y},{{{\phi }}}_{z}),\,(\;{f}_{x},{f}_{y},{f}_{z}),\right.\right.\\\left.\left.({x}_{b},{y}_{b},{z}_{b}),\,({v}_{x},{v}_{y},{v}_{z}),\,({{\rm{\omega }}}_{x},{{\rm{\omega }}}_{y},{{\rm{\omega }}}_{z})\right)\right)\,\times {W}_{1}\,\times {W}_{2}\end{array}\,$$
(6)
where \(W\) indicates the weights for the transformer layers, \({\rm{Embed}}()\) is the position embedding operation, and \({W}_{1}\) and \({W}_{2}\) are the weights for the fully connected layers, respectively.
For digital twin stage, the first objective of REVERIE Coach is to master standardized instructions of sports technique. Therefore, we train the REVERIE Coach based on the VR sports environments and coaching templates built in module I. There are two main reasons for this stage. First, standardized instructions of sports techniques consist of a series of complex rules. However, it will be difficult for REVERIE Coach to learn these complex rules solely relying on formulas. For example, in forehand attack training in table tennis, REVERIE Coach needs to successfully hit the ball into the designated area with a certain force and angle. Second, learning sports technique instructions from scratch using sparse rewards is difficult. Thus, our approach trains REVERIE Coach with a preset coaching template as guidance. The preset template generates the state–action trajectory \({\rm{\tau }}\), which provides observational variables for training. Each training iteration contains two steps62. In the first step, the trust region policy optimization approach is used to update the policy \({{\rm{\pi }}}^{{RT}}\) within the trust region, which ensures that the ability of REVERIE Coach to master instructions is consistently improving throughout the training process. In training iteration \(k\), this step can be represented by equation (7):
$$\begin{array}{c}{\pi}_{k+1/2}^{RT}={\text{arg max}}\, {E}_{{s}\sim {d}^{{{{\pi }}}_{k}^{{RT}}},a\sim {{{\pi }}}^{{RT}}}\left[{Q}^{{{{\pi }}}_{k}^{{RT}}}\left(s,a\right)-{V}^{{{{\pi }}}_{k}^{{RT}}}\left(s\right)\right],\\ \text{s.t.}{D}_{\text{KL}}^{{{{\pi }}}_{k}^{{RT}}}\left({{{\pi }}}^{{RT}},{{{\pi }}}_{k}^{{RT}}\right)\le {{\delta }},\end{array}$$
(7)
where \({{\rm{\pi }}}_{k}^{{RT}}\) is the policy after \(k\) iterations. \({d}^{\,{{{\uppi }}}_{k}^{{RT}}}\) denotes the discounted state visitation distribution of policy \({{\rm{\pi }}}^{{RT}}\). \({V}^{\,{{{\uppi }}}^{{RT}}}\) is the value function and \({Q}^{{{\rm{\pi }}}^{{RT}}}\) is the action–value function. \({D}_{\text{KL}}^{{{\rm{\pi }}}_{k}^{{RT}}}\) is the average Kullbak–Leibler (KL) divergence between two policies with respect to \({{\rm{\pi }}}_{k}^{{RT}}\). \({\rm{\delta }}\) is a constant.
After the first step, we continue to optimize REVERIE Coach toward mastering the instructions of sports techniques provided by \(C\) through minimizing the KL divergence in the second step, as shown in equation (8):
$$\begin{array}{c}{{{\pi }}}_{k+1}^{{RT}}={{\arg }}\min {D}_{\text{KL}}^{{\pi }^{{RT}}}\left({\pi }^{{RT}},C\right),\\ \text{s.t.}{D}_{\text{KL}}^{\max }\left({{{\pi }}}^{{RT}},{{{\pi }}}_{k+1/2}^{{RT}}\right)\le {{{\delta }}}_{k}\end{array}$$
(8)
where \({D}_{\text{KL}}^{\max }\) is the maximum KL divergence between \({\pi }^{{RT}}\) and \(C\). This process not only updates REVERIE Coach toward the direction of the preset \(C\), but also ensures that the updated REVERIE Coach falls within the trust region of the REVERIE Coach in the first step. \({{\rm{\delta }}}_{k}\) is a hyperparameter changed along \(k\). In the early training phase, \({{\rm{\delta }}}_{k}\) is a large value, allowing REVERIE Coach to mimic \(C\) for efficient initialization. As training progresses, \({{\rm{\delta }}}_{k}\) gradually decreases, enabling REVERIE Coach to achieve a better performance. In addition, to utilize sampled data generated by \(C\), an approximation function is made to equation (8) as given by equation (9):
$$\begin{array}{c}{{{\pi }}}_{k+1}^{{RT}}={{\arg }}\min {E}_{s\sim {d}^{{\pi }_{k{\mathbb{+}}{\mathbb{1}}/{\mathbb{2}}}},a\sim \pi \left(s,\cdot \right)}\left[{Q}^{{\pi }_{k+1/2}^{{RT}}}\left(s,a\right)-{V}^{{\pi }_{k+1/2}^{{RT}}}\left(s\right)\right],\\ \text{s.t.}{D}_{\text{KL}}^{{{{\pi }}}_{k+1/2}^{{RT}}}\left({{\pi }},{{{\pi }}}_{k+1/2}\right)\le {{{\delta }}}_{k}\end{array}$$
(9)
Above all, we obtain the equations (7) and (9) together as the objective functions to optimize REVERIE Coach in the digital twin stage. For the reward function, we utilize the policy-dependent reward function as given by equation (10):
$${R}_{{\rm{\pi }}}\left(s,a\right)=\log \left(\frac{{{\rm{\pi }}}^{{RT}}\left(s,a\right)}{C\left(s,a\right)}\right)$$
(10)
Assuming that \({\rm{\theta }}\) represents the parameters of the REVERIE Coach, we update \({\rm{\theta }}\) according to the above objective functions. In the iteration \(k\), for the equation (7), we update \({\rm{\theta }}\) according to equation (11):
$${{\rm{\theta }}}_{k+1/2}={{\rm{\theta }}}_{k}+\sqrt{\frac{2{\rm{\delta }}}{{g}_{k}^{T}{K}_{k}^{-1}{g}_{k}}}{K}_{k}^{-1}{g}_{k}$$
(11)
where \({g}_{k}\) is the gradient of maximizing expected reward, denoted as \({g}_{k}={\nabla }_{{\rm{\theta }}}{E}_{s\sim {d}^{{\pi }_{k}^{{RT}}},a\sim {\pi }_{\theta }^{{RT}}}\left[{Q}^{{{\rm{\pi }}}_{k}^{{RT}}}\left(s,a\right)-{V}^{\,{{{\uppi }}}_{k}^{{RT}}}\right]\), and \({K}_{k}\) is the gradient of KL divergence, as \({K}_{k}={\nabla }_{{\rm{\theta }}}{D}_{\text{KL}}^{{{\rm{\pi }}}_{k}^{{RT}}}\left({{\rm{\pi }}}^{{RT}},{{\rm{\pi }}}_{k}^{{RT}}\right)\). Then, for the equation (9), we update \({\rm{\theta }}\) according to equation (12):
$${{\rm{\theta }}}_{k+1}={{\rm{\theta }}}_{k+1/2}-\sqrt{\frac{2{{\rm{\delta }}}_{k}}{{h}_{k}^{T}{L}_{k}^{-1}{h}_{k}}}{L}_{k}^{-1}{h}_{k}$$
(12)
where \({h}_{k}\) is the gradient of maximizing expected reward, as \({h}_{k}={\nabla }_{{\rm{\theta }}}{E}_{s\sim {d}^{{\pi }_{k{\mathbb{+}}{\mathbb{1}}/{\mathbb{2}}}},a\sim \pi \left(s,\cdot \right)}\left[{Q}^{{{\rm{\pi }}}_{k+1/2}^{{RT}}}\left(s,a\right)-{V}^{\,{{{\uppi }}}_{k+1/2}^{{RT}}}\left(s\right)\right]\), and \({L}_{k}\) is the gradient of KL divergence, as \({L}_{k}={\nabla }_{{\rm{\theta }}}{D}_{\text{KL}}^{{{\rm{\pi }}}_{k+1/2}^{{RT}}}\left({\rm{\pi }},{{\rm{\pi }}}_{k+1/2}\right)\).
For AI–human interaction stage, to match the diverse characteristics of adolescents, we update REVERIE Coach based on REVERIE Coach–adolescent interactions, thus achieving personalized sports guidance. In this stage, we use REVERIE Coach–adolescent interactions from module IV and follow the actor–critic framework63 for parameter \(\theta\) updates. Unlike the previous stage, the rewards are modified as follows: if the adolescent receives the ball provided by the REVERIE Coach and successfully hits it into the target area, the reward is +1. If the adolescent receives the ball but fails to hit it into the target region, the reward is 0. If the adolescent fails to receive the ball, the reward is −1.
REVERIE-Assistance module
The REVERIE-Assistance module visualizes the training data of adolescents during intervention and provides the REVERIE Coach–adolescent data for the loop-back REVERIE-Agent module. This module collects the training data (including training types, durations, heart rates, postures, scores and REVERIE Coach–adolescent interactions) of adolescents during sports interventions. Then, we visualize the training data and display it on a webpage for human coaches (Supplementary Fig. 3). Human coaches could log in to the webpage to interpret the visualized data to optimize the intervention schedule. REVERIE Coach–adolescent interaction data are utilized to fine-tune the REVERIE Coach following the AI–human interaction stage in module III for providing empathetic sports guidance.
Hardware
To provide VR sports to adolescents, we utilized the Oculus Quest 2 (Oculus Quest 2, Meta). Additionally, in table tennis, we utilized a table tennis bracket combined with Oculus Quest 2 Touch Controller to provide a more authentic sports experience. In soccer, to enable the Oculus Quest 2 Touch Controller to accurately reflect leg movements, we created the paired soccer brackets using a 3D printing technique. The paired soccer brackets are divided into a left leg bracket and a right leg bracket, which are strapped onto the shins of adolescents with an elastic band. We use a wireless heart rate telemetry sensor (Polar Verity Sense, Polar Electro Oy) to record the participants’ heart rate during the sports intervention (Supplementary Fig. 4).
Implementation details
The proposed method is implemented using Python 3.9.19 and PyTorch 1.11, and trained on Ubuntu 20.04 with NVIDIA GeForce RTX 3090. We fine-tuned the model in module II using the sports-related dataset that we collected. This dataset contains 2,000 (image, bounding box, mask) samples that are randomly split into training, validation and test sets (70%, 10%, 20%, respectively). The adaptive moment estimation (Adam) algorithm is used to train the model. The initial learning rate is set to 0.01, and it is reduced by a factor of 0.1 every 10 epochs. We set \({{\rm{\lambda }}}_{1}\) to 1.0, \({{\rm{\lambda }}}_{2}\) to 3.0 and \({{\rm{\lambda }}}_{3}\) to 1.0. We fine-tuned the model in module II on our dataset for 50 epochs. To train the REVERIE Coach, we constructed six VR sports environments with different preset coaching templates. The coaching templates provide simulated training data for the digital twin stage. In our experiments, we first train the REVERIE Coach with 4 million iterations based on the preset coaching templates to effectively obtain standardized sports techniques and then train REVERIE Coach with 2 million iterations using a self-play strategy to increase the diversity. We set \({\rm{\delta }}\) to 0.2. The initial value of \({{\rm{\delta }}}_{k}\) is 0.7 and is gradually and linearly decreased to 0.2 during training. We utilized five seeds to train the REVERIE Coach, and the results were averaged across five experiments.
Motion capture
The motion capture environment contained two three-dimensional force plates (KWR36, Kunwei) and eight high-speed infrared motion capture cameras (MC3000, Chingmu, China) to capture the biomechanical data of participants. In this environment, participants wore black tight-fitting suits, and 40 infrared reflective markers (diameter of 14 mm) were attached to specific joint points, including bilateral acromions, perimeter of the head, bilateral humeral condyles (medial and lateral), bilateral ulnar condyles, bilateral radial condyles, bilateral third metacarpophalangeal joint capsules, manubrium of the sternum, body of the sternum, first vertebra, inferior border of bilateral scapulae, tenth vertebra, bilateral iliac crests (left and right), bilateral anterior superior iliac spines (left and right), bilateral greater trochanters of the femur (left and right), bilateral distal femur (medial and lateral condyles), bilateral proximal tibia (medial and lateral condyles), bilateral malleoli (medial and lateral) and the distal ends of the first and fifth metatarsal bones (left and right). During the REVERIE sports, they additionally wore the REVERIE hardware. Before motion capture, the environment was calibrated using an L-shaped calibration frame and a T-shaped wand. The standard residual of each camera was required to be under 0.8 mm, and the standard deviation of the wand length across the eight cameras was below 0.8 mm. Cameras exceeding these calibration values were shielded to ensure experimental conditions met the necessary standards. During the motion capture, Avatar Pro (Avatar Pro 2.0, Chingmu) was used to record the biomechanical data. After the motion capture, missing data were filled using linear or polynomial interpolation methods in Avatar Pro and were smoothed using Butterworth low-pass filtering in the Visual 3D software (Visual 3D 6.0 Professional, Has-Motion). The spatial coordinates system was defined as follows: the x axis points to the right side of the laboratory, the y axis points to the front of the laboratory, and the z axis is vertical, pointing upwards.
For the motion capture data analysis, we segmented the collected motion capture data into key moments according to the sports guidelines. The forehand attack and backhand push in table tennis contain two key moments: (a) the end of the backswing and (b) the moment of impact. The end of the backswing was defined as the moment when the racket reaches its furthest backward position, and the moment of impact was defined as the moment of maximum racket speed. The shooting in soccer was divided into two key motions: (a) the end of the backswing and (b) the moment of impact. The end of the backswing was defined as when the kicking leg swings to its furthest backward position, while the moment of impact was defined as the moment of maximum foot speed. The heading in soccer was divided into two key motions: (a) the end of the head backswing and (b) the moment of impact. The end of the head backswing was defined as when the player’s head moves to its furthest backward position, and the moment of impact was defined as the moment of maximum head speed.
Comparative experiment
To evaluate the performance of our proposed two-stage, template-driven and feedback-oriented, deep reinforcement learning method, we conducted comparative experiments. We compared our method with general64 and goal-conditioned deep reinforcement learning approaches65, using success probability66 as the evaluation metric. We trained the REVERIE Coach using these methods separately and recorded the number of training steps and the success probability at convergence. To evaluate the generalizability and robustness of our method, we trained the REVERIE Coach to convergence across different sports technique guidance under three levels using our method and recorded the number of training steps and the success probability at convergence. To assess the impact of professional coaching templates, we further conducted an ablation study by training REVERIE Coach without professional coaching templates. All experiments were conducted five times and the results were averaged across five experiments.
Compared to benchmarked methods, the REVERIE system exhibited faster convergence and higher overall success probability values (Extended Data Fig. 2c and Supplementary Fig. 5). The ablation study highlighted the critical role of professional coaching templates in enhancing performance (Extended Data Fig. 2d).
Pilot user study
To evaluate the immersion, safety and performance of the REVERIE system, we conducted a pilot user study with 40 participants (24 males, 16 females; age 17.18 ± 2.94 years; BMI 26.07 ± 3.80 kg/m2). Before the user study, participants mastered REVERIE system operations with the help of coaches and had at least 1 h of prior VR exposure. During the user study, they wore the VR equipment and experienced REVERIE table tennis, REVERIE table tennis without the rendering module, REVERIE soccer, REVERIE soccer without the rendering module, Eleven Table Tennis (Eleven Table Tennis 0.251.1, For Fun Labs) and Football Nation VR (Football Nation VR Tournament 2018, Cherry Pop Games). Each system was experienced for 20 min, with a 24-h interval between each experiment. Accelerometer outputs and heart rates were recorded during the user study. All participants filled out the immersion questionnaire, the simulator sickness questionnaire (SSQ) and the Borg rating of perceived exertion (RPE) after experiencing each system. The immersion questionnaire is a seven-point Likert scale to measure immersion from sensory, control, distraction and realism factors after VR sports experience. SSQ is a standardized tool used to measure the symptoms of motion sickness or discomfort experienced after exposure to simulated environments. It helps researchers and developers understand how individuals react to simulated experiences and improve the design of simulators to reduce discomfort. RPE is a widely used tool to measure an individual’s subjective perception of physical exertion during physical activities. It helps gauge how hard the body feels like it is working, based on sensations such as fatigue, breathlessness and muscle strain, rather than relying on objective measures like heart rate or oxygen consumption. Motion capture experiments were also conducted in 20 of the participants.
The screenshots and snapshots of participants in the pilot user study in the REVERIE system (table tennis and soccer) are presented in Extended Data Fig. 2a,b. The REVERIE system outperformed existing popular VR sports systems (Eleven Table Tennis and Football Nation VR) across all dimensions, demonstrating significantly enhanced immersion (Extended Data Fig. 2e). Results indicated minimal cybersickness associated with the REVERIE system, as evidenced by mean SSQ total scores below 10, attributed to the optimized REVERIE-Rendering module (Extended Data Fig. 2f,g and Supplementary Fig. 6).
To comprehensively evaluate the performance of the REVERIE system, we assessed participants’ exercise intensity and biomechanical performance, comparing these with corresponding physical sports. Exercise intensity was measured using the percentages of age-predicted maximum heart rate (%HRmax) and RPE. The %HRmax during REVERIE sports (78.01 ± 6.35 in table tennis and 78.88 ± 6.85 in soccer) and post-lesson RPE scores (13.05 ± 1.10 in table tennis and 14.40 ± 1.43 in soccer) revealed that all participants could achieve moderate-to-high intensity (Extended Data Fig. 2h,i). Biomechanical performance was assessed to determine whether movement patterns in REVERIE sports interventions aligned with those in physical sports. First, we assessed the correlation between the participants’ instantaneous acceleration when hitting the ball and the ball’s initial linear velocity in both REVERIE and physical sports. The results showed that similar instantaneous accelerations produced comparable initial linear velocities of the ball in both REVERIE and Physical sports (Extended Data Fig. 2j,k). We also analyzed differences in participants’ movements and ground reaction forces. Movement similarity was quantified using the mean per joint angle error, which calculates the average distance between the 24 joints of participants in REVERIE and physical sports. Mean per joint angle error values for all movements were below 10°, indicating high consistency between REVERIE and physical sports instructions (Extended Data Fig. 2l–o). Additionally, ground reaction forces demonstrated similar directions patterns (cosine similarity = 0.982 ± 0.013), with no significant differences in magnitude (all P > 0.05) between REVERIE and physical sports (Extended Data Fig. 2l–o). These results indicate that the REVERIE system successfully replicates biomechanical performance and achieves exercise intensities comparable to physical sports, demonstrating its ability to achieve comparable effects in promoting physical activity and movement patterns among adolescents.
REVERIE RCT
Study design
This clinical trial received approval from the Ethics Committee of Shanghai Sixth People’s Hospital and registered with the Chinese Clinical Trial Registry (ChiCTR2300068786). This study conducted an RCT among adolescents with overweight and obesity. The participants were randomly assigned to five groups: (1) physical table tennis group, (2) physical soccer group, (3) REVERIE table tennis group, (4) REVERIE soccer group and (5) control group. Each group underwent an 8-week intervention, followed by a 6-month follow-up after the end of the intervention. Participants were randomized 3 days before the baseline assessment to ensure the availability and proper allocation of intervention-specific equipment (for example, sweatbands for VR headsets, shin guards for VR soccer). Baseline measurements were conducted immediately before the first intervention session. Assessors and participants were blinded to group assignments during baseline assessments to maintain objectivity. During the intervention period, the control group continued routine PE lessons, while participants in the sports intervention groups received additional physical or REVERIE table tennis/soccer classes, 45 min per class, three times per week. All five groups received dietary administration. Throughout the trial, participants received dietary and lifestyle counseling. The total energy intake of the diet was based on the participant’s age and gender, following the recommendations of a nutritionist. Participants were asked to keep a diet diary.
All metabolic, sports-related, psychological and cognitive measures were assessed at the beginning and end of the intervention. In addition, BMI, body weight, physical fitness and psychological measures were evaluated at baseline, at the end of the intervention (8 weeks after baseline) and at a 6-month follow-up after the end of the intervention. The system development and experimental framework transcended the conventional paradigm that regarded VR as merely a transient ‘brains in a vat’ simulation67. Instead, this study aimed to elucidate the underlying mechanisms and therapeutic potential of VR-based interventions. The conceptualization of VR as a transformative technology dated back to Ivan Sutherland’s paper, The Ultimate Display, which envisioned display technology as ‘the Wonderland into which Alice walked’60. Inspired by this concept, we hypothesized that VR-mediated interventions extend beyond visual and physical effects and exert multidimensional influences on human health and behavior.
Participants
A total of 227 adolescents with overweight or obesity were enrolled in the RCT. Overweight or obesity in this population was defined according to the BMI (see Table S1 of the study protocol in the Supplementary Information), calculated as weight in kilograms divided by height in square meters, based on the Health Industry Standard of the People’s Republic of China (WS/T 586—2018): screening for overweight and obesity among school-age children and adolescents68. During the recruitment period, we targeted all students within the two participating schools through the distribution of flyers, the presentation of engaging promotional videos and conducting lectures to clearly explain the study’s purpose and procedures to potential participants and their guardians. After obtaining informed consent from both participants and their guardians, participants underwent a screening process conducted by medical specialists who served as recruiters. The inclusion criteria were as follows: informed consent was obtained from both participants and their parents or legal guardians; participants were aged between 11 and 17 years (inclusive of grades 6–7 and grades 10–11 in two secondary schools), had overweight or obesity, had no history of weight-loss medication and maintained a stable body weight (self-reported weight change < 5 kg) within 90 days before screening. Exclusion criteria were as follows: participation in an organized weight-loss program within 90 days before screening; current use of weight-loss medications; history of obesity surgery; muscle, bone, nerve, or other tissue or organ damage hindering exercise; secondary obesity, including endocrine and metabolic diseases (for example, Cushing’s syndrome, hypothyroidism, hypogonadism, polycystic ovary syndrome), tumors, or trauma; history of serious mental illness (for example, schizophrenia, bipolar disorder or major depression); confirmed bulimia nervosa; issues using VR (for example, vertigo); and any condition that, in the investigator’s judgment, could compromise participant safety or trial compliance.
Sample size
Based on our preliminary experiment, we estimated that after an 8-week sports intervention, the difference in body fat mass between the control group and the REVERIE sports group (or the physical sports group) was 1.1 kg, with a standard deviation of 1.5 kg. A two-sided t-test was performed with an alpha level of 0.05 and a power of 80%. The sample size was calculated using the formula \(n=\frac{2{({u}_{\alpha }+{u}_{\beta (1)})}^{2}{\sigma }^{2}}{{\delta }^{2}}\). Given that the statistical analysis required multiple comparisons (physical sports group versus control group, REVERIE sports group versus control group), adjustments were made with α = 0.05/2, β = 0.2, δ = 1.1 and σ = 1.5. With a 1:1:1:1:1 allocation ratio, the minimum sample size required for each group was determined to be 37. Accounting for a 15% loss to follow-up, the total sample size required for the study was approximately 220.
Randomization and masking
Randomization was performed using the PROC PLAN module in SAS software (version 9.4), generating random numbers stratified by sex and school. The participants were assigned to five groups in a 1:1:1:1:1 ratio. The allocation process was handled by an independent statistician to ensure objectivity. To ensure allocation concealment, randomization information was only provided to non-blinded research staff (that is, the coaches delivering the intervention) after baseline assessments had been completed. As this was an exercise intervention study, blinding was not feasible for participants. The collection, entry and monitoring of primary and secondary outcome data were carried out by blinded evaluators, and participants were instructed not to disclose their group assignment during visits, ensuring that evaluators remained unaware of the participants’ group allocations. Data were stored using unique participant IDs, and all analyses susceptible to investigator bias were conducted in a blinded manner to maintain objectivity.
Interventions
Sports intervention
The exercise classes were held three times per week for 8 weeks, in addition to the school PE lessons. Coaches from Shanghai University of Sport provided professional supervision and training. Concurrently, any reported injuries or adverse events were recorded. Adherence to sports interventions was defined as attendance at the exercise classes.
The exercise intensity in the sports intervention groups was consistent and moderate. Each class lasted 45 min, including 5 min of warm-up, 20-min skills training of moderate intensity, 15-min mini-matches of moderate intensity and 5 min of relaxation. Participants were provided with a wireless heart rate telemetry sensor (Polar Verity Sense, Polar Electro Oy) throughout the exercise sessions to monitor their heart rate and ensure they maintained the appropriate intensity level. The exercise intensity was measured in real time based on the heart rate telemetry sensor, with participants being encouraged to work at 60–70% of their HRmax. Participants in the control group attended regular PE lessons provided by their school teachers three times per week. They were instructed to maintain their usual activity levels throughout the trial.
The participants allocated to the physical sports intervention group were assigned to either the table tennis or the soccer intervention group. The skills training varied between the two exercise groups. The training program was progressive, with the exercise regimens divided into four stages, each lasting 2 weeks. The table tennis program included forehand attack practice, flat serve practice, backhand push practice, and backhand push followed by forehand attack practice, in sequential order. The soccer program included dribbling and ball handling drills, passing drills, long pass and heading training, and shooting training, in sequential order.
The REVERIE system, as described above, was used in the REVERIE sports intervention. Soccer and table tennis training applications were used in this study, with the content of skill training in the REVERIE sports intervention mirroring that of the physical sports intervention. Before the intervention, professional coaches instructed the participants to familiarize themselves with the REVERIE system. All exercises in the REVERIE system were performed in a standing position, and the participants were restricted to a 3 m × 3 m square for safety.
Diet administration
To control the diet of each participant and minimize the confounding effects of different dietary habits, a dietary intervention was implemented throughout the entire intervention period in sports intervention groups and the control group. All participants followed a diet based on a recommended diet recipe prepared by a nutritionist, according to the Dietary Guidelines for Chinese Residents69 and the Guidelines for Medical Nutrition Therapy for the overweight/obese population in China (2021)70.
Specifically, total energy intake met the nutritional requirements for adolescents (average of 2,200 kcal per day for girls and 2,600 kcal per day for boys). Additionally, the energy distribution across breakfast, lunch and dinner was approximately 25–30%, 30–40% and 30–35% of total daily energy intake, respectively. Moreover, three main macronutrients were consumed in appropriate proportions, with carbohydrates accounting for 50–60%, fats accounting for 20–30% and proteins accounting for 15–25% of total energy intake. Approximately one-third to one-half of grain consumption was recommended to be whole or intact grains. Participants were advised to consume about 250 g of vegetables during lunch and dinner. A daily intake of 300 ml of milk or other dairy products was also recommended. We advised participants to keep their daily free sugar intake below 10% of their total energy intake. All participating students were provided with a specially prepared lunch at school on weekdays, and other meals were arranged by their families according to the recommended diet recipe. To increase dietary compliance, participants were asked to keep a food diary recording the type and quantity of food or snacks consumed. Investigators reviewed the dietary records every week to evaluate adherence to the dietary regimens and uploaded the dietary records to the data repository for further analysis, then provided health education to the students, pointed out the problems and offered guidance accordingly. Adherence to the diet was defined by the number of days a participant met the requirements of the assigned diet.
Outcomes
The primary outcome was the change in body fat mass, measured by bioelectrical impedance analysis (DBA-210, software V.3.5, Donghuayuan Medical) after overnight fasting for at least 10 h before and after the intervention.
Anthropometric assessments and sample collections
At baseline and the end of the 8-week intervention, after overnight fasting for at least 10 h, anthropometric indicators, including height, body weight, body composition, waist circumference, hip circumference, blood pressure, resting heart rates and triceps skinfold thickness, were assessed71, and sample collections (venous blood, urine and feces) were conducted in the morning. The conditions for anthropometric assessments and sample collections were exactly the same at both time points.
Biochemical variables
Blood samples were collected from participants after overnight fasting and used to measure lipid profile (TC, TG, HDL-C and LDL-C), fasting blood glucose, fasting insulin, hepatic function (ALT, AST, GGT) and renal function (creatinine, urea, uric acid).
Physical outcomes
Participants underwent refraction testing to determine the diopter value of their eyes. This was conducted using an autorefractor (Supore, RM-800) by a trained ophthalmologist.
Sports-related outcomes
Assessments of physical fitness72,73,74,75 and sports skills were conducted by professional coaches from Shanghai University of Sport during the school’s PE classes. A 5-min warm-up involving gentle stretching was required before all fitness tests.
For sit and reach, a yardstick was placed on the floor with tape at the 15-inch mark. Participants sat with their legs extended at right angles to the taped line and reached forward as far as possible, holding the position for 2 s. The distance reached with the fingertips was recorded, with the best of three trials noted.
For 1-min rope skipping, participants adjusted the length of the jump rope and, upon hearing the start command, performed the rope-skipping test. Participants engaged in rope skipping using a count-features jump rope provided by the coach. The number of skips in 1 min was recorded.
Lower-limb muscular fitness was assessed in terms of both muscular endurance and power. (1) Muscular endurance: The lower-limb muscular endurance was tested through a 30-s sit-to-stand test. Participants sat on the chair with their feet flat on the floor, shoulder-width apart. It was ensured that the participant’s back did not rely on the backrest of the chair, and their arms could be crossed over their chest. Then, participants were asked to stand up from the chair without the help of their arms. After standing, they sat back down. They were told to try their best to complete the standing and sitting movements as quickly as possible. The maximum number of repetitions in 30 s and the quality of the observed movements was recorded. (2) Muscular power: The lower-limb muscular power was tested through a standing long jump test75. Participants stood with both feet behind the take-off line, performing a two-footed take-off jump as far as possible. Measurements were taken from the take-off line to the back of the closest heel on landing. The best of three trials was recorded.
Psychological outcomes
The questionnaire interviews were conducted by school psychology teachers, trained by a professional psychologist on the research team, during the lunch break on each visit day. Participants completed the psychological questionnaires and the sports willingness questionnaire in the school counseling room. We assessed various aspects of psychological well-being, dietary habits and sleep quality using the following tools.
The GSES is composed of 10 items, each scored on a 4-point Likert scale, with responses ranging from 1 (not at all true) to 4 (exactly true). The minimum and maximum total scores are 10 and 40, respectively, with lower scores indicating lower levels of self-efficacy.
The RSES comprises 10 items, 5 of which are positively worded (items 1, 3, 4, 7 and 10) and five are negatively worded (items 2, 5, 6, 8 and 9). Scoring for positive items is from 4 (strongly agree) to 1 (strongly disagree), while negative items are reverse-scored from 4 (strongly disagree) to 1 (strongly agree). The total score ranges from 10 to 40, with higher scores indicating higher self-esteem.
The WHO-5 is a concise, 5-item measure designed to assess subjective well-being over the past 2 weeks. Responses are provided on a six-point Likert scale, from ‘0 = At no time’ to ‘5 = All of the time’, yielding a total score that ranges from 0 to 25. Higher scores on this index are indicative of greater subjective well-being.
The PSQI is a self-administered questionnaire that evaluates subjective sleep quality over the past month. It consists of 18 items that assess seven components, each scored from 0 to 3: sleep quality, sleep latency, sleep duration, habitual sleep efficiency, sleep disturbances, use of sleeping medication and daytime dysfunction. The global score for subjective sleep quality is calculated as the sum of these seven components, with a range from 0 to 21, where higher scores denote poorer subjective sleep quality.
The DEBQ encompasses 33 items distributed across three subscales, with scale A (restrained eating) consisting of 10 items, scale B (emotional eating) consisting of 13 items and scale C (external eating) consisting of 10 items. Responses are scored on a 5-point Likert scale, from 1 (never) to 5 (very often), with one item reverse-scored. Higher sum scores for each subscale reflect a greater propensity toward the corresponding overeating behavior.
Sports willingness was measured by a 5-point Likert scale based on the physical activity guidelines of the WHO. It assessed the participants’ willingness to engage in an hour of moderate or higher intensity physical activities every day under certain conditions.
For this study, the Chinese versions of these psychometric scales were utilized to ensure cultural relevance and linguistic accuracy. The details of these questionnaires are shown in Supplementary Materials 5–10.
Standard olfactory test battery
A set of olfactory tests for native Chinese speakers used in this study was developed by the Institute of Psychology, Chinese Academy of Sciences. There are four items in the set of tests, including identification, discrimination, threshold and TDI overall assessments. The olfactory threshold test included 20 felt-tip pens filled with eugenol in a dilution series in decreasing order (from 4% vol/vol to 7.63 × 10⁻⁶% vol/vol), along with a blank pen filled with pure solvent. When one blank pen and one odorized pen were given to participants in a random sequence, they were asked to indicate which pen provided a stronger feeling. The test began with the 12th pen (1.95 × 10⁻³% vol/vol). According to a standard seven-reversal staircase procedure, two consecutive correct responses led to a step ahead, and one incorrect response led to a step backwards. Each shift in the staircase’s direction was referred to as a reversal point. The final odor threshold score was calculated by averaging the last four staircase reversal points, and a higher score indicated a better ability for odor detection. The olfactory discrimination test included 16 triplets of odorized pens, two of which were the same and one of which was unique. After sampling all three odors at random, participants were instructed to identify the unique one. The odor discrimination score was calculated based on the number of correct trials. Participants underwent olfactory threshold and discriminating tests while wearing blindfolds to exclude any potential visual signals. Sixteen distinct odorized pens from the Chinese Smell Identification Test76 were used in the odor identification test. For each odorant, there were four possible descriptions, and participants were asked to choose the optimum description. The odor identification score was calculated based on the number of correct trials. Each odor presentation lasted 2 s, with a 30-s interval between presentations to prevent olfactory fatigue. Additionally, we collected data on medication history within the last 2 weeks and on health status. Participants with conditions that could affect olfaction, such as acute upper respiratory tract infections or nasal pathologies, or with a history of medication use known to impact olfactory function, were not included in the olfactory analysis.
n-back working memory task
Participants were required to determine whether a letter displayed on the screen (the ‘target’ stimulus) matched a prespecified letter or a previously shown letter (the ‘cue’ stimulus). In the 0-back block, the cue was letter ‘X’; in the 1-back block, the cue was the letter shown on the previous screen; and in the 2-back block, the cue was the letter shown two screens earlier. Participants responded by pressing the right button if the target matched the cue and the left button if it did not. Before each block, an instruction screen indicating the task type (0-back, 1-back or 2-back) was shown for 4,000 ms, followed by a 2,000-ms blank screen before the first letter appeared. Letters were displayed for 500 ms, with an interstimulus interval of 2,500 ms. The test comprised nine blocks presented in a random order, with each level containing three blocks with a rest time of 20 s. Each block consisted of 12 stimuli presented over a duration of 42 s. Stimuli were delivered via E-Prime 3.0. Before the formal trial, participants underwent a training session to familiarize themselves with the task. The outcome measures were accuracy and reaction time.
User experience evaluation
The deployment of the REVERIE system was evaluated from adolescents and coaches in the REVERIE sports group. From the adolescent’s perspective, we assessed four dimensions: satisfaction, standardization, accessibility and empathy. Satisfaction assesses the overall contentment of participants following the intervention. Standardization evaluates the extent to which the provided sports guidance aligns with established sports guidelines. Accessibility measures whether participants can obtain guidance in a timely manner during the intervention. Empathy assesses whether the sports guidance is tailored to individual needs and characteristics. Empathy in sports guidance is crucial for fostering positive relationships between coaches and trainees. It involves understanding and acknowledging the feelings, perspectives and experiences of trainees, which can enhance communication, motivation and overall performance. From the coach’s perspective, we evaluated whether the use of the REVERIE system reduced the workload and alleviated the stress and whether they would choose REVERIE system in future intervention work. The details of these questionnaires are shown in Supplementary Materials 12 and 13. For sports ability assessment, adolescents performed 50 repetitions of sports technique with the same degree of difficulty learned during the sports intervention phase. An independent coach recorded the successful counts of sports techniques in table tennis and the total scores of goals in soccer. In table tennis, achieving success in 40–50 counts is graded as an A, 30–40 as a B, 20–30 as a C, and fewer than 20 attempts as a D. In soccer, achieving total scores in 100–85 is graded as an A, 70–85 is graded as a B, 55–70 is graded as a C and fewer than 55 is graded as a D.
Brain activity assessment by fMRI
We used fMRI to observe brain activity (for example, 3.0-Tesla Siemens scanner using a 64-channel head coil), including an echo-planar imaging sequence (repetition time 2,000 ms, echo time 30 ms, slice thickness 2 mm, flip angle 80°, voxel size 2 × 2 × 2 mm3) and a T1-weighted gradient-echo with inversion recovery sequence (repetition time 2,300 ms, echo time 2.26 ms, slice thickness 1 mm, flip angle 8°, voxel size 1 × 1 × 1 mm3). A total of 126 participants received fMRI assessment and were included for analysis. The n-back fMRI task was used as described before to assess working memory.
After converting raw DICOM images to NIFTI format, preprocessing of MRI data was carried out using the RESTplus toolkit (v1.25, http://restfmri.net/forum/restplus/) via MATLAB 2021b (The MathWorks Inc.) including: (1) slice timing; (2) head-motion correction; (3) spatial normalization to the Montreal Neurological Institute template (resampling voxel size = 3 × 3 × 3 mm3); (4) spatial smoothing (6-mm full-width at half maximum Gaussian kernel); (5) detrending and (6) regression of nuisance covariates including Friston 24 head-motion parameters, cerebrospinal fluid signals and white matter signals from the fMRI data. The T1 images were also spatially normalized to the Montreal Neurological Institute atlas space. Participants with excessive head movement or image artifacts were excluded.
Proteomic profiling by LC–MS
Plasma samples were aliquoted in 96-well plates in a randomized order and prepared using the semiautomated liquid transfer workstation (ZhongXi, Suzhou, China). In brief, 5 µl of plasma was diluted in 195 µl of 50 mM ammonium bicarbonate buffer containing 5 mM Tris (2-carboxyethyl) phosphine and 20 mM 2-chloroacetamide for reduction of disulfide bridges and cysteine alkylation. In total, 10 μl of each plasma dilution was used and digested by trypsin at an enzyme-to-protein mass ratio of 1:25 for 2 h at 56 °C. The digested peptides were then desalted with the in-house-made 3 M C18 disk and subjected to vacuum centrifugation dryness for subsequent nano-liquid chromatography with tandem mass spectrometry (LC–MS/MS) analysis.
Nanoflow reversed-phase chromatography was performed on an UltiMate 3000 HPLC system (Thermo Fisher Scientific). Peptides were separated in 15 min at a flow rate of 450 nl min−1 on a 15-cm × 75-µm column with a laser-pulled electrospray emitter packed with 1.7-µm C18 particles. Water and acetonitrile with 0.1% formic acid were mobile phase A and B, respectively. A nonlinear gradient separation process was set to increase from B% at 7–24% within 9 min, 24–37% within 1 min, 37–90% within 1 min, and maintained at 90% for the last 1 min and re-equilibrated at 2% for 2.5 min.
Liquid chromatography was directly interfaced with a hybrid TIMS quadrupole TOF mass spectrometer (Bruker timsTOF Pro) via a CaptiveSpray nano-electrospray ion source. The dual TIMS analyzer operated at an optimal duty cycle close to 100%, with synchronized accumulation and ramp times of 100 ms each. The sample analysis was performed in data-independent mode, incorporating an MS1 scan followed by 80 MS2 windows, utilizing the diaPASEF acquisition scheme covering the mass range from m/z 400 to m/z 1,200. During the scanning mode, the ion mobility was set from 0.7 to 1.4 V s/cm2, and the collision energy was descended linearly as a function of the mobility from 59 eV at 1/K0 = 1.5 V s/cm2 to 20 eV at 1/K0 = 0.6 V s/cm2.
DIA raw files were analyzed using Spectronaut software, version 18.7.240325.55695 (Biognosys Saqan). A hybrid library combining the direct DIA results of all raw files in this study with other plasma spectra libraries in our laboratory was used to search the MS data of the single-shot plasma samples against the Uniprot human database UP000005640 (20,428 entries). Trypsin/P was specified as the cleavage enzyme allowing up to two missing cleavages. Fixed modification settings included carbamidomethylation and variable modifications were methionine oxidation and N-terminal acetylation. The FDR was set to 1% at the peptide precursor level and 1% at the protein level.
The quantification intensity of all plasma samples was obtained from the Spectronaut result files and median normalization was performed. Proteins with missing values in more than half of the samples were removed77. As a result, 840 proteins of a total of 1,318 proteins were retained for subsequent analysis. The missing values of remaining proteins were imputed using the Perseus plugin. Six quality-control (QC) samples were inserted into each plate and randomly arranged along with the other 90 formal samples. Spearman’s correlation coefficient was calculated for all QC runs. In detail, the average correlation coefficient of the QC samples was 0.92 in proteomics (range, 0.866–0.967), demonstrating consistent stability of the MS platform.
Lipidomic and metabolomic profiling by LC–MS
The plasma lipidome and metabolome were also profiled using the semiautomated liquid transfer workstation from ZhongXi Company. In brief, plasma samples (20 μl) were spiked with 10 μl stable isotope-labeled internal standards and diluted with 70 µl isopropanol. After centrifugation of the mixture at 2,225g for 15 min at 4 °C, the supernatant fraction was collected (50 μl) for purification using the in-house-made 3 M C18 disk.
Metabolite and lipid separation was performed on an ultra-performance liquid chromatography Shimadzu Nexera X2 LC-30AD. Waters ACQUITY UPLC BEH HILIC Column (130 Å, 2.1 × 100 mm, 1.7 µm; Waters Corp) was used with an elution flow rate of 300 µl min−1 and 8 min of linear gradient. Mobile phase A contained a 50:50 (vol/vol) acetonitrile/water ratio with 10 mM ammonium acetate (pH 8.0 adjusted with ammonium hydroxide) and mobile phase B was acetonitrile. The gradient elution program was performed as follows: 0 min, 85% B; 4 min, 60% B; 4.3 min, 0% B; 6 min, 0% B; 6.1 min, 85% B; 8 min, 85% B.
MS data acquisition was performed on a hybrid triple-quadrupole/linear ion trap mass spectrometer SCIEX 5500 QTRAP. The operational parameters were set as follows: curtain gas, 35.0; collision gas, medium; temperature, 500 °C; ion source gas 1, 40; ion source gas 2, 50; ion spray voltage in positive mode, 5,500; ion spray voltage in negative mode, −5,500.
Quantitative calculation was based on the peak area ratio of the analyte to the stable isotope-labeled internal standards using MultiQuant 3.0 Software (Sciex). For lipids or small metabolites with ≥80% integrity in plasma samples, missing values were filled using the Perseus plugin. Six QC samples were inserted into each plate and randomly arranged along with the other 90 formal samples. Spearman’s correlation coefficient was calculated for all QC runs. In detail, the average correlation coefficient of the QC samples was 0.992 in lipidomics (range, 0.979–0.996) and was 0.976 in metabolomics (range, 0.948–0.992), demonstrating consistent stability of the mass spectrometry (MS) platform. After rigorous QC and data preprocessing, 785 lipids and 247 metabolites were used for subsequent analysis.
Fecal sample collection, DNA extraction and sequencing
Fecal samples were collected using a commercial tube with DNA stabilizer (STRATEC Molecular) and stored at −80 °C. Stool DNA was extracted using PSP Spin Stool DNA Kits (STRATEC Molecular) according to the manufacturer’s instructions. A total amount of 0.2 μg DNA per sample was used as input material for the DNA library preparations. Briefly, the genomic DNA sample was fragmented by Covaris LE220R-plus to a size of 350 bp. Then DNA fragments were end polished, A-tailed and ligated with the full-length adaptor for Illumina sequencing, followed by further PCR amplification. PCR products were purified using the AMPure XPsystem (Beckman Coulter). Subsequently, library quality was assessed on the Agilent 5400 system (AATI) and quantified by real-time PCR (1.5 nM). The qualified libraries were pooled and sequenced on Illumina platforms (Illumina NovaSeq 6000) through a paired-end 150-base-pair strategy in Novogene Bioinformatics Technology, according to effective library concentration and the data amount required.
Metagenomic data QC and taxonomic profiling
For QC of raw metagenomic reads, adaptor sequences and low-quality regions were filtered using Trimmomatic version 0.36. Human DNA contamination was identified and removed by mapping reads against the human reference genome (GRCh38) using BWA mem version 0.7.17. High-quality reads were taxonomically profiled using MetaPhlAn3 with default settings, generating taxonomic relative abundances (total sum scaling normalization) at different taxonomic levels.
Microbial diversity and differential abundance analysis
The alpha diversity indices were calculated using the R package ‘vegan’ and were statistically compared between groups by using the Wilcoxon signed-rank test or rank-sum test with the R package ‘stats’. Beta diversity (Bray–Curtis dissimilarity, weighted and unweighted UniFrac distance) was calculated with the R package ‘phyloseq’. Differences in the overall microbiome communities between groups were statistically assessed by using the function adonis (999 permutations) in the R package ‘vegan’ to perform a permutational multivariate analysis of variance. After a prevalence cutoff of 10%, differentially abundant species before and after each intervention were identified by two-sided Wilcoxon signed-rank test using the R package ‘stats’. P values were adjusted by an FDR method78, and a FDR < 0.25 was deemed significant unless otherwise stated.
Data visualization
All figures were generated by R software using ggplot2, pheatmap and circlize packages, or by Python software using matplotlib and seaborn packages, or by GraphPad Prism 9.0, except the association networks that were visualized in Cytoscape (v3.9).
Statistical analysis
Analyses were performed using SPSS (version 25.0), STATA software (version 14.0; Stata Corporation), R software (version 4.4.1), GraphPad Prism (version 9.0; Dotmatics) and Python (version 3.9.19). The third-party Python packages Statsmodels (version 0.14.2) and Numpy (Version 2.0.0) were used. Comparisons were made between the physical sports group and the control group, as well as between the REVERIE sports group and the control group. Additionally, comparisons between the physical and REVERIE sports groups were conducted in an exploratory manner. Missing outcome data were handled using Multivariate Imputation by Chained Equations79. The imputation model included baseline values of the target outcome, sex, age and group allocation. Data were presented as the mean ± s.d., median (IQR) and percentages. The Kolmogorov–Smirnov test was used to assess the normality of data distribution.
All randomized participants with at least one baseline observation were included in the modified intention-to-treat analysis. The paired Student’s t-test was applied to compare the within-group changes. Changes in clinical data before and after the interventions were compared among the physical sports group, REVERIE sports group and the control group using covariance analysis followed by a Fisher’s LSD post hoc test, with the baseline variable levels serving as covariates. Changes in clinical data assessed at multiple time points were analyzed using a linear mixed model adjusted for baseline variable levels. The comparison of sports abilities and deployment outcomes were analyzed using a chi-squared test. The comparison of SSQ and immersion were analyzed using unpaired Student’s t-tests.
fMRI data were analyzed by Statistical Parametric Mapping 12 (SPM12, Welcome Trust Center for Neuroimaging, United Kingdom; http://www.fil.ion.ucl.ac.uk/spm/) under the MATLAB 2021b (The MathWorks Inc.) environment. In the first-level analysis, the load levels of interest corresponding to 1-back versus 0-back, 2-back versus 1-back and 2-back versus 0-back were modeled. In the second-level analysis, a flexible factorial design analysis was performed to find out the differences in brain activation in terms of the group-by-time interaction. Then two-tailed paired Student’s t-tests were used to explore the intervention effects within physical and REVERIE sports groups, specifically, the changes occurring after the intervention compared with before the intervention. The significant voxel threshold was set at P < 0.05, with a z-threshold of 2.33 and cluster size ≥ 20 voxels. The signal values corresponding to these ROIs were extracted and subjected to Spearman’s correlation analysis with clinical, behavioral, omics indicators, and so on. PPI analysis80 was performed in SPM12 to examine the functional connectivity within and between the networks (categorized from the results of previous paired Student’s t-tests) under different task loads. Two-tailed paired Student’s t-tests of PPI values were conducted within each group to observe alterations before and after sports interventions.
Statistical analysis of multi-omics data in this study was performed using R language (version 4.2.1, https://www.R-project.org/). P values of a two-tailed paired Student’s t-test (proteome) or a Wilcoxon signed-rank test (lipidome, metabolome and metagenome), depending on whether a normal distribution was followed, were calculated for each group before and after exercise and were corrected for multiple hypothesis testing (FDR). For metabolites and complex lipids, enrichment was calculated using the Fisher’s exact test (one-sided) with pathway/chemical class annotation of all processed metabolites/lipids. Protein enrichment analysis of biological function was performed with David 6.8 (FDR < 0.25). Reported lipoproteins and neurological-related or cognitive-related proteins, which showed significant changes after REVERIE sports (two-tailed paired Student’s t-test, P < 0.05), were also used in subsequent correlation analysis with cognitive indicators. Spearman’s correlation analysis was performed between significantly changed features of different omics datasets, or between significantly changed features of each omics dataset and the significantly altered clinical phenotypes or ROIs, using either their changes (after/before, for lipids, metabolites, phenotypic measures, ROIs) or log2-transformed fold changes (after/before, for microbial species and proteins).
We used the Bonferroni correction (0.05/number of tests performed) for multiple testing of the primary outcome. With the exception of the primary outcome measure, whose significance was ascertained by using a two-tailed P < 0.025, all remaining statistical tests were executed with a two-tailed significance level fixed at P < 0.05, unless otherwise specified.
Reporting summary
Further information on research design is available in the Nature Portfolio Reporting Summary linked to this article.
Data availability
Individual-level participant data are not publicly available but can be made accessible by obtaining informed consent from the Data Management Committee of the institution. Interested investigators can obtain and certify the data transfer agreement and submit requests to Huating Li. Investigators who consent to the terms of the data transfer agreement, including, but not limited to, the use of these data only for academic purposes, and to protect the confidentiality of the data and limit the possibility of identification of participants, will be granted access. The requests for access to data will be responded to within 1 month. All data shared will be de-identified.
The raw lipidomics, metabolomics and proteomics data generated during this study are available at The National Omics Data Encyclopedia under accession OEP005446. The raw metagenomic sequencing data have been deposited in the NCBI Sequencing Read Archive under accession number PRJNA1227979. Source data are provided with this paper.
Code availability
REVERIE system source code and demo videos are available at https://github.com/LittleQBerry/REVERIE-Sports/.
References
Jebeile, H., Kelly, A. S., O’Malley, G. & Baur, L. A. Obesity in children and adolescents: epidemiology, causes, assessment, and management. Lancet Diabetes Endocrinol. 10, 351–365 (2022).
Hannon, T. S. & Arslanian, S. A. Obesity in adolescents. N. Engl. J. Med. 389, 251–261 (2023).
Laurent, J. S. et al. Associations among body mass index, cortical thickness, and executive function in children. JAMA Pediatr. 174, 170–177 (2020).
Zeng, Q., Li, N., Pan, X. F., Chen, L. & Pan, A. Clinical management and treatment of obesity in China. Lancet Diabetes Endocrinol. 9, 393–405 (2021).
Stankov, I., Olds, T. & Cargo, M. Overweight and obese adolescents: what turns them off physical activity? Int. J. Behav. Nutr. Phys. Act. 9, 53 (2012).
Li, H., Li, W., Zhao, Q. & Li, M. Including overweight and obese students in physical education: an urgent need and effective teaching strategies. J. Phys. Educ. Recreat. Dance 88, 33–38 (2017).
Sfm, C. et al. Inequality in physical activity, global trends by income inequality and gender in adults. Int. J. Behav. Nutr. Phys. Act. 17, 142 (2020).
Skibba, R. Virtual reality comes of age. Nature 553, 402–403 (2018).
Yan, M. et al. Effects of virtual reality combined cognitive and physical interventions on cognitive function in older adults with mild cognitive impairment: a systematic review and meta-analysis. Ageing Res. Rev. 81, 101708 (2022).
Frankiewicz, M., Vetterlein, M. W. & Matuszewski, M. VR, reconstructive urology and the future of surgery education. Nat. Rev. Urol. 20, 325–326 (2023).
Neumann, D. L. et al. A systematic review of the application of interactive virtual reality to sport. Virtual Real. 22, 183–198 (2018).
Vlake, J. H. et al. Reporting the early stage clinical evaluation of virtual-reality-based intervention trials: RATE-VR. Nat. Med. 29, 12–13 (2023).
Wu, Q. et al. Effect of virtual reality-based exercise and physical exercise on adolescents with overweight and obesity: study protocol for a randomised controlled trial. BMJ Open 13, e075332 (2023).
Bull, F. C. et al. World Health Organization 2020 guidelines on physical activity and sedentary behaviour. Br. J. Sports Med. 54, 1451–1462 (2020).
López-Valenciano, A. et al. Epidemiology of injuries in professional football: a systematic review and meta-analysis. Br. J. Sports Med. 54, 711–718 (2020).
Zhang, Z. et al. Olfactory dysfunction mediates adiposity in cognitive impairment of type 2 diabetes: insights from clinical and functional neuroimaging studies. Diabetes Care 42, 1274–1283 (2019).
Summers, S. A., Chaurasia, B. & Holland, W. L. Metabolic messengers: ceramides. Nat. Metab. 1, 1051–1058 (2019).
Dodge, J. C. et al. Glucosylceramide synthase inhibition reduces ganglioside GM3 accumulation, alleviates amyloid neuropathology, and stabilizes remote contextual memory in a mouse model of Alzheimer’s disease. Alzheimers Res. Ther. 14, 19 (2022).
MahmoudianDehkordi, S. et al. Altered bile acid profile associates with cognitive impairment in Alzheimer's disease—an emerging role for gut microbiome. Alzheimers Dement. 15, 76–92 (2019).
Cristofano, A. et al. Serum levels of acyl-carnitines along the continuum from normal to Alzheimer’s dementia. PLoS ONE 11, e0155694 (2016).
Park, S., Sadanala, K. C. & Kim, E. K. A metabolomic approach to understanding the metabolic link between obesity and diabetes. Mol. Cells 38, 587–596 (2015).
Powers, S. K., Goldstein, E., Schrager, M. & Ji, L. L. Exercise training and skeletal muscle antioxidant enzymes: an update. Antioxidants 12, 39 (2022).
Contrepois, K. et al. Molecular choreography of acute exercise. Cell 181, 1112–1130.e16 (2020).
Kim, H. et al. Investigation of memory-enhancing effects of Streptococcus thermophilus EG007 in mice and elucidating molecular and metagenomic characteristics using nanopore sequencing. Sci. Rep. 12, 13274 (2022).
Lee, K. E. et al. The extracellular vesicle of gut microbial Paenalcaligenes hominis is a risk factor for vagus nerve-mediated cognitive impairment. Microbiome 8, 107 (2020).
Rosell-Diaz, M. et al. Gut microbiota links to serum ferritin and cognition. Gut Microbes 15, 2290318 (2023).
Liu, H., Wang, Z., Mousas, C. & Kao, D. Virtual reality racket sports: virtual drills for exercise and training. In Proc. 2020 IEEE International Symposium on Mixed and Augmented Reality (ISMAR) (eds Guan, F. & Xia, X.) 566–576 (IEEE, 2020).
Brtsch, K. et al. Influence of virtual reality soccer game on walking performance in robotic assisted gait training for children. J. Neuroeng. Rehabil. 7, 15 (2010).
Ferreira Silva, R. M. et al. Barriers to high school and university students’ physical activity: a systematic review. PLoS ONE 17, e0265913 (2022).
MoTrPAC Study Group; Lead Analysts; MoTrPAC Study Group. Temporal dynamics of the multi-omic response to endurance exercise training. Nature 629, 174–183 (2024).
Lowe, C. J., Reichelt, A. C. & Hall, P. A. The prefrontal cortex and obesity: a health neuroscience perspective. Trends Cogn. Sci. 23, 349–361 (2019).
Hanakawa, T., Dimyan, M. A. & Hallett, M. Motor planning, imagery, and execution in the distributed motor network: a time-course study with functional MRI. Cereb. Cortex 18, 2775–2788 (2008).
de Sousa Maciel, I. et al. Plasma proteomics discovery of mental health risk biomarkers in adolescents. Nat. Mental Health 1, 596–605 (2023).
Zhang, L., Zhang, Z., Xu, L. & Zhang, X. Maintaining the balance of intestinal flora through the diet: effective prevention of illness. Foods 10, 2312 (2021).
Ortega, F. B. et al. Effects of an exercise program on brain health outcomes for children with overweight or obesity: the ActiveBrains Randomized Clinical Trial. JAMA Netw. Open 5, e2227893 (2022).
Jernigan, T. L., Brown, S. A. & Dowling, G. J. The Adolescent Brain Cognitive Development study. J. Res. Adolesc. 28, 154–156 (2018).
Chaarani, B. et al. Baseline brain function in the preadolescents of the ABCD Study. Nat. Neurosci. 24, 1176–1186 (2021).
Voss, M. W., Nagamatsu, L. S., Liu-Ambrose, T. & Kramer, A. F. Exercise, brain, and cognition across the life span. J. Appl. Physiol. 111, 1505–1513 (2011).
Erickson, K. I. et al. Physical activity, cognition, and brain outcomes: a review of the 2018 Physical Activity Guidelines. Med. Sci. Sports Exerc. 51, 1242–1251 (2019).
Baumeister, J. et al. Cognitive cost of using augmented reality displays. IEEE Trans. Vis. Comput. Graph. 23, 2378–2388 (2017).
Yeung, A. W. K. et al. Virtual and augmented reality applications in medicine: analysis of the scientific literature. J. Med. Internet Res. 23, e25499 (2021).
Dunst, B. et al. Neural efficiency as a function of task demands. Intelligence 42, 22–30 (2014).
Neubauer, A. C. & Fink, A. Intelligence and neural efficiency. Neurosci. Biobehav. Rev. 33, 1004–1023 (2009).
Stanmore, E., Stubbs, B., Vancampfort, D., de Bruin, E. D. & Firth, J. The effect of active video games on cognitive functioning in clinical and non-clinical populations: a meta-analysis of randomized controlled trials. Neurosci. Biobehav. Rev. 78, 34–43 (2017).
Howard, M. C. A meta-analysis and systematic literature review of virtual reality rehabilitation programs. Comput. Hum. Behav. 70, 317–327 (2017).
Cotman, C. W. & Berchtold, N. C. Exercise: a behavioral intervention to enhance brain health and plasticity. Trends Neurosci. 25, 295–301 (2002).
Constantinidis, C. & Klingberg, T. The neuroscience of working memory capacity and training. Nat. Rev. Neurosci. 17, 438–449 (2016).
Boroshok, A. L. et al. Individual differences in frontoparietal plasticity in humans. NPJ Sci. Learn. 7, 14 (2022).
Cussotto, S., Sandhu, K. V., Dinan, T. G. & Cryan, J. F. The neuroendocrinology of the microbiota-gut-brain axis: a behavioural perspective. Front. Neuroendocrinol. 51, 80–101 (2018).
Ye, H. et al. Ecophysiology and interactions of a taurine-respiring bacterium in the mouse gut. Nat. Commun. 14, 5533 (2023).
Willyard, C. How gut microbes could drive brain disorders. Nature 590, 22–25 (2021).
de Melo, P. S. et al. A mechanistic analysis of the neural modulation of the inflammatory system through vagus nerve stimulation: a systematic review and meta-analysis. Neuromodulation 28, 43–53 (2024).
Miranda, A. M. et al. Differential lipid composition and regulation along the hippocampal longitudinal axis. Transl. Psychiatry 9, 144 (2019).
Maulik, M., Westaway, D., Jhamandas, J. H. & Kar, S. Role of cholesterol in APP metabolism and its significance in Alzheimer’s disease pathogenesis. Mol. Neurobiol. 47, 37–63 (2013).
Clemenson, G. D. & Stark, C. E. Virtual environmental enrichment through video games improves hippocampal-associated memory. J. Neurosci. 35, 16116–16125 (2015).
Guthold, R., Stevens, G. A., Riley, L. M. & Bull, F. C. Global trends in insufficient physical activity among adolescents: a pooled analysis of 298 population-based surveys with 1.6 million participants. Lancet Child Adolesc. Health 4, 23–35 (2020).
Patton, G. C. et al. Our future: a Lancet commission on adolescent health and wellbeing. Lancet 387, 2423–2478 (2016).
Steinbeck, K. S., Lister, N. B., Gow, M. L. & Baur, L. A. Treatment of adolescent obesity. Nat. Rev. Endocrinol. 14, 331–344 (2018).
Freeman, D. et al. Automated psychological therapy using immersive virtual reality for treatment of fear of heights: a single-blind, parallel-group, randomised controlled trial. Lancet Psychiatry 5, 625–632 (2018).
Sutherland, I. E. The ultimate display. In Proc. International Federation for Information Processing (IFIP) Congress (ed. Kalenich, W. A.) 506–508 (IFIP, 1965).
Lyu, C. et al. Rtmdet: an empirical study of designing real-time object detectors. Preprint at https://arxiv.org/abs/2212.07784 (2022).
Rengarajan, D., Vaidya, G., Sarvesh, A., Kalathil, D. & Shakkottai, S. Proc. 10th International Conference on Learning Representations (ICLR) (OpenReview.net, 2022).
Grondman, I., Busoniu, L., Lopes, G. A. D. & Babuska, R. A survey of actor-critic reinforcement learning: standard and natural policy gradients. IEEE Trans. Syst. Man Cybern. C 42, 1291–1307 (2012).
Kaiser, L. et al. Proc. 8th International Conference on Learning Representations (ICLR) (OpenReview.net, 2020).
Liu, M., Zhu, M. & Zhang, W. Goal-conditioned reinforcement learning: problems and solutions. In Proc. 31st International Joint Conference on Artificial Intelligence (IJCAI-22) (ed. De Raedt, L.) 5502–5511 (IJCAI, 2022).
Mills, K., Ronagh, P. & Tamblyn, I. Finding the ground state of spin Hamiltonians with reinforcement learning. Nat. Mach. Intell. 2, 509–517 (2020).
Abbott, A. Think outside the brain box. Nature 596, 181–182 (2021).
National Health and Family Planning Commission of the People’s Republic of China WS/T 586-2018 Screening for Overweight and Obesity Among School-Age Children and Adolescents (China Standard Press, 2018).
Chinese Nutrition Society Dietary Guidelines for Chinese Residents: 2022 (People’s Medical Publishing House, 2022).
Nutrition and Metabolic Management Branch of China International Exchange and Promotive Association for Medical and Health Care, Clinical Nutrition Branch of Chinese Nutrition Society, Chinese Diabetes Society, Chinese Society for Parenteral and Enteral Nutrition, Chinese Clinical Nutritionist Center of Chinese Medical Doctor Association. Guidelines for medical nutrition treatment of overweight/obesity in China (2021). Asia Pac. J. Clin. Nutr. 31, 450–482 (2022).
Ni, Y. et al. Resistant starch decreases intrahepatic triglycerides in patients with NAFLD via gut microbiome alterations. Cell Metab. 35, 1530–1547.e8 (2023).
Ministry of Education of the People’s Republic of China. National Student Physical Health Standard: 2014 Revision (China Standards Press, 2014).
Ruiz, J. R. et al. Field-based fitness assessment in young people: the ALPHA health-related fitness test battery for children and adolescents. Br. J. Sports Med. 45, 518–524 (2011).
Committee on Fitness Measures and Health Outcomes in Youth; Food and Nutrition Board; Institute of Medicine in Fitness Measures and Health Outcomes in Youth (eds. Pillsbury, L. et al.) Ch. 6 (National Academies Press, 2013).
Ortega, F. B. et al. The Youth Fitness International Test (YFIT) battery for monitoring and surveillance among children and adolescents: a modified Delphi consensus project with 169 experts from 50 countries and territories. J. Sport Health Sci. 14, 101012 (2024).
Feng, G. et al. Development of the Chinese Smell Identification Test. Chem. Senses 44, 189–195 (2019).
Jiang, Y. et al. Proteomics identifies new therapeutic targets of early-stage hepatocellular carcinoma. Nature 567, 257–261 (2019).
Benjamini, Y. & Hochberg, Y. Controlling the false discovery rate: a practical and powerful approach to multiple testing. J. R. Stat. Soc. B 57, 289–300 (1995).
Van Buuren, S. & Groothuis-Oudshoorn, K. MICE: multivariate imputation by chained equations in R. J. Stat. Softw. 45, 1–67 (2011).
Friston, K. J. et al. Psychophysiological and modulatory interactions in neuroimaging. Neuroimage 6, 218–229 (1997).
Acknowledgements
This study was funded by the National Key R&D Program of China (grant no. 2023YFC3305804), Project on the Practice Community for Educational Informatization Teaching Applications (2021) to Jihong Wang; Noncommunicable Chronic Diseases-National Science and Technology Major Project (2024ZD0523205) to Huating Li; Strategic Priority Research Program of the Chinese Academy of Sciences (CAS; XDB38000000) to R.Z.; Noncommunicable Chronic Diseases-National Science and Technology Major Project (2023ZD0509201, 2023ZD0509202), the National Natural Science Foundation of China (62272298) and Shanghai Municipal Science and Technology Major Project (2021SHZDZX0102) to B.S.; the National Key R&D Program of China (2022YFA1004804), Major Research Plan of National Natural Science Fund of China (NSFC; 92357305), Excellent Young Scientists Fund of NSFC (82022012), General Fund of NSFC (82270907), innovative research team of high-level local universities in Shanghai (SHSMU-ZDCX20212700), Shanghai Municipal Key Clinical Specialty and Shanghai Research Center for Endocrine and Metabolic Diseases (2022ZZ01002) to Huating Li; National Key R&D Program (2022YFC2502800), National Natural Science Fund of China (82388101) and Beijing Natural Science Foundation (IS23096) to T.Y.W.
Ethics declarations
Competing interests
B.S., Huating Li, Y.Q., Q. Wu, Q. Wang and Haoxuan Li are inventors on a pending invention disclosure related to this work filed by Shanghai Sixth People’s Hospital and Shanghai Jiao Tong University (no. PCT/CN2025/071039, filed in January 2025). The other authors declare no competing interests.
Peer review
Peer review information
Nature Medicine thanks Rachel Kelly, David Nieman, Francisco Ortega and the other, anonymous, reviewer(s) for their contribution to the peer review of this work. Primary Handling Editors: Lorenzo Righetto and Ashley Castellanos-Jankiewicz, in collaboration with the Nature Medicine team.
Additional information
Publisher’s note Springer Nature remains neutral with regard to jurisdictional claims in published maps and institutional affiliations.
Extended data
Extended Data Fig. 1 Schematic overview of the template-driven and feedback-oriented deep reinforcement learning method in REVERIE-Agent Module.
In the digital twin stage, the REVERIE Coach based on the transformer network, is trained in VR sports environment conditioned on pre-set coaching templates to master standardised instructions of sports techniques. In the AI-human interaction stage, the REVERIE Coach is fine-tuned based on feedback from REVERIE Coach-adolescent interactions to develop personalised instructions of sports techniques tailored to each adolescent. Upon completion of the two-stage, we obtain REVERIE Coach capable of delivering empathetic sports guidance to each adolescent.
Extended Data Fig. 2 Evaluation of REVERIE system.
REVERIE table tennis (a) and soccer (b). (c) Compared success probability curves among REVERIE system, general and goal-based DRL methods on table tennis and soccer. (d) Ablation study results of REVERIE system and REVERIE system without coaching templates on table tennis and soccer. In (c) and (d), the curves display the median values with shaded areas showing the upper and lower boundaries. (e) Factor scores for control, sensory, distraction, and realism compare Eleven Table Tennis with REVERIE table tennis, and Football Nation VR with REVERIE soccer. (f-g) Total Simulator Sickness Questionnaire (SSQ) scores of the REVERIE system versus a version without the Rendering Module for table tennis (f, p = 0.047) and soccer (g, p = 0.035). (h) %HRmax curves of participants in REVERIE table tennis and soccer. (i) Borg Rating of Perceived Exertion (RPE) scores of participants after REVERIE table tennis and soccer. In (e–g) and (i), black dots represent individual data points (n = 40), the box boundaries indicate the first and third quartiles, the thick black line is the median, and the thin black line marks the whisker bounds. Two-sided unpaired (e) and paired (f-g) Student’s t test were used. (j-k) The magnitude of the ball’s initial linear velocity under varying accelerometer outputs in both Physical and REVERIE table tennis (j) and soccer (k). (l-m) Participant movements (depicted as skeletons) and forces (red and blue arrows) are shown for forehand attack and backhand push instructions in Physical and REVERIE table tennis. These images capture the end of the forehand backswing, the moment of impact, the end of the backhand backswing, and its impact. (n-o) Participant movements and forces under heading and shooting instructions are depicted for Physical and REVERIE soccer. Red arrows show ground reaction forces on force platforms and blue arrows show forces applied to the participants’ bodies. For (j-k), multiple linear regression analysed the ball’s initial velocity (dependent variable) with accelerometer output and group number (independent variables); the P value indicates the interaction between output and group. DRL, Deep reinforcement learning. P < 0.05*, P < 0.001***.
Extended Data Fig. 3 Effects of Physical and REVERIE sports interventions on metabolic-related outcomes.
(a) Average heart rate (HR) and (b) average exercise intensity during intervention sports classes (n = 51 in Physical; n = 79 in REVERIE). (c) The attendance that participants adhered to exercise classes (n = 85 in Physical; n = 80 in REVERIE). (d) The days that participants adhered to dietary recommendation (n = 46 in control; n = 85 in Physical; n = 80 in REVERIE). Effects of interventions on (e) fat mass, (f) body weight, (g) fat-free mass (FFM) percentage, (h) alanine aminotransferase (ALT), (i) gamma-glutamyl transferase (GGT), (j) total cholesterol (TC), (k) triglycerides (TG) and (l) low-density lipoprotein cholesterol (LDL-C). In a-c, unpaired Student’s t test was performed to compare the differences between Physical and REVERIE sports groups. In d, one-way ANOVA with Fisher’s LSD post hoc was performed to analyse differences among groups. (e-l) n = 47 in control; n = 89 in Physical; n = 91 in REVERIE. Paired Student’s t test was performed to verify changes from baseline (intragroup changes). A capped line with † indicates a significant intragroup difference (P < 0.05 †, P < 0.01 ††, P < 0.001 †††). Intragroup P values were 0.002 (body weight in REVERIE), 0.004 (GGT in REVERIE), 0.001 (TC in Physical), 0.007 (TG in REVERIE), and 0.003/0.001 (LDL-C in Physical/REVERIE). Intergroup changes were compared by ANCOVA (or a linear mixed model) adjusted for baseline, followed by Fisher’s LSD. A bar marked with * indicates significance of vs. control (P < 0.05 *, P < 0.01 **, P < 0.001 ***). P values were 0.004 (body weight, REVERIE-control), 0.003 (GGT, REVERIE-control), 0.005 (TC, REVERIE-control), 0.012 (TG, REVERIE-control), and 0.015/0.001 (LDL-C in Physical/REVERIE-control). A line with # under the groups indicates significance between Physical and REVERIE sports group (P < 0.05 #, P < 0.01 ##); p values were 0.036 (TC) and 0.008 (TG). Data are shown as box-and-whisker plots (median, quartiles, 5th-95th percentiles, and outliers as points). All P values are two-sided and not adjusted for multiple testing.
Extended Data Fig. 4 Changes in physical fitness, psychological status, body weight, BMI, sports willingness outcomes between baseline and 6-month follow-up.
Changes in physical fitness including sit and reach (a), 30 sec sit-to-stand test (b), standing long jump (c), 1 min rope skipping (d); psychological outcomes including GSES (e), RSES (f), WHO-5 (g), PSQI (h), Overall eating (i), Restrained eating (j), Emotional eating (k), External eating (l); body weight (m) and BMI (n) at 6-month follow-up among different groups. Overall eating and three subscales including Emotional eating, External eating and Restrained eating were assessed using Dutch Eating Behaviour Questionnaire. In a-n, Differences were assessed using linear mixed model adjusted for baseline values. (o) Sports willingness changes between baseline and 6-month follow-up. Differences were assessed using generalized linear mixed model adjusted for baseline values. P values are two-sided and not adjusted for multiple testing. For a, n = 46 in control; n = 87 in Physical; n = 87 in REVERIE. For b, n = 41 in control; n = 85 in Physical; n = 82 in REVERIE. For c, n = 45 in control; n = 88 in Physical; n = 87 in REVERIE. For d, n = 40 in control; n = 86 in Physical; n = 86 in REVERIE. For e-l and o, n = 45 in control; n = 85 in Physical; n = 85 in REVERIE. For m and n, n = 42 in control; n = 79 in Physical; n = 81 in REVERIE. GESE: General Self-Efficacy Scale; RSES: Rosenberg Self-Esteem Scale; PSQI: Pittsburgh Sleep Quality Index; WHO-5: the five-item World Health Organization Well-Being Index; BMI: body mass index.
Extended Data Fig. 5 Effects of Physical and REVERIE sports interventions on cognition-related outcomes.
(a) Schematic diagram of olfactory test. Change in (b) threshold score, (c) discrimination score, (d) identification score, (e) overall threshold-discrimination-identification score (TDI score) of olfactory tests. (f) Schematic diagram of behavioural experiments. For b-e, n = 35 in control; n = 52 in Physical; n = 48 in REVERIE. Change in (g) accuracy of 2-back task, (h-j) reaction time of 0-, 1- and 2-back task of behavioural experiments. For g-j, n = 23 in control; n = 43 in Physical; n = 40 in REVERIE. Data are shown as box-and-whisker plots. Box plot, median and quartiles; whiskers, 5th and the 95th percentiles. Points represent values outside the 5%-95% range. Two-sided paired Student’s t test was performed to verify changes from baseline (intragroup changes). When the difference is significant, a capped line is marked above the group concerned with the †. P < 0.05 †, P < 0.01 ††, P < 0.001 †††. Intragroup P values were 0.005 (identification score in REVERIE), 0.001, 0.009, 0.008 (reaction time of 0, 1, 2 back in Physical), 0.046 and 0.042 (reaction time of 0-back and 1back in REVERIE). The comparison of differential values among the three groups (intergroup changes) were performed using two-sided ANCOVA followed by a Fisher’s LSD post hoc test, with baseline levels serving as covariates. When the test is significant, a line is marked above the concerned groups with the *. P < 0.05 *, P < 0.01 **, P < 0.001 ***. P values were 0.010 (identification score, REVERIE-Physical), 0.001 (2-back accuracy, REVERIE-Physical), 0.002/0.041 (0-back reaction time, Physical/REVERIE-control), 0.003/0.008 (1-back reaction time, Physical/REVERIE-control), 0.013 (2-back reaction time, Physical-control).
Extended Data Fig. 6 Multi-omic remodelling after Physical and REVERIE sports interventions.
(a) Comparison of the overall changes (V3-V1) before and after sports interventions in lipidome (left), metabolome (middle) and proteome (right) among three intervention groups using partial least squares-discriminant analysis (PLS-DA). The axes represent the first two components (latent variables that maximize the separation among groups). (b) The overlap of multi-omic changes after each intervention using two-tailed paired Student’s t test or Wilcoxon signed-rank test (P < 0.05). The numbers in the bubbles indicate the number of changed circulating molecules in three intervention groups. Comparison of microbiota (c) alpha (Shannon index and Simpson index) and (d) beta diversity (weighted UniFrac distance). Control, n = 26; Physical, n = 52; REVERIE, n = 48. (e) Microbial species with significantly changed abundances after 8-week intervention (P < 0.05, two-tailed Wilcoxon signed-rank test). V1, visit 1 or baseline; V3, visit 3 or after 8-week intervention. Boxplots in c show median (centerlines), lower/upper quartiles (box limits), and whiskers (the last data points 1.5 times the interquartile range (IQR) from the lower or upper quartiles).
Extended Data Fig. 7 Enrichment analysis of differential plasma molecules in response to Physical and REVERIE sports interventions.
(a-b) Enrichment analysis of significantly changed (a) lipids or (b) metabolites after sports interventions using different confidence levels (two-tailed wilcoxon signed-rank test, FDR < 0.25 on the left and P < 0.05 on the right). (c-d) Enrichment of biological functions for significantly changed proteins in response to interventions using different confidence levels (two-tailed paired Student’s t test, FDR < 0.25 in c, P < 0.05 in d). (e) Some significantly changed circulating molecules after 8-week Physical and REVERIE sports (two-tailed paired Student’s t test or Wilcoxon signed-rank test, P < 0.05). (f) Heatmap of changes (V3-V1) in lipoproteins and neurological- or cognitive-related proteins after each intervention. These proteins have been reported to be related to cognition and showed significantly changed after REVERIE sports (two-tailed paired Student’s t test, P < 0.05), which were further used in subsequent correlation analysis with cognitive indicators. FDR < 0.25 + , FDR < 0.1 + + , FDR < 0.05 + + + . SM, sphingomyelin; TAG, triacylglycerol; DAG, diacylglycerol; FA, fatty acids; PC, phosphatidylcholine. V1, visit 1 or baseline; V3, visit 3 or after 8-week intervention. Abbreviations of multi-omics molecules are shown in Supplementary Table 13.
Extended Data Fig. 8 Correlations between changes in multi-omic signatures and the alterations in indicators related to metabolic, physical and psychological health.
Chord diagram displaying the interconnectivity (Spearman’s correlation, P < 0.05) among significant changes in multi-omic signatures and changes in metabolic (a, b), physical fitness indicators (c, d), and mental health and sports willingness indicators (e, f) in response to Physical (a, c, e) and REVERIE sports (b, d, f). Detailed results are shown in Supplementary Table 10 and 11. Link colours in red and blue represent positive and negative correlations, respectively. BMI, body mass index; FM, fat mass; FMP, fat mass percentage; WHtR, waist-to-height ratio; ALT, alanine transaminase; AST, aspartate transaminase; GGT, gamma-glutamyl transferase; UA, urea acid; TC, total cholesterol; TG, triglycerides; LDL-C, low-density lipoprotein cholesterol; GESE, the General Self-Efficacy Scale; RSES, Rosenberg Self-Esteem Scale; PSQI, Pittsburgh Sleep Quality Index; WHO-5, the five-item World Health Organization Well-Being Index. Overall eating and three subscales including Emotional eating, External eating and Restrained eating were assessed using Dutch Eating Behaviour Questionnaire. Abbreviations of multi-omics molecules are shown in Supplementary Table 13.
Extended Data Fig. 9 Correlation between changes in multi-omic signatures and the alterations in indicators related to cognitive function.
(a-b) Chord diagram showing the interconnectivity (Spearman’s correlation, P < 0.05) among significant changes in multi-omic signatures and changes in cognitive indicators after Physical (a) or REVERIE (b) sports intervention. Link colours in red and blue represent positive and negative correlations, respectively. (c) Crosstalk among brain cognitive function, circulating molecules, and gut microbiota. Links were based on Spearman’s correlations (P < 0.05) between circulating molecules and intestinal bacteria (brown), between circulating molecules themselves (blue), as well as between multi-omic signatures and brain indicators (brain activation in regions of interest and cognitive indicators) (red). The correlations between different signatures were preserved when they were both closely related to neural activities and cognitive indicators. Detailed results are shown in Supplementary Table 10-12. Node size represents the number of correlated multi-omic signatures. Node shape indicates data type. Reported lipoproteins and neurological- or cognitive-related proteins, which showed significant changes after REVERIE sports (two-tailed paired Student’s t test, P < 0.05), were also used in subsequent correlation analysis with cognitive indicators. RT, reaction time; ACC, accuracy; TDI score, overall threshold-discrimination-identification score of olfactory tests; Supp, supplementary. Abbreviations of multi-omics molecules are shown in Supplementary Table 13.
Extended Data Fig. 10 Deployment evaluation of REVERIE system.
(a) The satisfaction, standardisation, accessibility and empathy of the REVERIE system were evaluated by 170 participants. (b) The deployment evaluation was assessed by 16 coaches in the REVERIE sports group. (c) The sports abilities of participants in Physical and REVERIE sports groups were evaluated by independent coaches at baseline and after 8-week intervention. The data were analysed using a two-sided chi-square test. A, B, C, D: the different levels of sports ability, where A represents the best, and D represents the worst.
Supplementary information
Rights and permissions
Open Access This article is licensed under a Creative Commons Attribution-NonCommercial-NoDerivatives 4.0 International License, which permits any non-commercial use, sharing, distribution and reproduction in any medium or format, as long as you give appropriate credit to the original author(s) and the source, provide a link to the Creative Commons licence, and indicate if you modified the licensed material. You do not have permission under this licence to share adapted material derived from this article or parts of it. The images or other third party material in this article are included in the article’s Creative Commons licence, unless indicated otherwise in a credit line to the material. If material is not included in the article’s Creative Commons licence and your intended use is not permitted by statutory regulation or exceeds the permitted use, you will need to obtain permission directly from the copyright holder. To view a copy of this licence, visit http://creativecommons.org/licenses/by-nc-nd/4.0/.
About this article

Cite this article
Wang, J., Qin, Y., Wu, Q. et al. An adaptive AI-based virtual reality sports system for adolescents with excess body weight: a randomized controlled trial. Nat Med (2025). https://doi.org/10.1038/s41591-025-03724-5
Received:
Accepted:
Published:
DOI: https://doi.org/10.1038/s41591-025-03724-5