抽象的
高尿酸血症(HUA)和痛风是由于尿酸代谢的失衡而引起的,并且与肠道菌群密切相关。晚期分析方法促进了菌群复杂性的探索。在这项研究中,完全收集了来自233名患者的粪便样品的16S rRNA测序数据。使用机器学习(ML)和Shapley添加说明(SHAP)可解释性算法来识别核心分类单元并预测代谢功能。结果表明,每个组中的Shap识别出的高贡献核心分类单元,例如振荡螺丝科_ucg-005和犀牛提供了ML预测的基础。在五个分类模型中,随机森林(RF)的诊断性能最佳,预测准确性范围为82%至96%。代谢功能预测表明,嘌呤代谢途径最大程度地将痛风与其他群体区分开。总而言之,基于ML的16S rRNA测序揭示了关键的肠道微生物组生物标志物,帮助HUA和痛风的新诊断策略。
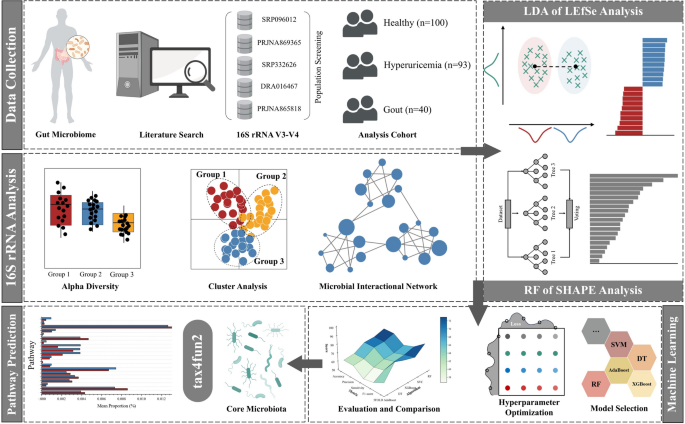
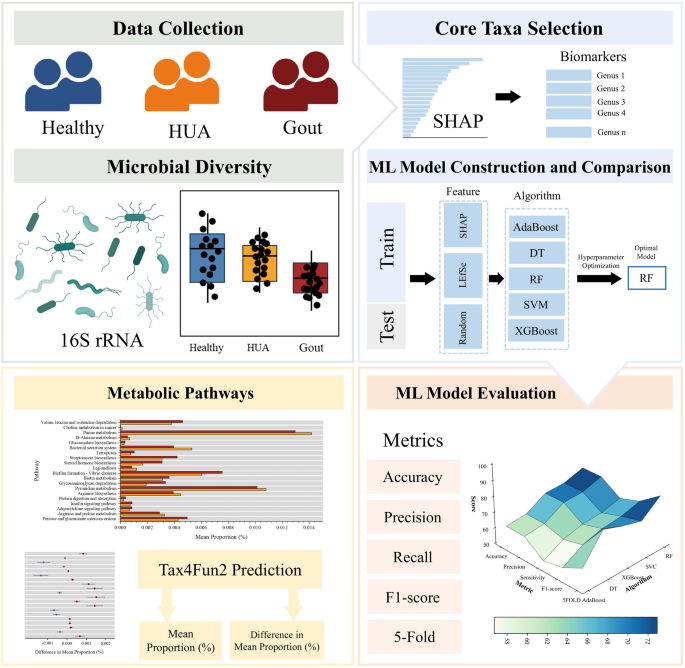
图形摘要
亮点
1。在HUA和痛风中,健康的肠道微生物组多样性大大降低。
2。为HUA和痛风预测开发了解释性的机器学习模型。
3。在人类肠道微生物组中发现了关键细菌,用于HUA和痛风。
介绍
痛风是由尿酸(UA)异常增加引起的一种炎症性和代谢性风湿病,以及在关节或周围组织中单钠(MSU)晶体的沉积[1]。它的特征是在高尿酸血症(HUA)的背景下严重疼痛和侵蚀性关节炎[2]。但是,值得一提的是,尽管HUA是痛风的重要危险因素,但只有大约10%的HUA患者最终会发展痛风[3]。近年来,痛风的全球患病率在0.6至10%之间,而每1000人年的事件范围为0.3至6例[4]。预测模型估计,到2050年,痛风患者的数量将增加70%,达到958万[5]。随着年龄的增长,痛风越来越多于合并症,例如心血管疾病,糖尿病和慢性肾脏疾病[6],使其成为全球重要的公共健康问题。在健康的个体中,大约三分之二的UA通过肾脏系统排泄,而其余的三分之一则通过肠道消除[7]。随着肾功能的下降,通过肠道排泄的UA比例可能会增加到三分之二[7]。但是,肾功能障碍和UA产量过多限制了肠道消除的补偿作用,使患者易于接受[8]。因此,研究患者之间的肠道菌群差异提供了一种有价值的方法,可以理解痛风和HUA的发病机理。
16S rRNA高通量测序技术的快速发展导致疾病相关的肠道微生物组数据大幅增加,这提供了一种有效且具有成本效益的方法来分析复杂生物学系统中的整个微生物群落[9]。先前的研究发现,在痛风中细菌和细菌木甲溶质丰富,而粪便菌和双歧杆菌假催化剂被耗尽[10]。此外,痛风患者的肠道菌群改变会导致嘌呤降解和丁酸生物合成的干扰[10]。关于血液尿酸水平和单个肠道菌群变化的另一项研究发现蛋白质细菌和细菌在HUA患者中,相对丰度Ruminococcus减少[11]。这些发现证明了差异肠道微生物群在患者诊断和治疗中的重要作用。但是,传统的计算方法在充分解释人类微生物组的变化方面表现出缺点,因为它们通常考虑每个细菌种群的保护性或危险作用[12]。由于它们的准确性,适用性和适应性高,机器学习(ML)模型在微生物组研究人员中越来越流行[9]。这种方法允许在其他细菌种群的背景下考虑每个细菌种群的变化,而不是评估隔离的相对丰度[13]。研究人员利用ML算法将差异细菌分类群鉴定为疾病诊断和临床表现的潜在生物标志物。例如,Sachin等人。采用了五种ML算法来分析来自心血管疾病患者粪便样本的16S rRNA测序数据,从而鉴定出39个差异细菌分类群[14]。同样,Park等人。研究了酒精性肝病和代谢功能障碍相关的脂肪肝病之间的肠道菌群,从15]。但是,很少有研究应用ML算法来探索健康对照组,HUA个体和痛风患者之间的差异肠道菌群,以有效诊断不同的患者组。
在这项研究中,我们分析了来自五项基于人群的研究的16S rRNA数据,以研究健康对照,HUA个体和痛风患者之间肠道菌群组成的差异。然后,我们比较了经典的计算方法和解释性ML算法,以识别核心分类单元,并评估其区分患者群体的能力。基于这些核心分类单元,我们确认MLMODEL具有更好的能力来探索肠道微生物组的分类和功能特征。我们的发现提供了对HUA和痛风诊断的新见解,为未来的预防性干预提供了潜在的非侵入性诊断工具和目标。
材料和方法
数据集集合
从先前发表的研究中收集了233个粪便样品的16S rRNA扩增子测序数据,并使用数据标识符SRP096012,PRJNA869365,SRP332626,DRA016467和PRJNA865818。这些研究中的所有测序数据均使用Illumina测序平台获得。在包括的研究中,在中国进行了三项。其余两个分别在日本和韩国进行。这项研究并未利用这些研究中的所有可用数据。相反,我们仅包括与我们的研究类别相关的样本,而没有外部干扰。桌子 1显示所有样品所需的特性和元数据。最终数据集分为三组:健康对照(HC,n= 100),高尿素组(Hua,n= 93)和痛风组(痛风,n= 40)。HC,HUA和痛风组的平均年龄分别为40.87、54.88和50.27岁。每组男性的数量和比例分别为75(75%),62(67%)和38(93%)。平均BMI值分别为24.34、26.22和24.08。
16S rRNA测序数据的分析
原始测序数据和相关的元数据是从NCBI中的序列读取存档(SRA)获得的,包括单端和配对读数。使用质量控制和适配器修剪进行单端和配对序列进行使用三疗法(版本0.33),独立。对于配对末端读取,使用质量过滤后合并前向和反向序列usearch(版本10.0)[20]。使用嵌合体检测和去除Uchime算法(版本8.1)[21],导致高质量的非核序列数据集。使用运营分类单元(OTU)以97%的相似性阈值聚类usearch,生成了一个OTU表以进行下游分析。为了评估微生物群落的组成特征,席尔瓦数据库(版本138.1)[22]被用作参考,置信阈值设置为70%。特征序列在分类学上进行了注释,并在不同的分类水平(门,阶级,秩序,家庭和属)上分析了社区组成。然后使用remove batcheffect来自林玛R包。主成分分析(PCA)和密度图用于可视化样品的聚类,并评估测序运行或样品处理批次之间的潜在批次效应(图。S1)。
肠道微生物组的计算分析
估算了细菌 - 多样性指数(香农和辛普森),并使用门索包裹。应用正交部分最小二乘判别分析(OPLS-DA)来检查HC,HUA和痛风组之间的可分离性。对共发生网络分析进行了Chiplot平台 (https://www.chiplot.online)描述网络结构和复杂性,计算节点数,边数,平均程度和网络密度。线性判别分析(LDA)效应大小(LEFSE)被用来识别组之间差异丰富的分类单元,从而促进了通过统计和生物学意义的生物标志物通过ImageGP 2[23]。Shapley加性解释(SHAP)基于各种基于树的算法的可解释性分析也被用来识别能够区分群体的细菌分类单元。
应用五种ML算法,自适应增强(ADABOOST),决策树(DT),随机森林(RF),支持向量机(SVM)和极端梯度增强(XGBoost),以评估由随机,Lefse和Shap方法选择的分类质量。该数据集以8:2的比率手动分为训练和测试集,以防止数据泄漏。训练集进一步分为内部培训和验证子集train_test_split功能,也以8:2的比例。该测试集仅用于外部性能评估,不参与模型拟合或高参数调整。所有型号均经过预定义的高参数范围训练。使用GridSearchCV功能,该功能根据训练集的性能得分评估了所有参数集。最终模型训练使用了最高精度的组合。使用四个评估指标,准确性,精度,灵敏度和F1得分评估模型拟合和参数优化结果。通过将训练集分为五个子集进行5倍的交叉验证,使用一个子集进行验证,其余四个在每次迭代中进行训练,重复了五次。据报道,所有五个迭代的评估指标的平均值均作为模型的整体性能。表中提供了每个模型的超参数范围和最佳参数组合S13。最后,确定的核心分类单元用于代谢功能预测税务4FUN2[24]。考虑了所有分析p<<0.05是具有统计学意义的。该程序在R 4.3.2和Python 3.9.7中实施。
结果
用于高尿酸血症和痛风患者的解释性分析的工作流程
这项研究首先从五项研究中收集了16S rRNA测序数据,然后将其分为三组:HC,HUA和痛风。分析了这三组的肠道微生物群的多样性和复杂性,并探索了基于肠道微生物组组成的组间差异。然后使用不同的特征选择方法来识别分类单元以区分组,然后使用各种ML算法进行训练。通过性能指标评估了ML任务中所选功能的可行性。最后,使用核心分类单元的代谢功能预测税务4FUN2(图 1)。
研究组之间的微生物多样性和差异丰富的分类单元
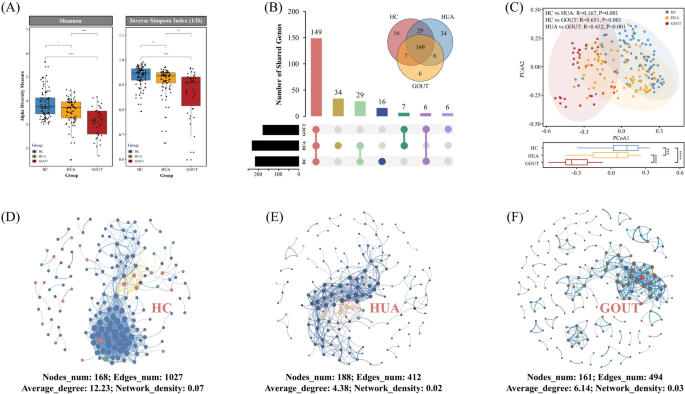
使用香农多样性指数和倒数辛普森指数(1/d)评估了HC,HUA和痛风组中细菌群落的α多样性(图。 2一个)。结果表明,来自HC组的粪便样品中的微生物群落表现出最高的多样性,而痛风组显示出最低的多样性,在该属水平上观察到显着差异(p - 值<0.05)。这三组的维恩图揭示了149个重叠属,分别在HUA和痛风组中唯一显示了34和6个特定的属(图。 2b)。使用Bray-Curtis距离计算β多样性,主坐标分析(PCOA)散点图说明了两组之间的明显差异。单向Anosim进一步证实了这三组之间的显着分离(HC与Hua:r= 0.167,p= 0.001;HC与痛风:r= 0.651,p= 0.001;华与痛风:r= 0.452,p= 0.001)(图 2c)。为了进一步研究三组的肠道微生物生态学,评估了属之间的相互作用。HC组(nodes_num:168,edges_numâ= 1027,平均_degreeâ= 12.23和network_densityâ= - 0.07)表现出与Hua组相比最复杂的微生物社区网络(Nodes_num:nodes_num:188,edges_numâ= 188,edges_numâ= - 412,平均_ 412,= 3.4 = 34 = 34 = 34 = 3.393。network_densityâ= 0.02)和痛风组(nodes_num:161,edges_numâ= 494,平均_degreeâ= - 6.14和network_densepounth = 0.03)(图5) 2D-F)。图2
通过Lefse和Shap Analysis发现微生物生物标志物
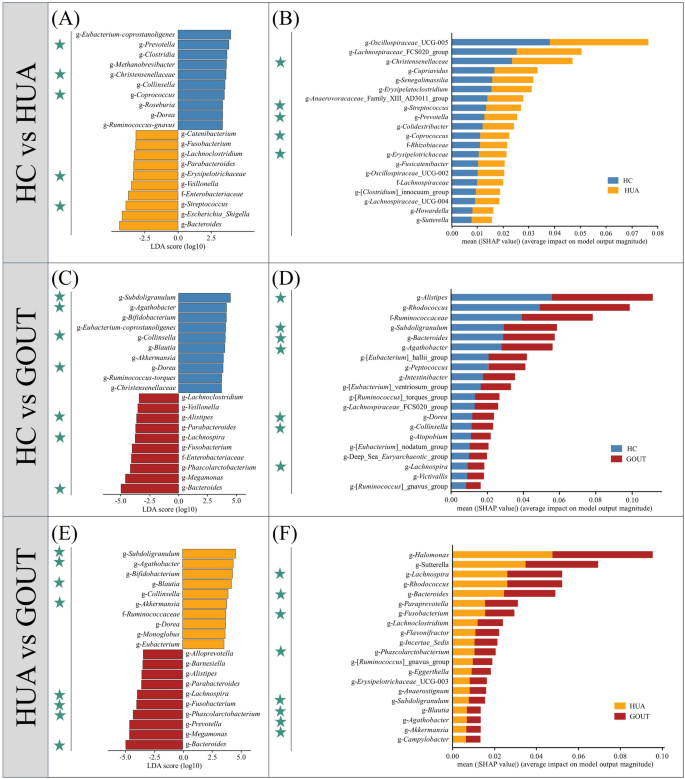
为了在本研究中可以区分不同群体的属水平的分类单元,分别采用了Lefse和Shap进行数据分析。HC与HUA组中有五个共享属,它们在图中标有绿色星星(图。 3a,b),包括g-克里斯汀森纳酸,g-链球菌,g-Prevotella,g-cocrococcus和g-Erysipelotrichaceae。Christensenellaceae在一项关于HUA大鼠肠道菌群的研究中,在Shap分析中表现出很高的贡献,并以前据报道在Hua组中富含富含的贡献,在该研究中,发现它在Hua [25]。另一个高度贡献的属G-振荡螺丝科_UCG-005通过SHAP分析确定,与Hua呈正相关(图。 3b)。周等人。报告有增加振荡螺丝科HUA大鼠肠道菌群中的_ucg-005及其富集与肾病的炎症标记有关,有可能促进慢性肾脏疾病[26]。
在HC与痛风组中,确定了七个共享属,包括G-亚质子,g-Agathobacter,g-科林斯拉,g-Dorea,g-alistipes,g-lachnospira和g-细菌(图 3光盘)。其中,亚质子在Lefse和Shap分析中,与HC组具有很强的相关性和显着性。
研究表明,细菌与高明患者相比27], 尽管亚质子显示与健康个体的正相关,并可以以较高的速率合成丁酸酯,这可能会通过其抗炎作用来预防痛风[28]。alistipes被塑造鉴定为最有贡献的属。冯等人报告了类似的发现,他观察到alistipes是通过脂多糖生物合成,核黄素代谢,苯丙氨酸代谢以及精氨酸和脯氨酸代谢[29]。对于由Shap确定的独特的重要属,犀牛(图 3D),在模型分类的贡献中排名第二。一项整合微生物组和代谢组学的研究表明犀牛在痛风患者中,导致代谢物改变了尿酸排泄和嘌呤代谢[30]。
对于Hua vs.痛风组,确定了八个共享属(图。 3e),包括g-亚质子,g-Agathobacter,g-布劳蒂亚,g-Akkermansia,g-lachnospira,g-梭菌,g-phascolarctocterium和g-细菌。其中,Lefse发现亚质子随着HUA集团更加丰富。确定的形状分析lachnospira作为模型分类的最重要贡献者。细菌属影响各种代谢途径,例如尿酸代谢和嘌呤代谢,同时也改变了活性代谢物(如胆汁酸和胆固醇)的水平[31]。在形状标识的独特属中(图 3f),,唱片是模型分类的最关键属。但是,关注有限唱片在华和痛风的背景下。一项关于糖尿病小鼠药物干预的研究报告说,与代谢性疾病有关的细菌,包括唱片有效地抑制了治疗后,表明其在脂质和葡萄糖代谢疾病中的潜在作用[32]。表S4-6和补充信息提供了三组剩余的所有核心分类单元的详细信息。
基于机器学习算法的选定生物标志物的评估
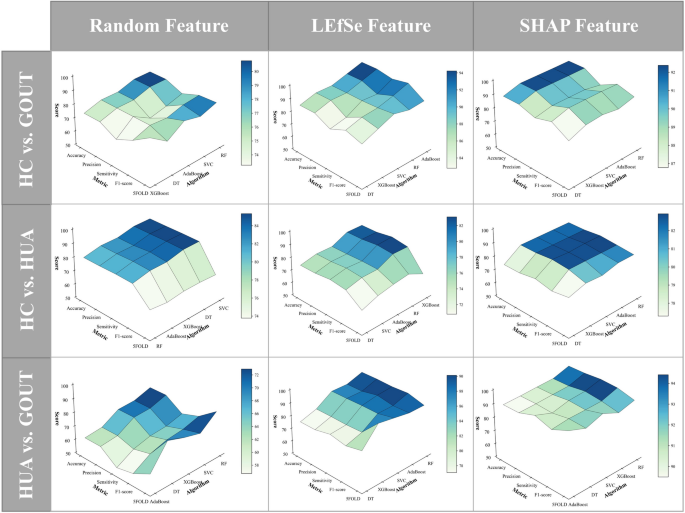
为了评估所选核心分类单元的可行性和能力,本研究使用五个评估指标评估了Lefse和Shap在五种ML算法中确定的前20个属的性能。对于Shap方法,我们优化了参数(表S7-12),并评估了研究中使用的三种基于树的ML算法提取的特征的可行性(表S13-18)。结果表明,RF在所有模型提取的功能中都达到了最佳性能,因此,选择了基于RF的Shap方法来识别关键分类单元进行后续分析。此外,为了验证特征选择方法的可靠性,我们测试了具有随机选择功能的不同模型的性能(图 4)。结果表明,与使用Lefse和Shap选择的功能相比,配备有随机选择功能的模型(随机特征列)的性能要差。在HC与痛风组中,最佳模型的预测准确度为92.46%,交叉验证得分为88.01%。在HC与HUA组中,尽管具有随机特征的模型表现出较高的精度,但它们的鲁棒性较差,而交叉验证得分仅为66.67%。相比之下,使用SHAP选择的核心属的模型达到了82.35%的预测准确性,5倍的交叉验证评分为81.06%。在HUA与痛风组中,由Shap选择的特征始终优于所有模型的其他两种方法,最佳预测准确性达到95.83%,交叉验证得分为92.43%。表S19-21提供了所有模型的详细分类结果。此外,我们在完整特征数据集(表S22)上优化了模型参数,并评估了其性能(表S23-S25)。结果表明,与完整功能数据集相比,RF模型在Shap提取的功能集上的性能更好。因此,基于SHAP的核心税可以作为ML算法的可靠基础,以区分健康和疾病组以及两个不同疾病组之间。
三个研究组中人类肠道微生物组的功能预测
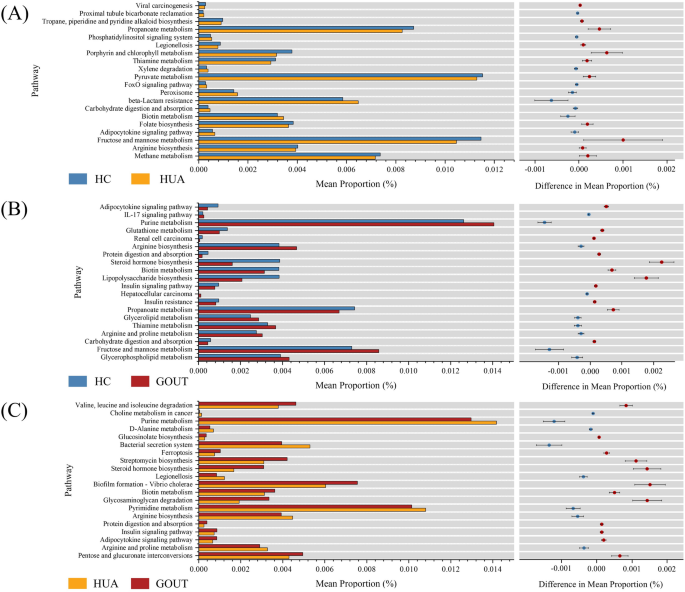
为了推断微生物群落在代谢途径中的作用,税务4FUN2被用来预测HC,HC,HC与Gout和Hua vs.痛风比较的SHAP分析确定的核心分类单元的途径。在HC与HUA组中,与HUA组相比,HC组在硫胺素,果糖,甘露糖和丙烯酸酯途径中表现出更强的代谢活性(图。 5a),这表明这些途径可能会在HUA组中受到损害或抑制,从而导致代谢失调和HUA的发作。HC和痛风组之间的代谢差异如图所示。 5B.与HC组相比,嘌呤代谢,果糖和甘露糖代谢在痛风组中显示出最大的差异。嘌呤代谢的最终产物是尿酸,在黄氨酸氧化酶的催化下是由黄嘌呤和低黄嘌呤产生的[33]。先前的研究报道,与健康个体相比,痛风引起的嘌呤代谢疾病导致痛风患者的黄嘌呤和低黄嘌呤浓度明显更高[34]。另外,果糖和甘露糖代谢水平升高可以刺激嘌呤的合成,从而导致尿酸产生增加[35]。这一发现与Chu等人的结论保持一致,后者通过元基因组分析探讨了肠道微生物组在痛风中的潜在作用[30]。在华人与痛风组中(图 5c)也观察到嘌呤代谢的显着差异。在HUA组中,嘌呤代谢的平均比例较高,这可能是由于在黄嘌呤氧化酶催化下,在黄嘌呤转化为黄嘌呤和黄嘌呤为尿酸的过程中,中间产物的积累。这表明嘌呤代谢途径破坏了,尚未引发明显的炎症反应,嘌呤代谢途径保持相对较高的活性状态[36]。嘧啶代谢在HUA组中也显示出更高的水平。Wu等。发现与嘌呤代谢相似,嘧啶代谢在高尿酸血症的发展和急性痛风发作的加剧中起着致病的作用[37]。一项大鼠研究表明,与健康群体相比,急性痛风大鼠模型表现出增加的果酸和牙本质水平,而胞嘧啶和脱氧胞苷水平则降低[38]。这归因于痛风组的炎症反应更严重,这导致DNA修复酶限制性核酸内切酶的活性增加,从而加速了胞嘧啶和脱氧胞苷的消耗,并表明嘧啶合成途径受损[[38]。
由于饮食和生活方式的变化,由嘌呤代谢疾病引起的痛风和HUA等新陈代谢疾病在全球范围内趋势越来越高[
39]。这项研究分析了五个研究队列中233名受试者的粪便样品中的16S rRNA测序数据。它提出了一种基于粪便菌群特征的新型策略,以区分健康的个体,HUA患者和痛风患者,同时还可以确定潜在的诊断生物标志物。此外,我们探讨了健康和患病组之间微生物代谢功能的差异。这些发现支持核心分类单元作为HUA和痛风预测的生物标志物的潜力,并提供了可靠的辅助诊断工具。
一些研究表明,肠道微生物组的细菌丰富度低与慢性疾病和炎症增加有关[40]。我们的研究发现,与健康组相比,HUA和痛风患者均表现出肠道微生物组组成的差异,并且微生物多样性的趋势降低(图。 3一个)。Abhay对肠道微生物群在HUA和痛风中的作用提供了类似的见解[41]。该疾病组表现出较低的微生物多样性和微生态失衡。外部药理干预措施,例如Ulva Pulifera(以前Enteromorpha Pulifera)或febosostat,有效地恢复了肠道微生物群的多样性[41]。此外,疾病组中微生物社区网络的复杂性明显低于HC组(图。 3D-F)。这一发现与以前对HUA和痛风患者肠道菌群的研究一致[42,,,,43]。LeFSE分析用于研究两个患病组之间以及患病和健康组之间的微生物分类学差异。但是,鉴于16S rRNA测序数据的高维,稀疏性和噪声特征,传统的线性统计方法通常难以识别如此大而复杂的微生物组数据集中的一致且稳定的生物标志物[44]。为了应对这一挑战,已采用了ML与16S rRNA测序数据的集成来有效地处理各种微生物组数据集[13]。例如,Zeng等人。开发了一种ML模型,分析了持久性肺结核(PPN)的16S rRNA数据,并确定了六个核心分类单元与健康个体区分了PPN。使用可解释性算法shap [45]。
这项研究采用SHAP算法来阐明有助于患者分类的关键微生物分类单元,从而提高机器学习结果的透明度和可靠性。结果表明,无论是在健康和患病组之间还是在不同患病组之间,列夫斯和摇摆的核心分类单元的重叠。例如,重叠的属alistipes在健康的个体和痛风患者中都发现,可能会通过涉及脂多糖合成,苯丙氨酸代谢和精氨酸代谢的途径加剧痛风[29]。属lachnospira在HUA和痛风组中通常鉴定出来的,在区分这两个患者组中也起着重要作用。该属可以影响各种生物活性代谢产物的水平,包括尿酸,嘌呤和胆固醇[31]。除了共享属外,Shap还确定了几个独特的属,这些属对区分这三个组有显着贡献。例如,Zhou等。发现丰富振荡螺丝科肠道微生物群中的_ucg-005促进了个体向慢性肾脏疾病的进展[26]。健康个体与痛风的人之间的比较表明,犀牛痛风患者中的属,这会导致参与尿酸排泄和嘌呤代谢的代谢产物的变化[30]。根据核心分类单元特征区分不同群体的可行性依赖于使用ML模型进行定量评估。与Lefse和随机特征选择方法的比较表明,五个ML模型在Shap特征中始终显示出出色且稳定的性能。这表明这些微生物类群在疾病的发作,进展和结果中起着重要作用。
基于确定的核心分类单元,我们使用了Advanced税务4FUN2算法来预测和研究基于16S rRNA基因测序数据的原核生物群落的功能特征[24]。The study found that compared to the healthy group, the metabolism of thiamine, fructose, and mannose was inhibited in the HUA group.In addition, compared to the healthy group, purine metabolism was significantly higher in the GOUT group.Due to purine metabolism disorders, a large amount of xanthine and hypoxanthine is produced in the body, facilitating uric acid formation.At this stage, the purine metabolism is more active in gout patients than in healthy individuals, which further exacerbates gout conditions [34]。In the HUA group, possibly due to the disruption of purine metabolism, intermediate products are generated during the formation of uric acid via xanthine and hypoxanthine, but no significant inflammatory response has been observed [36]。Pyrimidine metabolism, similar to purine metabolism, is more active in the HUA group.This suggests that the body regulates pyrimidine metabolism to reduce the burden of purine metabolism, thereby alleviating the risks associated with uric acid production [46]。Additionally, fructose and mannose metabolism levels are elevated in gout patients, which is consistent with the findings by Chu et al., which explored the association between gut microbiota and gout and reported that gout patients had greater abundances of genes involved in fructose metabolism, mannose metabolism, and lipid A biosynthesis [30]。These results confirm the feasibility of distinguishing healthy individuals from different patient populations based on 16S rRNA data using the SHAP algorithm.
Although this study combines ML with 16S rRNA technology to provide a new solution for distinguishing between healthy, HUA, and gout patients, certain limitations and challenges remain to be addressed.Our study only involved data from three countries in Asia, and the cohort was relatively small.Given the microbial heterogeneity across sex, age, geographic region, and ethnicity, further expanding participant diversity and evaluating the generalizability of these findings would be of significant value [43]。Moreover, this study lacks an external independent validation cohort.Appropriate external validation is crucial for confirming the generalizability and robustness of the ML model.Future research will require a larger sample size to provide sufficient training cohorts and external validation.Secondly, although our study predicted the metabolic pathways of the core taxa, 16S rRNA data alone cannot fully infer the genes and functions of the bacterial community.Therefore, future research should involve multi-omics analysis.This will enable more accurate inferences of bacterial structure and actual gene expression, helping to identify strain-specific genomic features [47]。In summary, the ML-based SHAP approach for identifying core taxa developed in this study outperforms the conventional LEfSe method in terms of classification accuracy.Functional prediction of the identified core taxa revealed significant enrichment in metabolic pathways associated with HUA and gout, further supporting the reliability of the proposed method.As the size and diversity of available datasets continue to grow, this approach holds promise for informing novel diagnostic and therapeutic strategies for HUA and gout.
数据可用性
This study utilizes datasets obtained from publicly available sources and complies with their data usage policies.Additional approval by the local Ethics Committee was not required.All datasets can be accessed at the following URL: PRJNA869365 (https://www.ncbi.nlm.nih.gov/bioproject/?term=PRJNA869365), PRJNA359624 (https://www.ncbi.nlm.nih.gov/bioproject/?term=PRJNA359624), PRJNA754261 (https://www.ncbi.nlm.nih.gov/bioproject/PRJNA754261), DRA016467 (https://ddbj.nig.ac.jp/search/entry/sra-submission/DRA016467), PRJNA865818 (https://www.ncbi.nlm.nih.gov/bioproject/PRJNA865818)。
参考
Thottam GE, Krasnokutsky S, Pillinger MH.Gout and metabolic syndrome: a tangled web.Curr Rheumatol Rep. 2017;19:1–8.
Dalbeth N, Choi HK, Joosten LA, Khanna PP, Matsuo H, Perez-Ruiz F, Stamp LK, Gout (primer), editors.Nature Reviews: Disease Primers.2019;5(1).
Liu L, Wang D, Liu M, Yu H, Chen Q, Wu Y, et al.The development from hyperuricemia to gout: key mechanisms and natural products for treatment.Acupunct Herb Med.2022;2(1):25–32.
James A, Ke H, Yao T, Wang Y. The role of probiotics in purine metabolism, hyperuricemia and gout: mechanisms and interventions.Food Reviews Int.2023;39(1):261–77.
Cross M, Ong KL, Culbreth GT, Steinmetz JD, Cousin E, Lenox H, et al.Global, regional, and National burden of gout, 1990–2020, and projections to 2050: a systematic analysis of the global burden of disease study 2021. Lancet Rheumatol.2024;6(8):e507–17.
Dehlin M, Jacobsson L, Roddy E. Global epidemiology of gout: prevalence, incidence, treatment patterns and risk factors.Nat Rev Rheumatol.2020;16(7):380–90.
PubMed一个 Google Scholar一个
Kang DH, Chen W. Uric acid and chronic kidney disease: new Understanding of an old problem.Seminars in nephrology.Edited by Richard J, Johnson M, Laura Gabriela Sánchez-Lozada K. Vol.31. Elsevier;2011。447–52.
Ichida K, Matsuo H, Takada T, Nakayama A, Murakami K, Shimizu T, et al.Decreased extra-renal urate excretion is a common cause of hyperuricemia.纳特社区。2012;3(1):764.
PubMed一个 Google Scholar一个
Peng S, Luo M, Long D, Liu Z, Tan Q, Huang P, et al.Full-length 16S rRNA gene sequencing and machine learning reveal the bacterial composition of inhalable particles from two different breeding stages in a piggery.Ecotoxicol Environ Saf.2023;253:114712.
CAS一个 PubMed一个 Google Scholar一个
Guo Z, Zhang J, Wang Z, Ang KY, Huang S, Hou Q, et al.Intestinal microbiota distinguish gout patients from healthy humans.Sci Rep. 2016;6(1):20602.
CAS一个 PubMed一个 PubMed Central一个 Google Scholar一个
Liang M, Liu J, Chen W, He Y, Kahaer M, Li R, et al.Diagnostic model for predicting hyperuricemia based on alterations of the gut Microbiome in individuals with different serum uric acid levels.Front Endocrinol.2022;13:925119.
Segata N, Izard J, Waldron L, Gevers D, Miropolsky L, Garrett WS, Huttenhower C. Metagenomic biomarker discovery and explanation.基因组生物。2011;12:1–18.
TopçuoÄŸlu BD, Lesniak NA, Ruffin IVMT, Wiens J, Schloss PD.A framework for effective application of machine learning to microbiome-based classification problems.MBio.2020;11(3).https://doi.org/10.1128/mbio.00434-20。Aryal S, Alimadadi A, Manandhar I, Joe B, Cheng X. Machine learning strategy for gut microbiome-based diagnostic screening of cardiovascular disease.
高血压。2020;76(5):1555–62.
CAS一个 PubMed一个 Google Scholar一个
Park I-g, Yoon SJ, Won S-m, Oh K-K, Hyun JY, Suk KT, Lee U. Gut microbiota-based machine-learning signature for the diagnosis of alcohol-associated and metabolic dysfunction-associated steatotic liver disease.Sci Rep. 2024;14(1):16122.
CAS一个 PubMed一个 PubMed Central一个 Google Scholar一个
Shao T, Shao L, Li H, Xie Z, He Z, Wen C. Combined signature of the fecal Microbiome and metabolome in patients with gout.前微生物。2017;8:268.
Cao C, Fan B, Zhu J, Zhu N, Cao J-Y, Yang D-R.Association of gut microbiota and biochemical features in a Chinese population with renal uric acid stone.前药房。2022;13:888883.
CAS一个 PubMed一个 PubMed Central一个 Google Scholar一个
Miyajima Y, Karashima S, Mizoguchi R, Kawakami M, Ogura K, Ogai K, et al.Prediction and causal inference of hyperuricemia using gut microbiota.Sci Rep. 2024;14(1):9901.
CAS一个 PubMed一个 PubMed Central一个 Google Scholar一个
Ul-Haq A, Lee K-A, Seo H, Kim S, Jo S, Ko KM, et al.Characteristic alterations of gut microbiota in uncontrolled gout.J Microbiol.2022;60(12):1178–90.
CAS一个 PubMed一个 Google Scholar一个
Edgar RC.UPARSE: highly accurate OTU sequences from microbial amplicon reads.Nat Methods.2013;10(10):996–8.
CAS一个 PubMed一个 Google Scholar一个
Edgar RC, Haas BJ, Clemente JC, Quince C, Knight R. UCHIME improves sensitivity and speed of chimera detection.Bioinformatics.2011;27(16):2194–200.
CAS一个 PubMed一个 PubMed Central一个 Google Scholar一个
Quast C, Pruesse E, Yilmaz P, Gerken J, Schweer T, Yarza P, et al.The SILVA ribosomal RNA gene database project: improved data processing and web-based tools.核酸res。2012;41(D1):D590–6.
Chen T, Liu YX, Chen T, Yang M, Fan S, Shi M, et al.ImageGP 2 for enhanced data visualization and reproducible analysis in biomedical research.Imeta.2024;3(5):e239.
Wemheuer F, Taylor JA, Daniel R, Johnston E, Meinicke P, Thomas T, Wemheuer B. Tax4Fun2: prediction of habitat-specific functional profiles and functional redundancy based on 16S rRNA gene sequences.Environ Microbiome.2020;15:1–12.
Liu X, Lv Q, Ren H, Gao L, Zhao P, Yang X, et al.The altered gut microbiota of high-purine-induced hyperuricemia rats and its correlation with hyperuricemia.PeerJ.2020;8:e8664.
Zhou X, Ji S, Chen L, Liu X, Deng Y, You Y, et al.Gut microbiota dysbiosis in hyperuricaemia promotes renal injury through the activation of NLRP3 inflammasome.微生物组。2024;12(1):109.
CAS一个 PubMed一个 PubMed Central一个 Google Scholar一个
Cao C, Li F, Ding Q, Jin X, Tu W, Zhu H, et al.Potassium sodium hydrogen citrate intervention on gut microbiota and clinical features in uric acid stone patients.Appl Microbiol Biotechnol.2024;108(1):51.
CAS一个 PubMed一个 PubMed Central一个 Google Scholar一个
Henson MA.Interrogation of the perturbed gut microbiota in gouty arthritis patients through in Silico metabolic modeling.Eng Life Sci.2021;21(7):489–501.
CAS一个 PubMed一个 PubMed Central一个 Google Scholar一个
Feng Y, Sun H, Zhu R, Tao J, Su R, Sun Y, Wang D. Effects of alcohol on the symptoms of gouty arthritis and taxonomic structure of gut microbiota in C57BL/6 mice.前微生物。2023;14:1257701.
Chu Y, Sun S, Huang Y, Gao Q, Xie X, Wang P, et al.Metagenomic analysis revealed the potential role of gut Microbiome in gout.Npj Biofilms Microbiomes.2021;7(1):66.
CAS一个 PubMed一个 PubMed Central一个 Google Scholar一个
Zhao F, Zhao Z, Man D, Sun Z, Tie N, Li H, Zhang H. Changes in gut microbiota structure and function in gout patients.Food Bioscience.2023;54:102912.
Chen Y, Zhu L, Hu W, Wang Y, Wen X, Yang J. Simiao Wan modulates the gut microbiota and bile acid metabolism during improving type 2 diabetes mellitus in mice.Phytomedicine.2022;104:154264.
CAS一个 PubMed一个 Google Scholar一个
Escribano J, Garcia-Canovas F, Garcia-Carmona F. A kinetic study of hypoxanthine oxidation by milk Xanthine oxidase.Biochem J. 1988;254(3):829–33.
CAS一个 PubMed一个 PubMed Central一个 Google Scholar一个
Wang Y, Deng M, Deng B, Ye L, Fei X, Huang Z. Study on the diagnosis of gout with Xanthine and hypoxanthine.J Clin Lab Anal.2019;33(5):e22868.
Hannou SA, Haslam DE, McKeown NM, Herman MA.Fructose metabolism and metabolic disease.J Clin调查。2018;128(2):545–55.
Yin H, Liu N, Chen J. The role of the intestine in the development of hyperuricemia.Front Immunol.2022;13:845684.
CAS一个 PubMed一个 PubMed Central一个 Google Scholar一个
Liu Y, Yu P, Sun X, Di D. Metabolite target analysis of human urine combined with pattern recognition techniques for the study of symptomatic gout.Mol Biosyst.2012;8(11):2956–63.
CAS一个 PubMed一个 Google Scholar一个
Chen W, Liu Y, Wei M, Shi L, Wu Y, Liu Z, et al.Studies on effect of Ginkgo biloba L. leaves in acute gout with hyperuricemia model rats by using UPLC-ESI-Q-TOF/MS metabolomic approach.RSC Adv。2017;7(68):42964–72.
CAS一个 Google Scholar一个
Chen Y, Tang Z, Huang Z, Zhou W, Li Z, Li X, Sun F. The prevalence of gout in Mainland China from 2000 to 2016: a systematic review and meta-analysis.J Public Health.2017;25:521–9.
Brahe LK, Le Chatelier E, Prifti E, Pons N, Kennedy S, Hansen T, et al.Specific gut microbiota features and metabolic markers in postmenopausal women with obesity.Nutr Diabetes.2015;5(6):e159–e.
CAS一个 PubMed一个 PubMed Central一个 Google Scholar一个
Singh AK, Durairajan SSK, Iyaswamy A, Williams LL.Elucidating the role of gut microbiota dysbiosis in hyperuricemia and gout: insights and therapeutic strategies.World J Gastroenterol.2024;30(40):4404.
CAS一个 PubMed一个 PubMed Central一个 Google Scholar一个
Sheng S, Chen J, Zhang Y, Qin Q, Li W, Yan S, et al.Structural and functional alterations of gut microbiota in males with hyperuricemia and high levels of liver enzymes.Front Med.2021;8:779994.
Lin S, Zhang T, Zhu L, Pang K, Lu S, Liao X, et al.Characteristic dysbiosis in gout and the impact of a uric acid-lowering treatment, febuxostat on the gut microbiota.J Genet Genomics.2021;48(9):781–91.
CAS一个 PubMed一个 Google Scholar一个
Kino S, Hsu Y-T, Shiba K, Chien Y-S, Mita C, Kawachi I, Daoud A. A scoping review on the use of machine learning in research on social determinants of health: trends and research prospects.SSM-population Health.2021;15:100836.
Zeng X, Ma Q, Huang C-X, Xiao J-J, Fu X, Ren Y-F, et al.Diagnostic potential of salivary microbiota in persistent pulmonary nodules: identifying biomarkers and functional pathways using 16S rRNA sequencing and machine learning.J Translational Med.2024;22(1):1079.
CAS一个 Google Scholar一个
Tani T, Okamoto K, Fujiwara M, Katayama A, Tsuruoka S. Metabolomics analysis elucidates unique influences on purine/pyrimidine metabolism by Xanthine oxidoreductase inhibitors in a rat model of renal ischemia-reperfusion injury.Mol Med.2019;25:1–13.
CAS一个 Google Scholar一个
Méndez-Salazar EO, Vázquez-Mellado J, Casimiro-Soriguer CS, Dopazo J, Çubuk C, Zamudio-Cuevas Y, et al.Taxonomic variations in the gut Microbiome of gout patients with and without Tophi might have a functional impact on urate metabolism.Mol Med.2021;27:1–13.
资金
This study was financially supported by the Research Foundation for Advanced Talents of Guandong Provincial People’s Hospital [Grant No. KY012023293].Mr. Jia-Wei Tang acknowledges the support of the Research Training Program (RTP) scholarship by the Australian Commonwealth Government and the University of Western Australia.
道德声明
道德批准并同意参加
不适用。
同意出版
不适用。
竞争利益
作者没有宣称没有竞争利益。
附加信息
Publisher’s Note
Springer Nature remains neutral with regard to jurisdictional claims in published maps and institutional affiliations.
补充信息
权利和权限
开放访问This article is licensed under a Creative Commons Attribution-NonCommercial-NoDerivatives 4.0 International License, which permits any non-commercial use, sharing, distribution and reproduction in any medium or format, as long as you give appropriate credit to the original author(s) and the source, provide a link to the Creative Commons licence, and indicate if you modified the licensed material.您没有根据本许可证的许可来共享本文或部分内容的改编材料。The images or other third party material in this article are included in the article’s Creative Commons licence, unless indicated otherwise in a credit line to the material.If material is not included in the article’s Creative Commons licence and your intended use is not permitted by statutory regulation or exceeds the permitted use, you will need to obtain permission directly from the copyright holder.To view a copy of this licence, visithttp://creativecommons.org/licenses/by-nc-nd/4.0/。重印和权限
引用本文
Tang, JW., Tay, A.C.Y.
& Wang, L. Interpretive prediction of hyperuricemia and gout patients via machine learning analysis of human gut microbiome.BMC Microbiol 25, 429 (2025).https://doi.org/10.1186/s12866-025-04125-x
已收到:
公认:
出版:
doi:https://doi.org/10.1186/s12866-025-04125-x


