
正常葡萄糖调节,糖尿病前和2型糖尿病的人中葡萄糖尖峰的多模式AI相关
作者:Quer, Giorgio
主要的
在美国,有3840万人患有糖尿病,18岁或18岁以上的人患有糖尿病1。尽管有多种因素可能影响个体的葡萄糖稳态,但我们继续仅依靠糖化的HBA1C和禁食葡萄糖测量来诊断和监测2,,,,3,,,,4,,,,5。先前的研究表明,健康个体的餐后异常葡萄糖峰值的频率很高6,,,,7,,,,8,但是这些尖峰的基础知之甚少。年龄等因素9, 饮食10,体育锻炼11, 睡觉12,肠道微生物组成分13, 压力14,合并症15,,,,16和遗传学17被认为是潜在的调节剂。采用包含多模式数据的整体方法可以大大增强对葡萄糖峰值个人变异性的理解。先前的研究为葡萄糖动力学的多模式分析建立了基础,但它们的范围限制了,因为它们主要集中于正常血糖和糖尿病前期7,,,,8并且没有特别强调确保所有个体的充分代表,包括生物医学研究(UBR)中的人数不足的人。
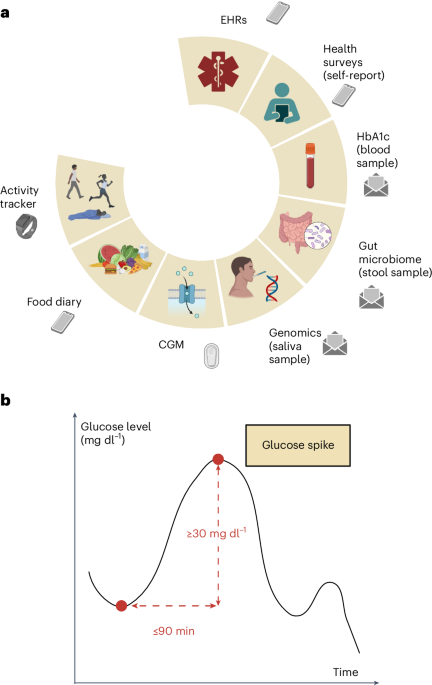
我们进行了一项前瞻性,无网站的临床试验,以从一系列具有异常葡萄糖稳态的参与者中收集多模式数据,从正常血糖到糖尿病到前糖尿病(或中等中性高血糖)再到2型糖尿病(T2D)。血糖反应研究(进度)的预测数字化招募的1,137名参与者被要求提供人口,人体测量,临床,生理,生物学,生物学和生活方式数据的独特组合(图。1)基于基于葡萄糖水平的持续监测的先前研究的有希望的结果6,,,,7,,,,8,,,,18,,,,19,我们远程收集了多模式数据,该数据能够开发高级模型,以增强糖尿病前期风险分层。随后使用人类表型项目(HPP)数据(包括12,014个深层表型个体)对本研究开发的分析技术进行了测试。图1:正在进行的多模式数据收集和葡萄糖尖峰定义。一个

b,葡萄糖尖峰定义的视觉表示:葡萄糖水平的上升至少为30 mg dl1在90分钟或更短的时间内。面板一个和b创建biorender.com。这项工作的目的是调查不同糖尿病状态的异常葡萄糖峰值的决定因素,并利用多模式数据来定义多模式血糖风险概况,从而有可能改变我们通过改善早期诊断和改善T2D预测的早期诊断和预测的方法来预防和治疗T2D的方法。
结果
在2021年11月3日至2023年9月1日之间,招募了1,137个人,其中423人(37.2%)是正常血糖,316(27.8%)为糖尿病前期,398(35.0%)的T2D为基于自我报道的数据。
在注册的参与者中,有463个共享了他们的Fitbit数据,445个共享了他们的食物记录数据,而412个在10天的主动跟踪期间共享了他们的连续葡萄糖监测(CGM)设备数据;657名参与者分享了他们的电子健康记录(EHR)数据。对于有503位入学参与者,可以从自我收集的血液样本中获得HBA1C值。对于471名参与者,益生菌评分和香农多样性指数是根据自我收集的粪便样本计算的。而且,对于506名参与者,T2D的多基因风险评分(PR)源自对自我收集的唾液样本的分析。在1,137名参与者中,有73名退出了研究。根据EHR数据,我们手动将13名患有1型糖尿病(T1D)的参与者排除在入学时服用胰岛素。
对于此分析,我们考虑了每天至少每天至少5天穿着CGM设备的参与者。我们排除了未报告年龄或性别或没有HBA1C的参与者。我们包括347个人,其中174名(50.1%)是正常血糖,79个(22.8%)为糖尿病前期,有94(27.1%)患有T2D(扩展数据。1)。选定人群的平均年龄为49.1±15。6年(平均±S.D。),女性为66.9%。
平均体重指数(BMI)为27.8±7.0 kg m2。分析中包括的参与者与分析中排除的参与者之间的差异在年龄方面没有统计学意义(t-测试,p= 0.970)和性别(Fisherê¼s精确测试,p= 0.200)。如果参与者自我识别为以下任何一个:白人以外的种族和种族;男性或女性以外的性别认同;
年龄> 65岁;小于高中文凭;或居住在农村邮政编码中20。按照这些标准,48.1%的选定参与者为UBR,23.3%的种族/民族UBR(表格)1)。表1所考虑的进度参与者的人口统计学特征
我们分析了以下葡萄糖尖峰指标:平均葡萄糖水平,夜间低血糖,所花费的时间比150 mg dl的百分比
1,相对于基线,预期的每日尖峰和尖峰分辨率的预期最大尖峰值(吸收50%的葡萄糖尖峰所需的平均时间)。在控制年龄,性别和PRS的同时,在所有葡萄糖尖峰指标中都有统计学上的显着差异p所有指标的0.001,除了预期的每日尖峰数量p= 0.001)。与患有T2D的个体相比,糖尿病患者在预期的每日峰值方面表现出统计学上的显着差异(部分ETA平方(部分ETA平方)(我·p2)= 0.036,p= 0.019)和预期的最大尖峰相对值(我·p2= 0.102,p<<0.001)。但是,在将糖尿病前期与正常血糖个体进行比较时没有观察到这些差异(p= 0.727和p分别为0.919)。此外,与跨糖尿病和正常血糖之间的差异相比,糖尿病前和T2D之间的差异更为明显(我·p2= 0.139,p与T2D相比,<0.001;我·p2= 0.068,p与正常血糖相比,<0.001),在高血糖中花费的时间百分比(我·p2= 0.167,p与T2D相比,<0.001;我·p2= 0.091,p与正常血糖相比,<0.001),平均葡萄糖水平(我·p2= 0.143,p与T2D相比,<0.001;我·p2= 0.110,p与正常血糖相比)和夜间低血糖症(0.001)(我·p2= 0.068,p与T2D相比,0.001;我·p2= 0.061,p与正常血糖相比,<0.001)(图。2)。图2:进度队列中的葡萄糖尖峰指标。一个f

一个);预期最大尖峰相对值定义为相对于基线的最大尖峰值,在不同的日期平均(b);花费在150 mg dl以上的时间百分比1((c);尖峰分辨率定义为吸收50%的葡萄糖峰值所需的时间,平均在所有葡萄糖尖峰中平均(d);预期的每日峰值数量定义为每日葡萄糖尖峰的数量,在不同的日期平均(e);和夜间低血糖,定义为在24:00到7:00之间发生的平均最小葡萄糖值,在不同的日期平均f)。通过根据自我报告的糖尿病状态对葡萄糖峰值度量进行分层(正常血糖,n= 174;糖尿病,n= 79;T2D,n= 94)。盒子代表四分位数范围,垂直线是中值,晶须显示了第五和第95个百分位数。报告了分析中考虑的多模式变量的参考值和葡萄糖尖峰指标的分布跨糖尿病状态(扩展数据表
1并扩展数据图。2)。通过分析EHR数据的药物暴露表,我们发现,在我们研究中包括的347名参与者中,有78名患者被开了抗血糖药物。
其中,有64例T2d,12个是糖尿病前期的,其中2个是正常的。我们没有发现服用抗血糖药物的T2D的个体与没有的患者之间的葡萄糖峰值指标和没有统计学的差异(n= 30)。为了研究葡萄糖尖峰指标与人口统计学,人体测量,生物学,生理和生活方式因素之间的关联,我们计算了Spearman的等级相关系数(
r)在控制年龄,性别和公关时。可用的多模式因素根据干预的潜力将三组(人口统计学因素,代谢因素和生活方式因素)分为三组。年龄是唯一与所有葡萄糖尖峰指标表现出统计学显着相关性的人口统计因素,但预期的每日峰值数(p= 0.092)。在代谢因素中,HBA1C与所有葡萄糖尖峰指标呈正相关。发现BMI和静息心率与平均葡萄糖水平,夜间低血糖,高血糖率和尖峰分辨率的时间百分比呈正相关;肠道微生物组的多样性与所有葡萄糖尖峰指标负相关,除了尖峰分辨率(发现相关性在统计学上没有显着意义,p特别是0.240),r= 0.301(p<0.001),平均葡萄糖水平和r= 0.288(p<0.001)在高血糖中花费的时间百分比表明肠道微生物组通常与传统上用于监测目的的更健康的葡萄糖尖峰指标有关。关于生活方式因素,碳水化合物的每日摄入量与预期的最大尖峰相对值和预期的每日尖峰的统计学显着相关性。值得注意的是,我们观察到碳水化合物的摄入量与尖峰分辨率之间存在统计学上显着的负相关性,这表明碳水化合物的每日摄入量更高与葡萄糖尖峰的吸收更快有关。活动水平与所有葡萄糖尖峰指标之间观察到负相关,但预期的每日尖峰数(与该相关性在统计学上没有显着意义,p= 0.436)。这表明从事较高体育锻炼的人倾向于表现出更有利的葡萄糖峰值度量(图。3)。图3:进度队列中的葡萄糖尖峰指标与多模式因子之间的相关性。一个

,Spearman的等级相关系数(DOT)(点)表示代表平均葡萄糖水平的葡萄糖尖峰指标(一个)和尖峰分辨率,即,吸收50%葡萄糖尖峰的平均时间(分钟为几分钟)(b)。使用了双面统计检验。线表示95%的置信区间。与统计学上的FDR校正的相关性p值标记为星形符号。多模式因素分为三组:人口统计学因素(顶部),代谢因素(中)和生活方式因素(底部)。n,样本量。与预期的每日峰值数量,预期的最大峰值相对价值,夜间低血糖症和所花费的时间百分比超过150毫克DL的相关性
1报道了(扩展数据图。3)。T2D风险评估的多模式血糖概况
我们设计了一个多模式二进制分类模型,该模型在进度队列中训练,可以分离具有T2D的正常血糖个体和个体,该模型在曲线(AUC)下的面积为0.96,置信区间为0.94 0.94(补充图。
1)。This model was tested also in the external, independent validation cohort (HPP), where we obtained AUC = 0.90 (confidence interval: 0.82–0.97) and an area under the precision-recall curve (AUPRC) of 0.60 (confidence interval: 0.40–0.77) (补充结果)。报告了此二进制分类任务的特征重要性分析(补充图。2)。
该模型提出了一种与HBA1C相辅相成的度量,改善了鉴定有疾病病理阶段风险的糖尿病前个体。我们使用此模型来获得T2D风险评估的多模式血糖风险概况(补充图。3)。
尽管我们观察到,对于HBA1C值较高的个体,多模式血糖风险概况平均更高,但我们还观察到了实质性的可变性,潜在地强调了我们的模型正在考虑所有可用数据,并提供了一种可以评估个体潜在进展到T2D的工具,而不是观察到HBA1C的一个值。为了验证模型,我们将HPP用作外部,独立的队列。截至2024年9月1日,HPP数据集中有12,014个人。使用用于进度参与者的相同选择标准,外部验证数据集中有2,069名个体,其中1,955(94.5%)是正常血液流行的,114(5.5%)是基于自我报告的数据。平均年龄为51.6±8.0岁,女性为51.9%。平均BMI为26.2±4.2 kg -m2。糖尿病前队列与HPP前队列的人群比较强调了性别的差异(Fisherê¼s精确测试,p= 0.003),但年龄没有统计学上的显着差异(t-测试,p= 0.458)。我们没有足够的信息来确定HPP数据集中UBR个体的百分比。
与正在进行的糖尿病前队列中观察到的类似,HPP中糖尿病前队列的多模式血糖风险谱显示出与HBA1C值一致的模式。更重要的是,我们观察到与HBA1C相同值的风险概况的实质性差异,在外部验证队列中有可能确认我们的模型提供了有关仅HBA1C值的T2D进展的其他信息(图。4)。

,,,,b,HBA1C值和进度糖尿病前参与者的多模式血糖风险特征(一个)和HPP队列中糖尿病前参与者(b)。从人口统计学,人类学,CGM,食物摄入量和肠道微生物组作为输入数据模式的二进制分类模型获得了多模式血糖风险概况。蓝色水平线代表以宽度为0.4的间隔为HBA1C固定HBA1C后的多模式血糖风险中位数。红色的垂直虚线标志着糖尿病范围的边界,从5.7%到6.5%。我们限制了xHBA1C值的轴小于9%,以增强可视化。结果,从图中省略了一个HBA1C值为9.5%的HPP参与者,其HBA1C值为9.5%,多模式血糖风险概况等于0.87。
同样的考虑也适用于HPP正常血糖队列的多模式血糖风险谱(扩展数据图。4)。还报告了进度与外部HPP验证数据集之间的比较(扩展数据表2)。
讨论
目前,使用HBA1C或空腹葡萄糖对T2D和糖尿病前期进行诊断和监测21,,,,22。先前的研究表明,健康的个体以及糖尿病前期的个体具有频繁的,可变的餐后葡萄糖尖峰,而HBA1C或禁食葡萄糖测量未检测到6,,,,7,,,,8。我们试图使用前瞻性队列中的深层表型在一系列葡萄糖稳态条件下的这些尖峰的基础。研究主要集中在预测对单个餐食的血糖反应。但是,有限探索有效地整合多模式数据以进行监测和预防目的,并且尚不清楚多天观察到的全球血糖模式在多大程度上可用于表征不同的糖尿病状态。这些葡萄糖尖峰的驱动因素,运动,睡眠,压力,基因组学,年龄,身体习惯和合并症等驱动因素,如肠道微生物组,锻炼,睡眠,压力,身体习惯和合并症,尚不清楚。为了了解这些变量之间的复杂关系及其与葡萄糖代谢的关联,我们从正常血糖个体,糖尿病前个体和具有T2D的个体中收集了现实世界中的多模式数据,并研究了葡萄糖峰如何与不同的糖尿病状态和人口统计学,人口统计学,临床,临床,生物学,生物学,生理,生理和生理学和生理学和生理学和生理学和生物学和生理学和生物学,生理学,生理学,生理学,生物学,生理学和生物学因素。
我们定义了捕获葡萄糖尖峰动力学各个方面的指标,并证明,在考虑三组正常血糖,糖尿病前和T2D时,它们的总体分布存在显着差异。与T2D相比,糖尿病前期的中间阶段与正常血糖的相似性更大。在每个糖尿病状态中观察到的高变异性突出了该疾病的显着异质性,表明需要进行个人水平的分析以充分代表其细微差别。
生活方式因素与葡萄糖尖峰指标之间发现的相关性揭示了针对饮食习惯,睡眠模式和体育锻炼的干预措施可能会对葡萄糖调节产生可衡量的影响。此外,与先前的研究一致7,,,,8,我们的发现为保持多样化的肠道微生物组的重要性提供了额外的支持,我们发现这与改善的葡萄糖控制相关。我们观察到葡萄糖尖峰指标的值得注意的下降,因为个体年龄出现,这是与这些指标具有统计学意义相关性的唯一人口统计因素。有趣的是,T2D和葡萄糖尖峰的PR之间的关联在统计上并不显着,这表明环境和遗传因素的结合可能是疾病发作所必需的。
考虑到T2D的异质性,已经提出了新的疾病模型,例如麦卡锡调色板模型23,这超出了依赖于常规情节实验室高血糖量所提供的过度简短观点的硬性分类。识别这些表型将使我们能够冒险分层的个人可以实现有针对性的干预措施,从监视糖尿病前期的个体到促进教育和支持高风险正常流行者的强化生活方式改变的支持24。为了更深入地研究这一点,我们为T2D风险评估设计了多模式的机器学习模型,其中包含了HBA1C以外的所有葡萄糖尖峰指标和多模式因素,并将其应用于进度的糖尿病前参与者。我们的模型产生的多模式血糖风险曲线与HBA1C值一致,但它描绘了一种更详细的表型,能够有效区分具有相同HbA1c值但不同血糖模式的个体。我们将模型应用于独立队列(HPP)的正常血糖和糖尿病前参与者,以进行外部验证。尽管与进度队列相比,HPP队列中具有较低值的多模式血糖风险曲线,但在同一HBA1C的个体中,与进度相比,HBA1C值和实质性变异性具有一致的模式。这种外部验证是在大型数据集和人群上进行的,该验证与地理位置,饮食习惯,人口统计和数据获取方法的进度明显不同,证明了我们多模态血糖风险概况的适用性。我们的发现展示了多模式方法如何更好地捕获T2D的细微差别,这是关于情节测定的狭窄视角。我们的多模式人工智能(AI)模型(包括连续的生物传感器数据)可能对包括传感器在内的多层数据集进行了启发性分析。
这项工作借鉴了最近的研究,该研究探讨了多模式数据,尤其是CGM的潜力,以促进对T2D和糖尿病前期的科学理解。通过结合临床,生物学,生理和生活方式数据,已经发现了许多未知模式6,,,,7,,,,18,,,,19,,,,25,,,,26,但是了解多模式分析如何改变我们练习和理解糖尿病的方式仍然充满挑战。值得注意的是,TUEF/TUEF/TULIP糖尿病前队列的多元亚表型(由899个糖尿病人组成)确定了六个不同的亚表现型簇,其中两种与T2D的迫在眉睫的风险有关27。同样,在加拿大安大略省招募的1,567,636例T2D患者中,根据医师的主张,实验室结果,处方,处方,药物病史和其他行政荒地数据,预测了由于糖尿病并发症而导致的不良结果28。
我们的研究还通过将食物摄入量,CGM,遗传学数据和肠道微生物组数据纳入了EHR以及病理学组和非病理学队列中的所有临床数据之外,进一步采用这一点。此外,数字化,分散的临床试验,它们使用移动技术(例如可穿戴设备和数字平台)来促进试验过程,并且在所有任务(从注册到生物样本的自我收集范围内)都可以从参与者的家中进行明显的转变,代表传统的场地式的一个偏远的参与者,遥不可及。29,,,,30,,,,31。进度研究表明,分散的数字试验如何允许在现实世界中连续捕获上下文化数据,同时确保与48.1%的参与者自我识别为UBR的参与者有多样化的队列。这种代表性不足的个体的特殊表示增强了我们的分析的重要性和价值,从而有助于对不同糖尿病状态的葡萄糖尖峰有更透彻的了解。
使用大型研究(例如HPP)和来自多个来源的变量结合,可以在不同的亚表现型中探索发展T2D或进一步并发症的风险或进一步并发症的风险。多元亚表型已经被证明有效预测疾病进展27。但是,如果基于罕见且昂贵的实验室测试结果,则这种方法可能无法扩展。进度研究通过可穿戴设备证明被动收集生理数据的可行性提出了一种潜在的解决方案,这允许在更精细的时间分辨率下连续远程监测个体的健康状况。这种监测策略可以改变个人被筛选和诊断的方式,并最终如何提供护理,尤其是在临床无症状的队列中。承认必须解决适当的基础设施和隐私/安全控制,因此在临床实践中实施个性化的风险评估将使临床医生能够对个人健康状况和发展T2D的风险进行全面的了解,从而及时进行干预措施并调整治疗计划。这种方法对公共卫生的潜在影响是很大的,因为经过前瞻性验证后,它可以有效地评估初级保健环境中的糖尿病风险并提供重要的信息以改善预防性生活方式计划。最终,这可能有助于降低T2D和糖尿病前期的患病率。
这项研究代表了通过使用多模式数据迈向早期诊断,监测和预防T2D和糖尿病前期的第一步。我们对葡萄糖峰值与各种人口,代谢和生活方式因素之间的相关性进行了初步评估,这些因素将为未来的介入研究提供依据,重点是研究这些关联的因果关系。此外,我们在独立的横截面队列中验证的糖尿病中个体的多模式风险评估方法可能会成为未来纵向研究的基础,旨在将多模式数据用于T2D风险分层。我们的小组打算了解这些发现对糖尿病前和糖尿病人群的纵向队列中糖尿病的不良临床结局的相关性。我们正在积极设计一项研究,以研究葡萄糖尖峰指标的预后影响,并将新颖的工具(例如蛋白质组学器官时钟)整合在一起。
技术是分散临床试验中远程,现实世界中数据收集的关键组成部分,尽管由于某些个人群体无法访问许多这些技术,因此它们可能引起无意的选择偏见,从而导致对低收入社会经济阶级或老年人的潜在歧视。在这项研究中,我们试图通过对所有参与者进行研究的设备来减轻这种偏见。此外,传感器的精度和自我报告的数据的准确性,例如糖尿病状态和食物摄入记录,可能会在调查结果中引入限制。特别是,作为分散的临床试验的一部分,在现实情况下,对参与者的食物摄入量的准确报告证明是许多人的挑战(依从性和准确性)。需要进一步的研究来开发更具用户友好的应用程序,以收集专注于参与者偏好的食物摄入量。此外,在进行多模态血糖风险概况的分析时,使用不同的CGM设备和HPP可能会导致偏见。在未来的研究中,研究使用不同的设备和方法来收集数据引起的潜在偏见是有价值的。可穿戴设备,EHR,自我报告的食物摄入量,基因组学和肠道微生物组的原始数据汇总,以得出每个参与者的摘要指标。所选的数据聚合方法可能会影响每种数据模式的多模式分析和重要性评估。此外,对于糖尿病患者常见的抗血糖疗法的使用可能会导致糖尿病患者与非糖尿病患者之间的葡萄糖峰值度量的差异低估。此外,在可以在临床上应用之前,应在临床环境中使用标准化设备进行大规模,协作,多机构的前瞻性研究进行验证。
进度研究表明,在远程监测的队列中连续多模式数据收集的可行性,包括一系列葡萄糖稳态条件,并且在生物医学研究中具有历史上代表性不足的个体的无效表示。Our investigation identified the underlying factors associated with abnormal glucose spikes, shedding light on the potential of interventions targeting lifestyle factors such as dietary habits, sleep and physical activity, as well as gut microbiome diversity, to improve glucose regulation and metabolic health.Although the analysis of glucose spikes revealed significant differences among normoglycemic individuals, prediabetic individuals and individuals with T2D, in particular in the expected time for spike resolution (longer for T2D) and in the value of the nocturnal hypoglycemia (higher for T2D), it also highlighted substantial heterogeneity.Most notably, within the prediabetic state, we showed that a multimodal risk profile can vary substantially for participants with the same value of HbA1c.We showed that the collected multimodal data can be incorporated into a comprehensive multimodal risk profile that can stratify the prediabetic population to a finer resolution compared to the unimodal analysis of HbA1c.The inclusion of additional data modalities, such as environmental exposure, into future AI models could further enhance the precision of T2D risk assessment.These findings lay the foundation for alternative approaches that could potentially revolutionize the way complex diseases such as T2D are prevented, diagnosed and treated.
方法
Ethical considerations
The protocol for this study was reviewed and approved by the Scripps Office for the Protection of Research Subjects (IRB-20-7635).All individuals participating in the PROGRESS study provided informed consent electronically.The HPP study was approved by the institutional review board of the Weizmann Institute of Science.
Study population (PROGRESS)
The PROGRESS study is a digital clinical trial aimed at enrolling a total of 1,000 adults—half with and half without T2D—to monitor their continuous glucose levels, dietary intake, resting heart rate, sleep and activity levels over a period of 10 days.In addition, participants were asked to self-administer biosample collection kits that were used to assay blood for HbA1c, saliva for genomics and stool samples for gut microbiome.Participants were required to connect and share their EHR data for the duration of the study, which is 3 years.All study participants were recruited in the United States.Exclusion criteria included the following: T1D mellitus;inability to participate in or comply with any of the testing modules asked during the study;currently pregnant;prior bariatric surgery;chemotherapy or radiation treatment for cancer in the past year;inflammatory bowel disease;known skin allergy to adhesives and nickel (or other contraindications to the CGM device);currently taking any oral steroids;currently taking insulin (injected, inhaled or via insulin pump);antibiotic use in the last 3 months prior to the start of the study or planned use during the duration of the study;non-dietary supplemental probiotic use either daily or weekly;hospice or palliative care;and end-stage renal disease.The ClinicalTrials.gov registration identifier isNCT04881019。
Study population (external validation dataset, HPP)
The HPP (https://humanphenotypeproject.org/) is a large-scale prospective study that was used as an external validation dataset for our multimodal model.The study enrolled 27,916 participants to date, of whom 12,014 individuals were deeply phenotyped, aged 40–70 years, with the goal of following them longitudinally for 25 years.The collected data span a wide range of data modalities, including blood tests, retinal fundus images, carotid ultrasound, liver ultrasound, gut microbiome, human genetics, glucose levels monitored for 2 weeks with CGM devices and continuous sleep data collected over three nights with home sleep apnea test devices.All participants were recruited in Israel.Major exclusion criteria included pregnancy or currently undergoing fertility treatments, cardiovascular diseases, chronic metabolic diseases, chronic gastrointestinal diseases, chronic kidney diseases and weight loss more than 5% in the recent year without deliberate diet32。
Outreach and recruitment (PROGRESS)
Study recruitment was initiated in February 2021 via social media outreach and partnerships with healthcare provider systems.Paid advertisements on the website Nextdoor in the greater San Diego area drove interested individuals to a study web page (https://progress.scripps.edu/) where they indicated a desire to join the study as well as a brief capture of their diabetes status.Over 1,000 interested individuals from that campaign were then invited to screen for the study beginning in July 2021. Additional social media channels such as Facebook campaigns were used to generate interest nationally.In addition, outreach to patients from our healthcare partners was done via identification of eligible participants based on criteria (for example, diabetes status) via EHR.Individuals who appeared to meet the inclusion and exclusion criteria were sent an electronic notification through the EHR with an invitation to participate in the study.All recruitment campaigns directed interested individuals to the study website with an overview of the study and a call to action to either join the waiting list or enroll to screen.Lastly, an email-based campaign leveraging a third-party organization, Research Match, was used where notifications were sent to participants who had registered in the Research Match database and reported having prediabetes or T2D.By focusing on digital campaigns and emphasizing that participants did not need to attend any in-person site visits to fully participate, we were able to recruit a diverse patient population in terms of age, socioeconomic status and geographic location.
Data collection and preprocessing (PROGRESS)
A study-specific smartphone app (MyDataHelps; CareEvolution) was developed to facilitate participants in their self-guided completion of the required tasks.Specifically, the PROGRESS app allowed participants to order their BioKit (for the self-collection of blood, saliva and stool samples) and GlucoKit (including a continuous glucose monitor, a wrist-worn fitness tracker and instructions on how to download and use a food logging app) and provided self-guided modules with tips, videos and instructions to facilitate the self-collection and shipment of the biosamples.In addition, the PROGRESS app included a customized data visualization tool that combined real-time CGM data with logged food intake data.From the raw data, we derived summary metrics that are representative of the participant’s overall health status and lifestyle as well as other physiological and biological parameters that are thought, based on existing literature, to be associated with T2D.
BMI was computed from self-reported weight and height.To minimize the impact of outliers on our analyses, we considered a participant’s BMI of 121.6 kg m−2as abnormally high and treated it as a missing value.Diabetes status (normoglycemic, prediabetic or T2D) was self-reported.Based on the HbA1c test result, an individual is defined as normoglycemic if their HbA1c value is less than 5.7%, prediabetic if it falls within the range 5.7–6.4% and diabetic if it is equal to or exceeds 6.5% (ref.33)。
Interstitial glucose levels were measured by Dexcom G6 (Dexcom) devices that were self-applied and activated by the participants.Readings collected in the first 12 h after device activation were discarded to maximize data accuracy.The raw CGM signals were collected with a nominal 5-min sampling period, but we observed slight fluctuations in the sampling intervals, resulting in non-uniform sampling.To address this, we used linear interpolation between consecutive 5-min data points to derive 1-min epochs.This approach also provided finer temporal resolution for the analysis of glucose dynamics, which is useful for capturing short-term variations.Missing values were imputed for no longer than 10 min from a valid measurement.We employed peak detection techniques on the CGM signal to identify glucose spikes, which we defined as peaks with a minimum relative amplitude of 30 mg dl−1within a time window of 90 min or less (Fig.1)。
We then computed six glycemic measures, capturing different aspects of the glucose spike dynamics: the mean glucose level;nocturnal hypoglycemia, defined as the average (across different days) minimum glucose value occurring between 24:00 and 7:00;time spent in hyperglycemia, defined as the percentage of time spent above 150 mg dl−1;the expected maximum spike relative value, defined as the average (across different days) of the maximum daily spike value relative to the baseline;the expected daily number of spikes, defined as the average (across different days) of the number of glucose spikes in a day;and the spike resolution, defined as the average time (across all glucose spikes) required to absorb 50% of the glucose spike.The choice of using a 150 mg dl−1threshold for the time spent in hyperglycemia was motivated by clinical considerations;because, in this study, we measure glucose levels continuously, we selected a cutoff value that lies between the fasting hyperglycemia threshold (125 mg dl−1) and the 2-h postprandial hyperglycemia threshold (180 mg dl−1)34。The assessment and definition of a glucose spike in the era of CGM is an evolving field.We used metrics provided by other studies in the field coupled with additional exploratory metrics with physiologic relevance18,,,,35。
During the 10-day active tracking period, participants logged their dietary intake through the food diary app Bitesnap (Bite AI).To model participants’ dietary habits, we summed up the composition of meals logged on the same day and computed the average value of carbohydrates, fat and protein daily intake over the 10 days of active tracking.
Study-provided fitness trackers (Fitbit Charge 4 or 5; Fitbit), or personal Fitbit devices compatible with the study, allowed for the passive collection of daily resting heart rate, sleep duration and physical activity (based on daily step counts).All Fitbit metrics were averaged over the 10 days of active tracking.For participants who did not meet the minimum wear time (16 h per day for at least 5 days), the Fitbit metrics were not used in our analyses.We observed statistically significant correlations between Fitbit wear time and age (r = 0.186,p = 0.003) and between Fitbit wear time and BMI (r = −0.192,p = 0.003), which might impact the generalizability of findings pertaining to the Fitbit metrics.However, the impact might be limited because the magnitudes of the correlations are relatively small.
Blood samples were self-collected by participants through study-provided Tasso-M20 kits (Tasso).At the time of its use in the study, the Tasso-M20 had received FDA 510(k) Class II Medical Device clearance.The device was internally validated by the manufacturer with comparisons to whole blood control samples, showing strong alignment.The device also met all criteria for intraday precision, interday precision, linearity and specificity, with values within acceptable ranges, even if it has not been validated in peer-reviewed studies.The collected samples were sent to a Clinical Laboratory Improvement Amendments (CLIA)-certified laboratory and run on AU680 analyzers (Beckman Coulter) to get HbA1c values.
Saliva samples were self-collected by participants through study-provided Oragene 600 devices (DNA Genotek) and processed with low-pass sequencing at Gencove.The PRSs for T2D were computed using a standard weighted allele-counting approach, under the assumption that loci effects are independent, as defined by the formula:\({\rm{PRS}}_{i}={\varSigma }_{j=1}^{n}{x}_{{ij}}{\beta }_{j}\), where the PRS for each individual is calculated as the sum of the effect allele dosages (\(0\le {x}_{{ij}}\le 2\)) for each variant (j) in the score, multiplied by its respective marginal effect size (\({\beta }_{j}\)), represented as the log odds ratio per effect allele dosage.We specifically constructed a PRS comprising 558 single nucleotide polymorphisms (SNPs) based on a recent study that identified robust T2D risk loci36, with weights derived from the latest large-scale T2D meta-genome-wide association studies, incorporating data from the Million Veteran Program, DIAMANTE and Biobank Japan, among other sources.To adjust the PRS percentile by ancestry, we first estimated genetic ancestry using a pruned set of SNPs selected by linkage disequilibrium pruning with PLINK version 1.9 (parameters: ‘–indep-pairwise 100 10 0.05’)37。We then computed the proportional ancestry for each individual across the five continental superpopulations from the 1000 Genomes Project (1000G) dataset38using ADMIXTURE version 1.3.0 in supervised mode (‘–supervised 5’)39。The raw PRS was then transformed into a percentile score based on a simulated reference population, which was generated by sampling the 1000G dataset in proportion to each person’s ancestry composition.For each individual, we conducted 1,000,000 sampling iterations across the five 1000G superpopulations, ensuring that ancestry-specific adjustments to the PRS percentile remained robust and minimizing fluctuations due to sampling variability.Additionally, we performed principal component analysis on genotype data for the participants selected for the analysis and incorporated the first 10 principal components as input features for the multimodal glycemic risk profile model.
Stool samples were self-collected by participants through study-provided gut health tests (Thorne) and processed using whole-genome shotgun sequencing by Thorne.We performed adapter trimming and low-quality reads filtering with fastp version 0.23.4 using default parameters and sliding window from front to tail (that is, ‘cut-right’ parameter enabled)40。Host reads were detected with Bowtie 2 version 2.5.2 based on the alignment with the human genome (human reference genome assembly GRCh38) and then removed41。Paired-end reads were merged with fast length adjustment of short reads (FLASH version 1.2.11) using default parameters except for the maximum overlap length, set to 200 base pairs42。Relative abundances were obtained with metagenomic phylogenetic analysis (MetaPh1An version 4.0.6) with default parameters43。The Shannon diversity index was used as a measure of alpha diversity and computed as\(\mathop{\sum}\nolimits_{i=1}^{{n}_{\rm{g}}}{p}_{i} \times \log ({p}_{i})\), 在哪里p我denotes the relative abundance of the我th genus andngdenotes the total number of genera.Probiotic scores were obtained by adding up the relative abundances of the following genera:Faecalibacterium,,,,Lactobacillus,,,,Bifidobacterium,,,,Enterococcus,,,,Lactococcus,,,,Pediococcus和Leuconostoc。Medical conditions documented up to 10 years prior to the enrollment date were extracted from the participants’ EHR data.We grouped the medical conditions into eight higher-level categories based on the Systematized Nomenclature of Medicine Clinical Terms (SNOMED CT) hierarchy: disorders of the cardiovascular system (SNOMED CT concept ID ‘134057’);
disorders of the digestive system (‘4201745’);disorders of the respiratory system (‘320136’);disorders of the musculoskeletal system (‘4244662’);disorders of the nervous system (‘376337’);disorders of the genitourinary system (‘4171379’);disorders of the auditory system (‘4176644’);and disorders of the visual system (‘4134440’).Medical conditions marked as resolved were excluded.We determined the number of comorbidities by considering the count of high-level categories that contained at least one recorded medical condition.We used the drug exposure table in the EHR data to extract information on the usage of antihyperglycemic medication.Specifically, we identified entries that included the names of commonly prescribed medications for improving glycemic control in individuals with T2D: metformin, alogliptin, linagliptin, saxagliptin, sitagliptin, dulaglutide, exenatide, liraglutide, lixisenatide, semaglutide, bexagliflozin, canagliflozin, dapagliflozin, empagliflozin, glimepiride, glipizide, glyburide, rosiglitazone and pioglitazone44。We classified a participant as someone using antihyperglycemic medications if they had at least one recorded entry within 1 year prior to the start of CGM monitoring and throughout the monitoring period.Data collected and preprocessing (external validation cohort, HPP)
From the external validation dataset, we included the data modalities that were also available in PROGRESS—namely, CGM, food intake and gut microbiome, in addition to age, sex, BMI and HbA1c.
The diabetes status was self-reported by the participants.Participants without any recorded diabetes or prediabetes condition were considered as normoglycemic.Participants with T1D or with diabetes of unspecified type (as determined by self-report) were excluded from the analysis.
To obtain the HbA1c values, we identified the HbA1c test from the EHR data that was closest in time to the start date of CGM, within a 180-day time window (ranging from 90 days before the monitoring start date to 90 days after).The potential time mismatch between the HbA1c test and the CGM is limited to a maximum of 90 days, but we note that it can potentially cause inaccuracies in the analysis.
Interstitial glucose levels were measured by FreeStyle Libre Pro Flash (Abbott) devices.The raw CGM signals were collected with a 15-min sampling period.Linear interpolation between consecutive 15-min data points was used to derive 1-min epochs.Missing values were imputed for no longer than 15 min from a valid measurement.The glucose spike metrics were calculated by using the same procedure employed for PROGRESS data.
Following the approach used for PROGRESS, we determined the average daily food intake for carbohydrates, fat and protein by summing up the composition of meals logged (through a mobile phone app) in the same day.Stool samples for the analysis of gut microbiome were collected in the clinic and analyzed via shotgun metagenomic sequencing.The Shannon diversity index and the probiotic score were computed from the relative abundances (at the genus level) with the same methods used for PROGRESS data.
Adopting the same criteria used for PROGRESS, we selected participants who had sufficient CGM data (at least 16 h per day and at least 5 days), an HbA1c test result and demographic information.It is important to acknowledge that different CGM devices were used for data collection in the two cohorts.Furthermore, some specific data processing steps, particularly regarding the processing of microbiome data, were different in the two studies.These differences can introduce potential confounding factors in the joint analysis of PROGRESS and HPP data.
统计分析
We conducted ANCOVA tests controlled for age, sex and PRS to compare glucose spike metrics across self-reported diabetes statuses, and we evaluated the effect size with computed partial eta squared (我·p2), which measures the proportion of variance accounted for by the independent variable while controlling for covariates.Furthermore, we investigated the correlations between the glucose spikes and the available anthropometric, biological, physiological and lifestyle variables.We employed Spearman’s rank correlation coefficient (r) to assess the strength and direction of the associations while controlling for age, sex and PRS.We used a bootstrap percentile-based method with 10,000 iterations to estimate confidence intervals for correlations (with a confidence level of 95%) and determined the statistical significance by evaluatingpvalues using a two-sided paired bootstrap test.False discovery rate (FDR) Benjamini–Hochberg correction was used to account for multiple testing.
Multimodal machine learning model for T2D risk assessment
We developed a multimodal machine-learning-based model to compute glycemic profiles for T2D risk assessment of PROGRESS prediabetic participants and normoglycemic and prediabetic participants from the HPP external cohort32。We used the collected demographic, anthropometric, clinical, biological, physiological and lifestyle data as input for the multimodal model.We trained binary classifiers based on gradient boosting decision trees (XGBoost) to distinguish between individuals with T2D and normoglycemic individuals.We chose the XGBoost model to capture potentially nonlinear relationships among the variables.XGBoost was selected among other nonlinear models as it is less complex and requires less data for training.We considered different configurations of input features, including age, sex and BMI (‘Base’ features), glucose spike variables (‘Spikes’), food intake variables (‘Food’), microbiome variables (‘Microbiome’), genomic variables (‘Genomics’), Fitbit variables (‘Fitbit’) and EHR condition variables (‘EHR’).The model’s hyperparameters were tuned separately for each input configuration using a preliminary grid search cross-validation loop with five splits.To assess the model’s performance, we used a leave-one-person-out scheme, where the data of each participant were excluded from training and used solely for testing.We assessed the models using the receiver operating characteristic curve and the corresponding AUC.We used a bootstrap percentile-based method with 10,000 iterations to estimate confidence intervals with a confidence level of 95%.We determined the statistical significance of the improvements relative to the base model by evaluatingpvalues using a two-sided paired bootstrap test.We acknowledge that this approach does not eliminate the risk of potential residual confounding.Furthermore, to assess the contribution of each feature to the binary classification task, we computed the Shapley additive explanations (SHAP) for each test data point45。We considered the normalized absolute SHAP value and computed the median value over the entire test set to get a global feature importance score.
Next, we trained a multimodal classification model on all T2D and normoglycemic participants of the PROGRESS cohort using demographics, anthropometrics, CGM, food intake and gut microbiome as input data modalities.The multimodal model was then applied to the prediabetic group of the PROGRESS cohort and to the normoglycemic and prediabetic groups of the HPP cohort, which were not used for training the model.The objective was to evaluate the glycemic risk profile associated with the individuals being tested and compare it with the HbA1c value.To accomplish this, the model calculated the probabilities of being classified as part of the T2D group, based on the patterns learned from the training data.We considered this probability of belonging to the T2D group as a glycemic risk profile and compared it with the HbA1c value.
报告摘要
Further information on research design is available in theNature Portfolio Reporting Summarylinked to this article.
数据可用性
Participant data with known identifiers removed are available for academic research purposes upon reasonable request and within established restrictions—that is, not for commercial purposes or for the benefit of for-profit entities.Access to the PROGRESS data is subject to approval by the study sponsor (Tempus AI) and the study principal investigator to ensure alignment with the original study objectives and ethical guidelines.Approved researchers will be granted secure access through a designated data environment;direct downloads or transfer of individual-level raw data are not permitted.Requests for data access should include a summary of the proposed research objectives, analytic plan and institutional affiliation.For further information or to submit a data access request, please contact the corresponding authors.Responses will be processed within 6 weeks.Reference data from the HPP study are available athttps://github.com/ayya-keshet/CGMap。Access to this dataset, for universities and other research institutions, can be requested athttps://humanphenotypeproject.org/。The 1000 Genomes Project dataset was sourced fromhttps://www.internationalgenome.org/。The GRCh38 human reference genome dataset was sourced from the UCSC Genome Browser (https://genome.ucsc.edu)。
代码可用性
Python libraries used in the analysis include Python version 3.11.5 for code development;NumPy version 1.26.0, pandas version 2.1.1 and SciPy version 1.11.2 for data manipulation and processing;pingouin version 0.5.3 for statistical tests;XGBoost version 2.0.3 for machine learning model training;and seaborn version 0.13.2 and Matplotlib version 3.8.0 for visualization.The code used for the analyses is accessible athttps://github.com/scripps-research/progress_nat_med。参考
National Diabetes Statistics Report
(Centers for Disease Control and Prevention, 2024);https://www.cdc.gov/diabetes/php/data-research/index.htmlHolst, J. J., Gasbjerg, L. S. & Rosenkilde, M. M. The role of incretins on insulin function and glucose homeostasis.
Endocrinology162 , bqab065 (2021).Google Scholar
一个 Myers, M. G. Jr, Affinati, A. H., Richardson, N. & Schwartz, M. W. Central nervous system regulation of organismal energy and glucose homeostasis.
Nat.Metab. 3, 737–750 (2021).
Carrasco-Zanini, J. et al.Proteomic signatures for identification of impaired glucose tolerance.Nat.医学 28, 2293–2300 (2022).
CAS一个 Google Scholar一个
Hou, J. et al.Associations of residing greenness and long-term exposure to air pollution with glucose homeostasis markers.科学。总环境。 776, 145834 (2021).
CAS一个 Google Scholar一个
Hall, H. et al.Glucotypes reveal new patterns of glucose dysregulation.PLoS Biol. 16, e2005143 (2018).
Berry, S. E. et al.Human postprandial responses to food and potential for precision nutrition.Nat.医学 26, 964–973 (2020).
CAS一个 Google Scholar一个
Zeevi, D. et al.Personalized nutrition by prediction of glycemic responses.细胞 163, 1079–1094 (2015).
CAS一个 Google Scholar一个
Lartey, A. H., Li, X., Li, Z., Zhang, Q. & Wang, J. Age-and sex-specific profiles of temporal fasting plasma glucose variability in a population undergoing routine health screening.BMC公共卫生 21, 320 (2021).
CAS一个 Google Scholar一个
Fechner, E., Op’t Eyndt, C., Mulder, T. & Mensink, R. P. Diet-induced differences in estimated plasma glucose concentrations in healthy, non-diabetic adults are detected by continuous glucose monitoring—a randomized crossover trial.Nutr。res。 80, 36–43 (2020).
CAS一个 Google Scholar一个
Munan, M. et al.Acute and chronic effects of exercise on continuous glucose monitoring outcomes in type 2 diabetes: a meta-analysis.正面。内分泌。 11, 495 (2020).
Zhu, B. et al.Associations between sleep variability and cardiometabolic health: a systematic review.睡觉。医学修订版 66, 101688 (2022).
Simon, M. C., Sina, C., Ferrario, P. G., Daniel, H. & Working Group ‘Personalized Nutrition’ of the German Nutrition Society.Gut microbiome analysis for personalized nutrition: the state of science.摩尔。Nutr。Food Res. 67, 2200476 (2023).
CAS一个 Google Scholar一个
Muijs, L. T. et al.Glucose variability and mood in adults with diabetes: a systematic review.内分泌。Diabetes Metab. 4, e00152 (2021).
Ceriello, A., Monnier, L. & Owens, D. Glycaemic variability in diabetes: clinical and therapeutic implications.Lancet Diabetes Endocrinol. 7, 221–230 (2019).
Spanakis, E. K. et al.Association of glucose variability at the last day of hospitalization with 30-day readmission in adults with diabetes.BMJ Open Diabetes Res.关心 8, e000990 (2020).
Lagou, V. et al.Sex-dimorphic genetic effects and novel loci for fasting glucose and insulin variability.Nat.社区。 12, 24 (2021).
CAS一个 Google Scholar一个
Keshet, A. et al.CGMap: characterizing continuous glucose monitor data in thousands of non-diabetic individuals.细胞代谢。 35, 758–769 (2023).
CAS一个 Google Scholar一个
Shilo, S. et al.Continuous glucose monitoring and intrapersonal variability in fasting glucose.Nat.医学 30, 1424–1431 (2024).
CAS一个 Google Scholar一个
Mapes, B. M. et al.Diversity and inclusion for the All of Us research program: a scoping review.PLoS ONE 15, e0234962 (2020).
CAS一个 Google Scholar一个
Lundholm, M. D., Emanuele, M. A., Ashraf, A. & Nadeem, S. Applications and pitfalls of hemoglobin A1C and alternative methods of glycemic monitoring.J. Diabetes Complications 34, 107585 (2020).
Ceriello, A. et al.Glycaemic management in diabetes: old and new approaches.Lancet Diabetes Endocrinol. 10, 75–84 (2022).
McCarthy, M. I. Painting a new picture of personalised medicine for diabetes.Diabetologia 60, 793–799 (2017).
Tobias, D. K. et al.Second international consensus report on gaps and opportunities for the clinical translation of precision diabetes medicine.Nat.医学 29, 2438–2457 (2023).
CAS一个 Google Scholar一个
Li,L。等。Identification of type 2 diabetes subgroups through topological analysis of patient similarity.科学。翻译。医学 7, 311ra174 (2015).
Tsereteli, N. et al.Impact of insufficient sleep on dysregulated blood glucose control under standardised meal conditions.Diabetologia 65, 356–365 (2022).
CAS一个 Google Scholar一个
Wagner, R. et al.Pathophysiology-based subphenotyping of individuals at elevated risk for type 2 diabetes.Nat.医学 27, 49–57 (2021).
CAS一个 Google Scholar一个
Ravaut, M. et al.Predicting adverse outcomes due to diabetes complications with machine learning using administrative health data.NPJ Digit.医学 4, 24 (2021).
Steinhubl, S. R., Muse, E. D. & Topol, E. J. The emerging field of mobile health.科学。翻译。医学 7, 283rv283 (2015).
Inan, O. T. et al.Digitizing clinical trials.NPJ Digit.医学 3, 101 (2020).
CAS一个 Google Scholar一个
Quer, G. et al.Feasibility of wearable sensor signals and self-reported symptoms to prompt at-home testing for acute respiratory viruses in the USA (DETECT-AHEAD): a decentralised, randomised controlled trial.Lancet Digit.健康 6, e546–e554 (2024).
CAS一个 Google Scholar一个
Shilo, S. et al.10K: a largeâ€scale prospective longitudinal study in Israel.欧元。J. Epidemiol. 36, 1187–1194 (2021).
CAS一个 Google Scholar一个
ElSayed, N. A. et al.2. Classification and diagnosis of diabetes:Standards of Care in Diabetes—2023。Diabetes Care 46, S19–S40 (2023).
CAS一个 Google Scholar一个
Mouri, M. & Badireddy, M. Hyperglycemia.在StatPearls(StatPearls Publishing, 2023).
Battelino, T. et al.Continuous glucose monitoring and metrics for clinical trials: an international consensus statement.Lancet Diabetes Endocrinol. 11, 42–57 (2023).
CAS一个 Google Scholar一个
Vujkovic, M. et al.Discovery of 318 new risk loci for type 2 diabetes and related vascular outcomes among 1.4 million participants in a multi-ancestry meta-analysis.Nat.基因。 52, 680–691 (2020).
CAS一个 Google Scholar一个
Chang, C. C. et al.Second-generation PLINK: rising to the challenge of larger and richer datasets.Gigascience 4, 7 (2015).
Consortium, G. P. A global reference for human genetic variation.自然 526, 68 (2015).
Alexander, D. H., Novembre, J. & Lange, K. Fast model-based estimation of ancestry in unrelated individuals.基因组res。 19, 1655–1664 (2009).
CAS一个 Google Scholar一个
Chen, S., Zhou, Y., Chen, Y. & Gu, J. fastp: an ultra-fast all-in-one FASTQ preprocessor.生物信息学 34, i884–i890 (2018).
Langmead, B. & Salzberg, S. L. Fast gapped-read alignment with Bowtie 2.Nat.方法 9, 357–359 (2012).
CAS一个 Google Scholar一个
MagoÄ, T. & Salzberg, S. L. FLASH: fast length adjustment of short reads to improve genome assemblies.生物信息学 27, 2957–2963 (2011).
Segata, N. et al.Metagenomic microbial community profiling using unique clade-specific marker genes.Nat.方法 9, 811–814 (2012).
CAS一个 Google Scholar一个
Oral & Injectable Medications for Type 2 Diabetes(American Diabetes Association, 2025);https://diabetes.org/health-wellness/medication/oral-other-injectable-diabetes-medications
Lundberg, S. M. & Lee, S.-I.A unified approach to interpreting model predictions.在Proc。31st International Conference on Neural Information Processing Systems(eds Von Luxburg, U. et al.) 4768–4777 (Curran Associates, 2017).
致谢
Funding for this research was provided, in part, by the study sponsor, Tempus AI.The clinical trial infrastructure was also supported by the National Center for Advancing Translational Sciences at the National Institutes of Health (UM1TR004407).We thank former and/or current Tempus employees for their support of the PROGRESS study: W. Zhou, J. Dudley, N. Shamsi, S. B. Khatau and J. De Freitas.We are grateful to A. Khattab, S.-F.Chen and J. Kueper for their help during the review process.
Ethics declarations
竞争利益
R.M.is employed by Tempus AI.B.B., V.K.and E.R. are employed by CareEvolution.H.R. is employed by Pheno.AI.K.B.-M.is a consultant for CareEvolution and was on the Heartline Study Executive Committee.E.J.T.is on the Dexcom Board of Directors and on the Science Advisory Boards of Tempus AI and Pheno.AI.E.S.and H.R. have equity interest in Pheno.AI.The other authors declare no competing interests.
同行评审
Peer review information
Nature Medicinethanks Jan Verbakel and the other, anonymous, reviewer(s) for their contribution to the peer review of this work.Primary Handling Editor: Lorenzo Righetto, in collaboration with theNature Medicine团队。
附加信息
Publisher’s noteSpringer Nature remains neutral with regard to jurisdictional claims in published maps and institutional affiliations.
扩展数据
Extended Data Fig. 1 PROGRESS participants selected for the analysis.
Participants selection process from the PROGRESS cohort.T1D, type 1 diabetes.
Extended Data Fig. 2 Distribution of glucose spike metrics in the PROGRESS cohort.
Distribution of glucose spike metrics: mean glucose level, defined as the average of glucose values over the entire tracking period (一个);expected maximum spike relative value, defined as the maximum spike value relative to the baseline, averaged across different days (b);percentage of time spent above 150 mg dl−1((c);spike resolution, defined as the time required to absorb 50% of the glucose spike, averaged across all glucose spikes (d);expected daily number of spikes, defined as the daily number of glucose spikes, averaged across different days (e);nocturnal hypoglycemia, defined as the average minimum glucose value occurring between 24:00 and 7:00, averaged across different days (f)。Continuous distributions were obtained through kernel density estimation with Gaussian kernels, Scott’s bandwidth estimation method and bandwidth scaling factor equal to 0.75.
Extended Data Fig. 3 Correlations between additional glucose spike metrics and multimodal factors in the PROGRESS cohort.
Spearman’s rank correlation coefficients (dots) between glucose spike metrics representing the expected daily number of spikes, defined as the daily number of glucose spikes, averaged across different days (一个);the expected maximum spike relative value, defined as the maximum spike value relative to the baseline, averaged across different days (b);the nocturnal hypoglycemia, defined as the average minimum glucose value occurring between 24:00 and 7:00, averaged across different days (c);the percentage of time spent above 150 mg dl−1((d)。Two-sided statistical tests were used.Lines represent 95% confidence intervals.Correlations with statistically significant FDR-corrected p-values are marked with the star symbol.Multimodal factors are divided into three groups: demographic factors (top), metabolic factors (middle), and lifestyle factors (bottom).FDR, false discovery rate;P, p-value;n, sample size.
Extended Data Fig. 4 Multimodal glycemic risk profiles for HPP normoglycemic participants.
HbA1c values and multimodal glycemic risk profiles for normoglycemic participants in the HPP cohort.The multimodal glycemic risk profiles were obtained from a binary classification model trained on PROGRESS with demographics, anthropometrics, CGM, food intake, and gut microbiome as input data modalities.The blue horizontal lines represent the multimodal glycemic risk profiles median values after binning the HbA1c with intervals of width 0.4.The red vertical dashed lines mark the boundaries of the prediabetic range, spanning from 5.7% to 6.5%.
补充信息
权利和权限
开放访问This article is licensed under a Creative Commons Attribution-NonCommercial-NoDerivatives 4.0 International License, which permits any non-commercial use, sharing, distribution and reproduction in any medium or format, as long as you give appropriate credit to the original author(s) and the source, provide a link to the Creative Commons licence, and indicate if you modified the licensed material.You do not have permission under this licence to share adapted material derived from this article or parts of it.The images or other third party material in this article are included in the article’s Creative Commons licence, unless indicated otherwise in a credit line to the material.If material is not included in the article’s Creative Commons licence and your intended use is not permitted by statutory regulation or exceeds the permitted use, you will need to obtain permission directly from the copyright holder.To view a copy of this licence, visithttp://creativecommons.org/licenses/by-nc-nd/4.0/。Reprints and permissions
引用本文

Carletti, M., Pandit, J., Gadaleta, M.
等。Multimodal AI correlates of glucose spikes in people with normal glucose regulation, pre-diabetes and type 2 diabetes.Nat Med(2025)。https://doi.org/10.1038/s41591-025-03849-7
已收到:
公认:
出版:
doi:https://doi.org/10.1038/s41591-025-03849-7