
透明的人工智能启用透明的可解释和互动睡眠呼吸暂停评估跨灵活监控方案
作者:Yang, Cuiwei
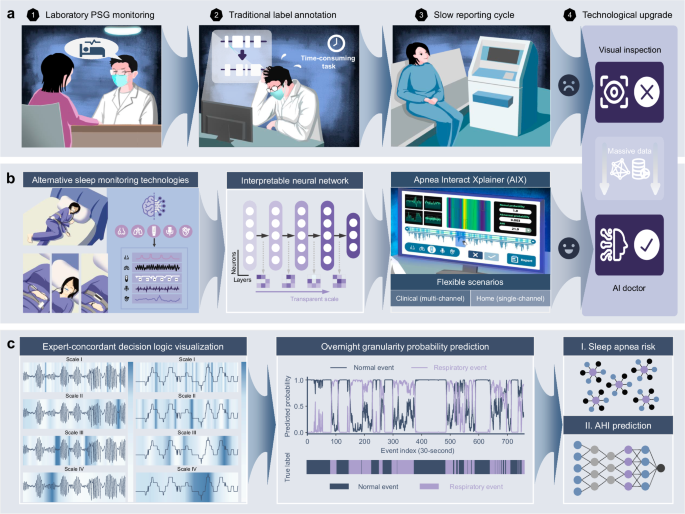
介绍
至少9.36亿(95%CI:903â970)年龄30岁的成年人在全球范围内遭受轻度至重度睡眠呼吸暂停(SA)1,一种常见的睡眠障碍,其特征是睡眠期间呼吸中断。缺氧 - 抗氧化的这些重复发作会引发氧化应激,交感神经激活和全身炎症2,导致严重的健康并发症,包括神经认知障碍3,心血管疾病4和代谢障碍5。早期诊断和干预至关重要,因为这些病理生理的变化可以在早期阶段逆转6。尽管美国等发达国家的先进医疗保健系统,但估计有75%的SA患者仍未诊断,每年经济成本超过1500亿美元7。睡眠监控的复杂且昂贵的性质(大约每次测试$ 15008)和耗时的手动分析(平均每个记录70.7分钟9)导致广泛诊断的广泛不足,尤其是在医疗资源有限的发展中国家10。由于现代生活方式的改变,不断扩大的患者人口统计数据进一步加剧了这一挑战。11。
多诊断的黄金标准,多个生理学参数和训练有素的技术人员,多诊断的金标准(PSG)需要全面的过夜监测。虽然PSG提供详细的睡眠分析,但其专用设施要求,复杂的设置程序以及由于监视环境而导致的潜在睡眠改变已限制了其广泛应用12。为了平衡睡眠监控的成本和可及性,家庭睡眠呼吸暂停测试(HSAT)13和便携式设备14已成为诊断SA的替代方法。这些方法主要收集与睡眠呼吸有关的特定渠道特定信息,提高了SA诊断的成本效益并有助于扩大筛查覆盖范围,从而提高了SA的早期检测率。此外,研究表明,使用单通道信号(例如心电图(ECG))表明了令人鼓舞的结果。15,,,,16和血氧饱和度(SPO2),作为诊断SA的替代方法,可以通过简单传感器轻松实现17,,,,18。尽管这些简化的监视方法表现出了希望,但一些基本挑战仍然存在:劳动密集型数据分析,缺乏标准化的解释以及捕获全面睡眠事件的能力有限。
鉴于人工智能的快速发展(AI)19,,,,20,,,,21耗时任务(例如睡眠分析)的算法22,,,,23,,,,24,最近的研究探索了基于AI的SA诊断方法。但是,现有方法具有几个关键局限性:(1)大多数基于ECG的研究仅进行了二进制事件分类,而无需呼吸暂停呼吸症指数(AHI)估计,并受到小型培训数据集的限制(<100个受试者)15;(2)尽管某些工作证明了可配置的通道组合的价值18,,,,25,他们的黑盒决策过程阻碍了临床采用;(3)虽然大规模的血氧仪分析已实现了有希望的AHI估计17,它缺乏用于临床综述的详细呼吸事件可追溯性。此外,这些方法都没有为现实世界实践提供可部署的AI工具。开发用于可变监视环境的工具面临着在不同人群,设备和可用频道配置之间保持稳定性的主要挑战。此外,新兴的AI医疗保健技术需要模型决策逻辑的证据26,,,,27。这种信任不足在睡眠医学中尤其有问题,在睡眠医学中,临床决策依赖于多种生理信号的复杂模式识别和解释。无法理解AI的推理过程不仅限制了临床医生对自动诊断的信心,而且还阻止了有效的人类协作来识别微妙或非典型的睡眠障碍。传统的黑盒AI方法无法利用临床医生的专业知识和经验,这对于处理边缘案例和确保患者安全至关重要。这些限制突出了对透明的AI解决方案的关键需求,该解决方案将可解释的决策与有效的专家审核能力相结合28。
在这项研究中,我们开发了呼吸暂停Xplainer(AIX),这是一种透明的交互式框架,具有基于AI的决策,灵活的传感器配置以及通过事件级的逻辑回溯的有效的人类协作(图)(图。 1)。AIX系统强调通过透明的量表扩散机制来解释模型对异常呼吸事件的推理,该机制唯一地可以对AI决策过程进行多层次的解释,从单个呼吸事件到隔夜诊断结论。我们分析了从七个独立多民族同类群体中的15,807张PSG录音,以验证包括种族,性别,年龄和BMI在内的各种人口统计的AIX表现。AIX处理三个主要信号,包括鼻气流(流),胸腔运动(胸部)和SPO的呼吸努力2在临床环境中,同时可以通过SPO进行可靠的筛选2 - 仅在基于家庭的设置中进行测量,可显着提高可访问性。通过启用灵活的监视场景和透明的AI指导决策支持,AIX提供了可扩展的解决方案,可以将SA诊断从专业的实验室程序转变为可访问的人口筛查工具,尤其有益于改善临床和家庭基于家庭设置的早期检测率,同时维持可靠的可靠诊断所必需的临床严格性。

我们的呼吸暂停XPLAINER(AIX)系统引入了透明的人工智能(AI)技术,该技术可实现专家的决策可视化,实现无缝的人机相互作用,并支持在不同临床场景上的灵活监测配置。一个传统的多仪(PSG)监测涉及复杂的传感器设置,对受试者施加负担,并依靠临床医生的手动注释,从而降低了诊断效率并限制了筛查率。bAIX系统的灵活监视配置适应家庭睡眠呼吸暂停测试(HSAT)中的简化多通道分析和基于便携式设备的家庭睡眠监控,作为传统PSG的替代方法。这些不同的输入是通过可解释的神经网络模型和用户友好的界面设计来处理的,从而促进了诊断综述期间透明的AI引导的人机相互作用。cAIX系统的分析函数通过透明的扩散机制表明了专家的决策逻辑,以及对过夜呼吸异常概率,隔夜SA风险评估和AHI回归模型的粒度预测。结果
实验程序的概述
这项工作使用七个族裔(亚洲,黑人或非裔美国人,西班牙裔,白人等)的七个异质人群,其中包括国家睡眠研究资源(NSRR)的五种:睡眠心脏健康研究(SHHS)1和2(纵向研究)
29,动脉粥样硬化多民族研究(MESA)30,男性研究(MRO)的骨质疏松性骨折31,克利夫兰家庭研究(CFS)32。其余的两个队列来自FDU-HSH睡眠研究,包括回顾性队列(n= 350)和一个前瞻性队列(n297),用于使用现实世界中的血氧仪信号来评估AIX系统的性能。这些队列包括来自多个生理传感器的15,807个PSG录音,总计超过130,000 h的通宵数字信号。我们专注于HSAT中常见的渠道33和便携式设备:流动,胸部和SPO2信号。所有信号被重新采样至均匀速率。如果录音缺乏所需的频道,在4 h下的睡眠时间或AHI小姐注释,则将被排除在外。数字 2和 3总结性别,年龄,BMI,AHI的分布以及跨人群的记录持续时间。

SHHS,睡眠心脏健康研究。梅萨,动脉粥样硬化的多种族研究。MROS,男性研究骨质疏松性骨折。CFS,克利夫兰家庭研究。FDU-HSH(回顾性/预期),福丹大学惠山医院的睡眠研究。

使用来自多个地区的不同种族人群对AI模型进行了培训。该过程旨在开发具有高概括功能的AI计算服务,从而为实施智能远程医疗服务和家庭自我监控管理提供了途径。b使用来自不同中心的数据分析了SA疾病严重程度的组成。cAHI,年龄和BMI使用小提琴图的形式使用内核密度估计(KDE)可视化。小提琴图显示了不同值的数据的概率密度,每个小提琴的宽度代表频率分布。细线扩展到每个队列的最小值和最大值。对于AHI和年龄,在预处理过程中将数据的下部截断了(Ahi€0,年龄18岁)。
AHI注释遵循美国睡眠医学学院(AASM)标准34使用ahi_a0h3a多变的。呼吸暂停定义为流量降低90%,流腹为流量降低30%,均需要10日元的持续时间和3%的氧气去饱和度。我们将呼吸暂停(阻塞性,中央,混合)和呼吸呼吸症时间戳与呼吸事件标签相结合,因为这两者都对AHI贡献也同样贡献。没有这些标签的细分市场正常,SPO2伪影段不包括在内。AASM准则34将AHI的受试者分类为健康(<5个事件/小时),轻度(¥5至<<15个事件/小时),中等(¥15至<30 evert)和严重的(¥30事件/小时)。
为了确保公正的评估和评估时间稳定性,我们对SHHS队列采用了两种不同的培训策略:(1)非重叠的SHHS模型(培训主题:n= 2789,补充图 1),其中不包括SHHS1和SHHS2之间的重叠主题进行培训和评估,从而确保了整个同类群体的数据泄漏。(2)所有shhs模型(培训主题:n= 5255,图 2),对所有可用的SHHS1主题进行培训,最大程度地利用培训数据进行性能优化。非重叠的SHHS模型主要用于SHHS2评估以避免偏见,还可以应用于评估SHHS1和SHHS2之间的时间性能。同时,全套SHHS模型是外部测试队列的参考。据报道,这两种模型的详细结果可提供对不同队列和频道配置中AIX性能的全面视图。
AIX用于AHI预测和透明颗粒状可追溯性
我们使用双模型体系结构开发AIX系统,支持灵活的监视配置(补充图。 11)。临床睡眠分期惯例34,粒度预测模型(模型1)通过对每个30-S窗口进行分类来做出事件级决策,同时结合了120-S的前面和以下信号以形成270 s的上下文段。由于严重的呼吸事件通常持续30英尺17并需要时间上下文才能准确检测,该设计确保了分类目标仍然是中央30-S窗口,但该模型具有足够的上下文来检测可能影响目标窗口的呼吸事件。该模型通过每个30 s窗口内的注意力可视化提供了颗粒状的解释,突出了异常呼吸模式的特定区域。如补充图所示 24a,注意热图直接突出了流动和SPO中感兴趣的区域2与专家注销的呼吸事件相对应的信号,提供了可追溯的事件级别的解释。
用于单渠道场景(流动,胸部或SPO2),模型1过程的输入信号[b,1,256]通过我们的透明量表扩散网络(TSD-NET),通过透明的规模扩散机制使专家逻辑可追溯性能够可视化AI决策解释的多层次注意模式,同时输出呼吸事件检测的概率值。这些30-S的概率值被串联以形成隔夜概率序列。对于多通道配置,模型1为每个通道部署并行TSD-NET,每个网络都用作功能提取器。通过沿通道维度的平均池进行平均池,并从第4阶段的输出中扁平(形状[形状[b,512,8],补充表 12),每个TSD NET输出8个抽象功能(形状[b,8])。这些特征被串联以形成24维特征向量(8个特征3通道),然后由LightGBM处理35产生过夜的概率序列。
AHI回归模型(模型2)处理这些过夜概率序列,无论是从单通道直接输出还是多通道集成。该模型生成双输出:临床严重程度分类和睡眠呼吸暂停风险指数(SARI)计算的AHI预测作为可解释的风险度量。Sari通过在概率估计中考虑事件频率和持续时间特征来补充AHI。
这种自适应体系结构使AIX能够在不同的监测配置中保持一致的分析能力,同时在颗粒事件级别提供专家的决策解释,从而支持准确的诊断和可解释的评估。
AHI回归和SA严重性分类中的灵活频道配置性能
非重叠的SHHS模型在SHHS1受试者的子集上进行了训练(n= 2789)没有与SHHS2受试者重叠的,并在其余的SHHS1录音和所有SHHS2记录上进行了测试。相比之下,对所有SHHS1主题训练了全套SHHS模型(n= 5255),并对外部队列(MESA,MROS和CFS)进行了评估。为了评估在灵活监控方案中的系统性能,我们将三通道集成(GOLD)结果作为临床参考标准进行了研究。对于AHI回归,黄金配置与R平方表现出了出色的性能(r2)和类内相关系数(ICC)值在所有测试队列中始终高于0.90:SHHS1(r2= 0.94,iccâ= 0.94),shhs2(r2= 0.96,ICC = 0.96),梅萨(r2= 0.92,ICC = 0.91),MRO(MROS)(r2= 0.96,ICC = 0.96)和CFS(r2= 0.93,ICC = 0.93)。更重要的是,对于临床应用,我们在四级SA严重性分类(正常,轻度,中度,严重)中彻底评估了系统的性能。黄金配置达到了跨人群的强大分类精度:SHHS1(ACCâ= 0.78,宏F1 = 0.78),SHHS2(ACCâ= 0.81,Macro f1 = 0.82),Mesa,Mesa,Mesa(ACCâ= - 0.74,accro f1 - 0.74,Macro f1 - 0.74),MACRO(MACROS),MRRO(MACROOS),MR MR MR- = -F1 = 0.80)和CFS(ACC = 0.80,宏F1 = 0.79)。混淆矩阵的分析(图 4)表明,分类错误主要发生在相邻的严重程度类别之间,鉴于AHI测量的连续性,这在临床上是可以接受的。这种模式与临床实践保持一致,在临床实践中,主要发生了分类范围内AHI值的病例的错误分类,对临床决策的影响有限。补充图中提供了跨不同队列的详细性能比较。 4和补充表 2,,,,3。

混淆矩阵将分类分为四个严重程度。b散点图说明了手动AHI和预测AHI之间的相关性。R平方(r2)计算值,以及代表线性回归模型的对角线,95%CI和双面p-价值。cBland-Altman图显示了手动和预测AHI的比较,误差线位于±1.96标准偏差(SD)。这p - 使用双面Wilcoxon签名级测试计算值,并提供了类内相关系数(ICC),以及所有受试者预测AHI的平均绝对误差(MAE)的平均值。绿色,黄色,粉红色和紫色散点点分别代表健康的个体,温和的SA,中等SA和严重的SA患者。d在不同性别,年龄和BMI组的黄金通道配置下AIX的性能。sâ0,sâ1,sâ2和sâ3代表四个分类场景:四级SA分类,Ahi <5对ahi-5,Ahi¥5,Ahi <15对Ahi ohi¥15,以及Ahi <30对Ahi-ahi-ahi <30。*注意:SHHS1和SHHS2的结果是使用非重叠SHHS模型获得的,该模型排除了两个队列之间的重叠对象,以确保无偏见的评估和时间绩效评估。MESA,MROS和CFS的结果基于All-SUB SHHS模型,该模型利用所有可用的SHHS1受试者来最大化培训数据。
为了验证系统对简化监视配置的适应性,我们进一步评估了单个渠道的性能(补充图。 57)。值得注意的是,Spo2 - 仅配置具有强烈的严重分类能力,仅与黄金标准:SHHS1(ACCâ= 0.79,宏F1 = 0.79),SHHS2(ACC = 0.78,宏F1 = 0.78),MESA(ACCA = 0.75)(MACRO F1-0.74),MRF1 = 74,MR(accâ= 0.79,宏F1 = 0.77)和CFS(ACC = 0.77,宏F1 = 0.78)。即使通过单渠道监测,可以保留准确的严重性分类,对于扩大筛选可访问性尤为重要。In contrast, the Flow-only configuration shows moderate performance (SHHS1: ACC = 0.62; SHHS2: ACC = 0.61; MESA: ACC = 0.48; MROS: ACC = 0.59; CFS: ACC = 0.49), while Chest-only configuration exhibits similar patterns (SHHS1: ACC = 0.62; SHHS2:ACC = 0.60; ACC = 0.48;
为了进一步验证跨严重程度的临床适用性,我们使用不同的AHI临界值分析分类性能(补充表 79)。结果表明在严重性过渡之间的性能一致。特别是对于早期SA检测(AHI截止时间为5),Spo2 - 仅配置达到所有测试队列的出色宏F1(SHHS2:0.842,MESA:0.827,MROS:0.805,CFS:0.877),与黄金标准非常匹配(SHHS2:0.874,MESA:0.874,MESA:0.829,MROS:0.829,MR:0.860,CFFS:0.860,CFFS:0.90010100100101001001000100.9001010010010.90010010。这对于人口级筛查和早期干预尤为重要。但是,spo2 - 仅配置总体上表现良好,在某些队列中仍然存在特定的挑战。基于单渠道SPO
2配置,MRO在健康类别中表现出低灵敏度(补充图。 7),与文学一致17,可能是因为其健康的受试者显示出类似于异常呼吸事件的特征。为了解决这个问题,黄金配置结合了其他呼吸道渠道,提供了补充信息以提高这种挑战性的情况。但是,黄金配置表现不足单渠道SPO2MESA中的配置可以归因于种族群体呼吸模式的差异,从而导致分布变化。此外,其他渠道捕获的呼吸特征可能不会在各种群体之间很好地推广,从而进一步降低了其在MESA中的有效性。对于在黄金配置下报告的AHI预测,SHHS2在2.92时达到了最低的MAE,解释了其出色的分类性能,而MESA由于种族变异性和上述挑战而在4.76处显示出最高的MAE,而具有金色的配置。相比之下,MROS和CFS也受益于黄金配置,分别达到3.23和3.44的MAE,反映了它们在单渠道SPO上的提高性能2这些队列中的配置。我们进一步评估了MESA,MROS和CFS队列的非重叠SHHS模型(补充图。
2和补充表 3),与All-Sub SHHS模型相比,训练受试者的数量显着减少。结果(补充图 3)在大多数队列中,两种模型之间没有显着差异,包括SHHS1,SHHS2,MESA和MROS(p> 0.05)。例如,在MESA队列中,黄金配置达到0.7406(非重叠SHHS模型)的宏F1分数,而0.7351(All-Sub SHHS模型,p= 0.3053)。但是,在CFS队列中p - 值为0.0348(宏F1:0.7798对0.7860),表明统计学意义轻微,但不是特别强的差异。这些结果表明,尽管在大多数情况下训练受试者降低了训练,但我们的方法仍保持强劲的性能,从而展示了其稳健性和适应性。
AIX的跨种群稳定性评估
我们在人群和族裔群体之间进行全面的稳定分析。对于人口亚组,我们评估两种代表性配置(黄金和SPO2)使用SHHS2,MESA,MROS和CFS的数据跨性别,年龄和BMI类别(图。 4d)。黄金配置在不同组之间保持稳定的性能。对于性别,男性的宏F1得分为0.81(n女性的= 5760)和0.77(n= 2706)。在整个年龄组中,表现保持一致,年轻人的得分为0.83(18岁<40岁,40岁,n= 191),中年成年人为0.81(40岁年龄段<60岁,n= 1162),老年人口为0.79(年龄60岁,60岁,n= 7113)。同样,对于BMI类别,该配置表现出可靠性,正常体重个体的得分为0.79(BMI <24.9,n= 1701),超重个体(24.9€bmi <29.9,29.9,29.9,n= 2965),肥胖个体为0.82(BMI€29.9,n= 1930)。在女性,老年受试者和BMI较低的患者中观察到较小的变化,这可能是由于生理差异所致。重要的是,在SPO下观察到相似的稳定模式2配置,加强这些发现(补充图。 25)。对于种族多样性验证,我们使用SHHS2,MESA和CFS队列分析了不同种族群体的系统绩效,其中包括各种背景的大量人群(补充表 5)。种族分布在各个队列之间差异很大,梅萨的多样性最高(亚洲12.08%,黑色26.60%,白色37.70%,西班牙裔23.62%),而SHHS主要包括白人受试者(85%)。结果表明,在黄金和SPO下,种族群体的表现一致
2配置(补充表 6)。在梅萨队,spo2配置达到亚洲的可比精度(ACC = 0.731,r2= 0.950),黑色(ACC = 0.760,r2= 0.930),白色(ACC = 0.741,r2= 0.916)和西班牙裔(ACC = 0.766,r2= 0.935)种群。在SHHS2中观察到类似的一致性,在黑色= 0.760,aCC = 0.760,r2= 0.951)和白色(ACC = 0.783,r2= 0.955)种群。对于亚洲人口验证,我们结合了两个回顾性(n= 327,ACC = 0.783,r2= 0.953)并预期收集(n= 265,ACC = 0.789,r2= 0.921)来自FDU-HSH的队列,该队列与单渠道SPO一起验证了系统的种族概括性2配置。这些结果表明,AIX在解决种族分布变化时的鲁棒性,同时保持不同人群的稳定绩效。此外,为了评估时间稳定性和潜在的训练偏见,我们使用2647名受试者进行纵向分析,这些受试者同时出现在SHHS1和SHHS2队列中(相距约5年)。
我们专门专注于SPO2 - 只有配置在性能和可访问性之间的最佳平衡。接受过非重叠SHHS1主题训练的模型(n3146)在两个时间点上对重叠的受试者进行测试时表现出显着的时间稳定性(补充图。” 1,,,,8和补充表 4)。对于SHHS1数据(n= 2466),它实现了ACC = 0.785,宏F1 = 0.791,带有r2= AHI预测的0.9491和ICC = 0.9477(Maeâ= 3.20±3.42)。在对SHHS2数据进行测试时,性能保持一致(n= 2,518,ACC = 0.778,宏F1 = 0.783,r2= 0.9535,ICC = 0.9524,Maeâ= 3.28±3.62),混淆矩阵显示稳定的分类模式,尤其是严重的病例(SHHS1:SEN = 0.888,SHHS2:SEN2:SEN2:SEN2:SEN2:SEN = 0.910)。Bland-Altman分析进一步证实了模型的时间稳定性,其平均差异和时间点之间一致性的限制。这种时间鲁棒性表明,模型的SA进展可靠纵向监测的潜力。
颗粒水平呼吸模式可视化的透明尺度扩散
我们通过执行我们称为透明的量表扩散可视化的外部测试队列中的内容来增强模型对呼吸事件模式的解释性。我们的平均池注意矩阵沿特征维度具有不同水平的粒度输出水平,并将其投影到信号长度上,最终以热图的形式呈现它们。我们在不同透明尺度上公开披露了模型的注意区域(补充图。 20和21)流量和SPO2信号(图 5b,c),为SA提供关键的诊断标准34。在流通通道中,该模型突出显示了气流减少90%(呼吸暂停)或30%(hybopnea)的区域,持续时间为10日元。在Spo中2渠道,该模型的重点是降低基线3%的饱和事件。可视化结果表明,模型的注意力与标准AASM评分指南的呼吸事件识别指南保持一致34。这验证了下一代透明AI技术的重要优势,使操作员能够理解AI模型的推理逻辑并增强决策信心36。Quantitative comparisons of the transparent AI framework are detailed in the Methods section (Details and advantages of transparent scale diffusion technology).

t-SNE visualization of original data and AI-extracted features from one subject across four channel types (Flow, Chest, SpO2, and Gold), showing respiratory events (n = 382 epochs) and normal events (n = 215 epochs).b,,,,cModel attention maps highlighting important regions in Flow and SpO2signals at different temporal scales, providing transparent decision logic.dt-SNE visualization shows separable clustering of true negative (TN), combined false negative and false positive (FN + FP), and true positive (TP).ePrediction confidence scores for TN (n = 302 epochs), FN + FP (n = 52 epochs), and TP (n = 376 epochs) from one subject’s overnight consecutive 30-s epochs.Incorrect predictions show significantly lower confidence scores (two-tailed Mann-Whitney U test,p = 7.07 × 10−17,,,,p = 2.07 × 10−19)。Box plots display median values (central line), with box boundaries representing the 25th percentile (bottom) and 75th percentile (top), and whiskers extending to 1.5 times the interquartile range.fMAE trends (mean ± SD) across SA severity levels for SHHS1 (n = 2466 subjects), SHHS2 (n = 2522 subjects), MESA (n = 1846 subjects), MROS (n = 3522 subjects), and CFS (n = 576 subjects) under different channel configurations.Feature separability and error analysis across channel configurationsThrough t-Distributed Stochastic Neighbor Embedding (t-SNE) visualization37, we illustrate the segment-level event features learned by the AI model based on four channel configurations (Fig.Â
5a
)。The original signal features exhibit highly overlapping distributions between respiratory and normal events, indicating the raw signals are not directly distinguishable.Among single channels, SpO2demonstrates better class separation compared to Flow and Chest signals, providing evidence for the feasibility of simplified home monitoring based on SpO2。The Gold channel, integrating three channels, exhibits the most distinct class boundaries, indicating that the richness of information among different channel types contributes to improved feature discrimination.This is further validated by quantitative evaluations across test cohorts (Supplementary Tables 1–3, Supplementary Figs. 5–7和14)。Flow (ACC = 0.482–0.621, Macro F1 = 0.390–0.607) and Chest (ACC = 0.484–0.625, Macro F1 = 0.485–0.614) show limited performance, while SpO2achieves more reliable results (ACC = 0.751–0.785, Macro F1 = 0.746–0.791), and Gold channel demonstrates the best performance (ACC = 0.738–0.810, Macro F1 = 0.737–0.817).The ROC analysis of binary event detection further confirms this trend, with AUC values ranging from 0.739–0.823 for Flow, 0.723–0.869 for Chest, 0.725–0.868 for SpO2, and 0.750–0.880 for Gold channel (Supplementary Fig. 14)。Additionally, the performance of different channel types across varying SA severity levels is displayed.
Figure 5fshows line plots depicting the MAE trends of model predictions for subjects with different severity levels across SHHS1, SHHS2, MESA, MROS, and CFS.The Gold configuration demonstrates consistently lower MAE compared to single channels, with overall MAE of 3.41 ± 3.64, 2.92 ± 3.47, 4.76 ± 5.56, 3.23 ± 3.32, and 3.44 ± 5.34 for SHHS1, SHHS2, MESA, MROS, and CFS, 分别。As severity increases, prediction errors show greater variation, with MAE increasing from 1.30 ± 1.54 in healthy subjects to 5.75 ± 5.63 in severe cases under Gold configuration in SHHS2, while SpO2shows a similar trend from 2.02 ± 2.00 to 5.46 ± 5.29.Single channels exhibit higher errors, with Flow showing MAE of 5.77 ± 5.99 and Chest showing 6.07 ± 6.58 overall in SHHS2 (Supplementary Tables 2和3)。This suggests that different MAE tolerances are required for correctly classifying the severity of AHI predictions.Given the nonlinear variation of AHI thresholds with increasing SA severity, the AI model’s ability to reasonably allocate MAE for subjects of different severity levels is crucial for improving classification performance.Lower and more stable MAE values indicate the general advantage of multi-channel configuration across various severity levels.
Human-AI collaboration feasibility of AIX
We explore the feasibility of AI model interactions through analyzing prediction confidence patterns.Clustering analysis of segment-level predictions shows that incorrect predictions concentrate in boundary regions between clusters (Fig. 5d)。Statistical analysis (two-tailed Mann-Whitney U test) examines the distribution of absolute probability differences between normal and respiratory events (Fig. 5e)。The distribution of these differences shows distinct patterns.The median values for both true negatives (TN,n = 302) and true positives (TP,n = 376) exceed 0.9 (0.944 and 0.994, respectively), while incorrect predictions (FN + FP,n = 52) exhibit substantially smaller median value of 0.276.These distinctions are highly significant (p = 7.07 × 10−17between TN and FN + FP,p = 2.07 × 10−19between TP and FN + FP).This quantifiable uncertainty pattern serves as the foundation of our trust assessment framework, providing users with reliable indicators for identifying cases requiring verification.The significant separation between confident and uncertain predictions enables a data-driven approach to building trust in the system’s decision-making process.To systematically evaluate the system’s trust-building capabilities through interactive review, we conduct experiments on both FDU-HSH retrospective (n
 = 327) and prospective (n = 265) cohorts using SpO2monitoring (Supplementary Fig. 35, Supplementary Tables 10和11)。Taking the FDU-HSH retrospective cohort as an example, we examine the relationship between interaction threshold intervals and error rates (Fig. 6a–c) to understand their trade-off patterns.For instance, with an interaction threshold interval of 0.1-0.2, we observe that 3.66% of samples are identified for review, with corresponding FP rate of 0.96% and FN rate of 0.22% (Supplementary Table 10)。This illustrates how interaction thresholds can be leveraged to balance review efficiency and error control.

The ROC curve for binary respiratory event classification by AIX based on single-channel SpO2信号。bThe ternary relationship between FP rate, FN rate, and sample proportion retrieved by AIX based on different interaction threshold intervals.cThe impact of different manual review proportions on the performance of binary respiratory event classification.dThe probability prediction distribution of different hypopnea/apnea durations in 30-s epochs across subjects, displaying the predicted probability boxplot.Hypopnea epochs (n = 7075 epochs) show moderate probability scores (mean ± SD: 0.704 ± 0.414) with higher variability, while apnea epochs (n = 8715 epochs) demonstrate consistently high probability scores (mean ± SD: 0.918 ± 0.252).Kruskal-Wallis tests reveal significant differences across duration groups for both hypopnea (p = 8.96 × 10−94) and apnea epochs (p = 7.28 × 10−256)。eAIX overnight granularity prediction for one subject, showing predicted probabilities for normal breathing and apnea-hypopnea events, ground truth event annotations, along with calculated AHI and sleep apnea risk index (SARI) values.fThe correlation between SARI and AHI (two-sided Spearman’s rank correlation test).The gray shaded area represents the 95% CI for the predicted mean values.gSARI values across SA severity groups (n = 327 subjects).Two-tailed Mann-Whitney U tests: healthy versus mild (p = 1.93 × 10−20), mild versus moderate (p = 1.09 × 10−22), moderate versus severe (p = 8.28 × 10−23)。hComparison of SARI distributions calculated with and without sleep status across AHI sub-intervals (n = 327 subjects).Data are presented as mean ± SD.Kruskal-Wallis tests show significant differences across AHI sub-intervals for both conditions (No sleep-status:p = 4.46 × 10−53, Sleep-status:p = 8.25 × 10−54)。Two-sided Spearman’s rank correlation test shows strong agreement between the two approaches (Ï = 0.994,p = 1.94 × 10−315)。我Confusion matrix of four-level SA severity classification by AIX on the FDU-HSH retrospective cohort.Box plots in (d,,,,g) show median values (central line), with box boundaries representing the 25th percentile (bottom) and 75th percentile (top), and whiskers extending to 1.5 times the interquartile range.
To validate the effectiveness of this trust-building framework, we conduct progressive performance validation experiments through selective review.The results demonstrate substantial improvements in diagnostic reliability.When reviewing 10.53% of cases (interaction threshold: 0.00–0.10), the binary event classification metrics improve from ACC = 0.867, SEN = 0.914, SPE = 0.851 to ACC = 0.911, SEN = 0.945, SPE = 0.899.Increasing review coverage to 20.40% (interaction threshold: 0.00-0.45) achieves even higher performance levels of ACC = 0.939, SEN = 0.966, SPE = 0.929 (Supplementary Table 11)。This comprehensive trust assessment framework, combining uncertainty quantification, efficient review targeting, and progressive performance validation, enables users to build trust through transparent interaction while maintaining workflow efficiency.The framework provides concrete evidence of the AIX system’s capability to achieve higher reliability through strategic human-AI collaboration, as demonstrated by the quantifiable performance improvements under different manual review coverage ratios.
AIX real-world testing and SA risk assessment
AIX supports the use of single-channel SpO2data, enabling accessible and cost-effective SA monitoring in home settings.We validate its practical applicability through external testing on both FDU-HSH retrospective (n = 327) and prospective (n = 265) cohorts (Fig. 6d–h, Supplementary Fig. 28and Supplementary Fig. 35)。The prospective validation demonstrates excellent measurement agreement (ICC = 0.9174, MAE = 5.8330) and strong correlation (r2 = 0.9207,p < 0.0001) in AHI prediction.The confusion matrix shows high sensitivity for healthy (100%) and severe (87%) cases, confirming the system’s robust diagnostic performance.The system is implemented as a portable application supporting Bluetooth data transmission from wearable SpO2传感器38(Supplementary Fig. 30), demonstrating its potential for widespread deployment in home monitoring scenarios.
To complement AHI’s event frequency measurement, we develop an overnight SA risk index (SARI) as a digital biomarker.SARI integrates both frequency and duration characteristics of respiratory events by averaging probabilities over 30-s windows throughout the night.Analysis of probability distributions within these windows reveals that SARI effectively captures two key aspects of respiratory events39(Fig. 6d): (1) longer event durations correlate with higher probability scores (Kruskal-Wallisp = 8.96 × 10−94和p = 7.28 × 10−256, respectively), and (2) apnea windows consistently receive higher predictions than hypopnea windows across all duration ranges, with mean probabilities increasing from 0.704 ± 0.414 for hypopnea to 0.918 ± 0.252 for apnea events.These characteristics enable SARI to serve as a digital risk marker that quantifies both the occurrence and severity of respiratory events (Supplementary Figs. 26和27)。
Through overnight monitoring examples (Fig. 6eand Supplementary Fig. 19), we demonstrate SARI’s strong correlation with AHI (Spearman’sÏ = 0.960,p = 9.78 × 10−182) and its ability to differentiate between severity levels (Fig. 6f, g, two-tailed Mann-Whitney你测试)。SARI exhibits significant variation across AHI sub-intervals both with and without sleep status consideration (Kruskal-Wallisp = 4.46 × 10−53和p = 8.25 × 10−54, 分别)。The strong correlation between the two assessment approaches (Spearman’sÏ = 0.994,p = 1.94 × 10−315) demonstrates that SARI maintains consistent increasing trends with AHI regardless of sleep status consideration, validating its role as a robust severity indicator.These findings are further validated in the prospective cohort, where SARI maintains a strong correlation with AHI (Spearman’sÏ = 0.952,p = 3.80 × 10−137) and demonstrates significant differences between adjacent severity levels (two-tailed Mann-Whitney你测试:p = 1.47 × 10−17for healthy versus mild,p = 1.27 × 10−16for mild versus moderate, andp = 2.57 × 10−19for moderate versus severe).
讨论
Large-scale early detection and assessment of SA remain challenging due to the lack of accurate and user-friendly AI tools suitable for both clinical and home environments.Previous research has explored various approaches for automated SA diagnosis.Early studies focused on ECG-based methods due to their potential for wearable applications.A comprehensive review by Salari et al.15showed that most machine learning (ML) and deep learning (DL) models achieved accuracies over 70% in detecting SA episodes from ECG segments.A systematic evaluation by Bahrami et al.16demonstrated that hybrid DL models could achieve 88.13% accuracy in SA detection using a single-lead ECG.However, these approaches were primarily evaluated on the Apnea-ECG dataset40with only 70 subjects, and were limited to binary classification tasks at segment-level events or subject-level SA diagnosis.While segment-level detection allows rough estimation of AHI values, this may not fully reflect the clinical severity assessment that considers additional physiological and temporal factors.Using SpO2signals, Levy et al.17developed an innovative DL model called OxiNet based on 12,923 PSG recordings from six independent cohorts.Their model achieved ICC values of 0.92–0.96 and Macro F1 scores of 0.75–0.84 across multiple external test cohorts, demonstrating the potential of single-channel oximetry for SA diagnosis.Their work established strong foundations for future exploration of real-time respiratory event detection and model interpretability.Meanwhile, multi-channel approaches have demonstrated promising results in home settings.Wang等。41proposed a wearable smart ring device using photoplethysmogram (PPG) sensors to collect pulse wave signals and SpO2synchronously.Using multiscale entropy and random forest algorithms, they validated their system on 10 subjects and achieved an accuracy of 85.99 ± 2.26% in identifying SA episodes compared to PSG, though further validation on larger cohorts would strengthen these findings.Retamales et al.18recently introduced DRIVEN using 10,643 PSG recordings from MESA, MROS and SHHS cohorts, correctly classifying 72.4% of test subjects into AHI severity classes using abdominal movement and SpO2传感器。Our recent work on IPCT-Net25leveraged 1603 HSAT recordings with a channel fusion framework.By comprehensively analyzing Flow, Chest, SpO2, pulse rate (PR) and snoring (Snore) signals, our model achievedr2of 0.939–0.959 and ICC of 0.937–0.958 in AHI estimation, while demonstrating robust performance in four-level SA severity classification (ACC = 0.722–0.764, Macro F1 = 0.677–0.717), showing comparable effectiveness between simplified and multi-channel combinations.Despite these encouraging advances, current approaches face inherent limitations in clinical adoption.The lack of transparency in model decisions makes it difficult for clinicians to validate diagnostic reasoning.Models often struggle to adapt across different monitoring configurations and equipment types.Additionally, quantitative evidence supporting optimal channel selection in clinical practice remains sparse.To address these challenges, we develop and validate AIX, a transparent, explainable AI interactive framework that introduces expert-logic consistency in SA diagnosis.The system’s robust performance in four-level SA severity classification (ACC = 0.74–0.81) and binary screening (AHI cutoff at 5) across multiple external test cohorts (ACC = 0.905–0.943 for Gold configuration, ACC = 0.885–0.933 for single-channel SpO2configuration) supports reliable clinical stratification while maintaining accessibility through simplified monitoring configurations.The significance of this work surpasses traditional diagnostic tools in several important aspects.
Most importantly, AIX, built upon a transparent AI interactive framework, represents a paradigm shift in clinical AI applications.While previous research has primarily focused on improving prediction accuracy15,,,,16,,,,18,,,,25, clinical adoption of AI has been hampered by physicians’ distrust of black-box decisions.Our investigation reveals that AI transparency not only preserves performance but also enhances diagnostic effectiveness.Across five large external test cohorts (n = 10,932), the AIX system achieves ACC values of 0.74–0.81 andr2values of 0.92–0.96 in four-level severity classification, with 99.8% of subjects either correctly classified or differing by only one severity grade.More significantly, our real-world validation in home environments demonstrates AIX’s robust performance using simplified monitoring configurations.In the retrospective cohort (n = 327), AIX maintains an ACC of 0.78 in four-level severity classification using nocturnal oximetry signals alone, with binary event classification accuracy and sensitivity improving from 0.867 and 0.914 to 0.939 and 0.966, respectively, through transparent AI-guided interactive review of approximately 20% ambiguous cases.These findings are further validated in our prospective cohort (n = 265), where the system maintains excellent performance metrics (AUC = 0.943 for respiratory event detection, ACC = 0.789 for four-level severity classification,r2 = 0.921 and ICC = 0.917 for AHI prediction) when analyzing single-channel SpO2信号。The SARI metric demonstrates significant discriminative power between adjacent severity categories (p < 0.0001 for all transitions), supporting its utility in risk stratification.These comprehensive validation results from both cohorts provide strong evidence for AIX’s reliability in simplified monitoring scenarios while maintaining high diagnostic standards.The transparent scale diffusion mechanism introduced by AIX uniquely illuminates the reasoning process underlying abnormal respiratory event detection.In contrast to previous black-box approaches that merely provide final predictions, AIX’s attention mechanism enables multi-level decision interpretation from individual respiratory events to whole-night conclusions.This transparency allows both experts and non-professionals to comprehend and validate system decisions, proving crucial for clinical adoption and trust establishment.The capability to trace event-level logic not only facilitates efficient result review by clinicians but also provides interpretable guidance for home users.By delivering detailed, interpretable respiratory analysis, AIX enables more precise subject stratification and outcome assessment in practice.This alignment between AI and clinical reasoning accelerates the integration of AI tools in both clinical and home settings.
Furthermore, AIX achieves flexible sensor configuration adaptation while maintaining high performance, which has profound implications for healthcare delivery models.Traditional approaches either rely on complex PSG setups that limit accessibility or employ simplified signals at the expense of diagnostic accuracy.The flexible configuration of AIX provides a continuous spectrum of monitoring options, enabling healthcare providers to optimize the balance between diagnostic detail and accessibility based on individual subject needs.This facilitates alternative care delivery models, such as initiating with simplified home screening and progressively incorporating additional sensors only when necessary.Such adaptive monitoring simultaneously reduces healthcare costs while preserving care quality.This versatility makes AIX particularly suitable for expanding SA diagnosis beyond specialized sleep laboratories into accessible population screening tools.The AIX workflow comprises: (1) generating 30-s granularity abnormal respiratory event predictions aligned with sleep stages, accompanied by detailed interpretable analysis, and (2) predicting AHI and the risk indicator SARI based on whole-night probability estimation sequences.This workflow preserves AIX’s capability to interpret specific events throughout the sleep process.
AIX demonstrates exceptional reliability in real-world applications.Our validation using the SHHS cohort, which comprises unattended home sleep recordings where signal quality and subject compliance may vary significantly, provides compelling evidence for AIX’s adaptability to home monitoring scenarios.The validation across these community-based cohorts demonstrates AIX’s effectiveness in populations with diverse characteristics.SHHS was designed to investigate cardiovascular outcomes in sleep-disordered breathing with participants having various cardiovascular comorbidities, including hypertension, coronary heart disease, and cerebrovascular disease.MESA focused on subclinical cardiovascular disease across ethnic groups, specifically enrolling middle-aged and older participants initially free of clinical cardiovascular disease to study disease progression.The CFS specifically examined familial aggregation of SA, demonstrating that sleep-disordered breathing clusters within families independently of obesity.MROS enrolled older men aged 65 years or older who were not selected on the basis of sleep problems or cognitive impairment to study osteoporotic fractures and cardiovascular outcomes, with participants having age-related comorbidities such as cognitive impairment and cardiovascular conditions.The robust performance maintained across these heterogeneous populations demonstrates AIX’s capability in handling diverse clinical scenarios.From family-based studies investigating genetic factors to large community-based cohorts with varying comorbidity profiles, AIX consistently delivers reliable results, indicating its readiness for real-world clinical applications involving complex interactions of genetic and environmental factors.Unlike many AI methods that perform well only in laboratory settings, AIX successfully overcomes key challenges, including training data distribution bias and model overfitting17。Validation using five large retrospective test cohorts and two external real-world test cohort demonstrates AIX’s generalization capability beyond single-center studies.The system exhibits remarkable stability across different gender, age, and BMI groups, establishing a foundation for practical clinical implementation (Fig. 4dand Supplementary Fig. 25)。Particularly noteworthy is AIX’s performance in terms of racial fairness (Supplementary Table 6)。While the open-source NSRR database primarily comprises U.S. populations (including Black or African American, Hispanic, and White individuals), the incorporation of Asian population data from Fudan University Huashan Hospital expands the system’s racial applicability, promoting more democratic AI healthcare management42。Our large-scale validation across different clinical information and racial subgroups reveals crucial insights into algorithmic fairness in healthcare.The consistent performance across demographic characteristics suggests universal features in SA respiratory patterns.However, subtle performance variations observed between subgroups indicate the need for further investigation into potential physiological differences in SA manifestation across populations, with important implications for improving AI system design and deepening understanding of disease pathophysiology.
The low operational threshold and flexible monitoring scenario adaptation of AIX significantly advance SA diagnosis popularization while reducing costs (Supplementary Fig. 34)。Traditional Lab-PSG sleep studies, requiring high-cost equipment (>$50,000) and several hours of technical time in strictly controlled laboratory environments, prove difficult to extend to home monitoring practices.While HSAT provides a more economical option with moderate equipment costs (approximately $10,000–20,000), it still demands specialized technical expertise and considerable analysis time.In contrast, AIX’s flexible workflow accommodates multiple device configurations, including portable PSG systems and simple pulse oximeters, with substantially lower per-test costs and reduced analysis time (1–10 min).This adaptability enables AIX to generate valuable analysis reports even with missing channel data, making it particularly suitable for home monitoring scenarios.Although AASM guidelines recommend single-night sleep studies for uncomplicated subjects’ SA diagnosis, evidence regarding night-to-night variability suggests the necessity of repeated monitoring43。Through providing objective and consistent AI-assisted diagnosis, AIX establishes a practical paradigm for economically feasible long-term disease progression monitoring.
Several limitations warrant consideration in this study.While our validation demonstrates robust performance in large-scale cohorts, these data predominantly originate from developed healthcare systems.Future evaluation of system performance in resource-limited settings with suboptimal monitoring conditions remains necessary.Despite validation across multiple cohorts with varying study designs and population characteristics demonstrates robustness, systematic evaluation of AIX’s performance in specific clinical subgroups, such as those with strong family history or particular comorbidities, remains an important direction for future research.Furthermore, while our results validate performance in home-based settings, further studies are needed to evaluate AIX across different home monitoring devices and in resource-limited settings.Additionally, while SpO2-based monitoring demonstrates excellent capability in detecting clinically significant SA, there are inherent physiological limitations in characterizing specific respiratory event types when using single-channel monitoring alone.Particularly, SpO2signals cannot definitively differentiate between central and obstructive events, as both may present similar desaturation patterns without the corresponding respiratory effort and airflow information34。The synchronous assessment of respiratory effort presence and airflow cessation, which is essential for distinguishing between central and obstructive events, cannot be captured through SpO2monitoring alone.However, our research demonstrates that for the primary goal of identifying SA patients requiring further evaluation, SpO2-based analysis maintains robust diagnostic effectiveness, particularly in large-scale screening applications where accessibility is paramount.Another challenge lies in achieving accurate sleep staging with limited channels.Although previous studies indicate that respiratory effort signals can achieve reliable sleep-wake classification18, SpO2signals alone show limitations in this aspect17。Future research could explore integrating additional channels (such as PPG or respiratory signals) under minimal interference principles to achieve more precise sleep staging44。Furthermore, while AIX currently focuses on respiratory event detection, its modular architecture allows future integration of additional channels like electroencephalogram (EEG), electrooculogram (EOG), and electromyogram (EMG) for comprehensive sleep stage analysis when such detailed clinical assessment is necessary45。A crucial future research direction involves evaluating whether AIX’s detailed respiratory analysis can reveal early markers of SA progression or treatment response.The system’s ability to track subtle respiratory pattern changes may enable disease progression identification before clinical symptoms appear, facilitating more proactive and personalized treatment approaches46,,,,47。
Our comprehensive analysis of demographic feature integration reveals intriguing insights into the relationship between physiological signals and subject characteristics in SA assessment.Through extensive experiments with both feature concatenation and cross-attention mechanisms (Supplementary Fig. 36), we find that continuous physiological signals alone achieve optimal diagnostic performance across cohorts.The AIX system demonstrates robust performance with Gold channel (ACC = 0.7951–0.8057, Macro F1 = 0.7853–0.8083) and maintains strong diagnostic capability even when simplified to a single-channel SpO2configuration (ACC = 0.7743–0.7851, Macro F1 = 0.7672–0.7883).As demonstrated in Supplementary Figs. 37和38, both configurations maintain high performance metrics without demographic features, withr2values (0.9254–0.9579 for Gold, 0.9334–0.9551 for SpO2) and ICC coefficients (0.9225–0.9570 for Gold, 0.9311–0.9540 for SpO2) consistently outperforming the demographic-assisted approaches (single-channel SpO2)。Regarding the choice of monitoring channels, our current focus on specific physiological signals is driven by practical considerations for widespread clinical adoption.While EEG provides valuable information for detailed sleep staging and comprehensive sleep analysis, its complex setup procedures and requirement for expert interpretation make it less suitable for large-scale screening programs, particularly in home settings.Similarly, video monitoring, while informative, raises significant privacy concerns and poses substantial data storage challenges that could impede long-term monitoring capabilities.These practical limitations, combined with our findings on the robust performance of simplified physiological monitoring, support our strategic approach of optimizing the balance between diagnostic accuracy and implementation feasibility for initial screening purposes.
Looking ahead, AIX demonstrates tremendous potential in transforming SA diagnosis from a specialized procedure into a widespread screening tool.Building on the system’s transparency and flexibility features, we envision developing smartphone applications to track fine-grained nocturnal events, significantly expanding screening coverage through interpretable decision support.In conclusion, AIX not only advances SA diagnostic technology but, more significantly, demonstrates how transparent AI can transform clinical practice.By making AI decision processes interpretable and adaptable to various clinical environments, it provides a blueprint for developing AI systems that clinicians can trust and integrate into practice.The principles demonstrated here can guide the development of transparent AI solutions for other complex medical diagnostic challenges.
方法
道德认可
This research complies with all relevant ethical regulations.For the FDU-HSH Sleep Study, the study protocol was approved by the Institutional Review Board (IRB) of Huashan Hospital, Fudan University (Approval No. KY2021-811), and all participants provided written informed consent.For the historical databases (SHHS, MESA, MROS, and CFS), data were used in accordance with the original ethical approvals and data use agreements from the NSRR.The authors affirm that human research participants provided written informed consent for publication of the images and videos in Supplementary Figs. 30,,,,34, and Supplementary Videos 1–3。
Statistics & reproducibility
This study employed a cohort analysis design using five established retrospective sleep study cohorts (SHHS1n = 5793, SHHS2n = 2651, MESAn = 2056, MROSn = 3930, CFSn = 730) for model development and validation, with additional real-world testing performed on two FDU-HSH cohorts (retrospectiven = 350 and prospectiven = 297) to develop and validate the AI-based SA diagnostic system.No statistical method was used to predetermine sample size.Sample sizes were determined by the availability of high-quality PSG recordings from the selected databases.Data were excluded based on predefined quality control criteria: lack of required physiological channels (Flow, Chest, or SpO2), sleep durations under 4 h, missing AHI annotations, and signal quality issues (SpO2artifacts and signals with SD < 0.0001).The experiments were not randomized.The investigators were not blinded to allocation during experiments and outcome assessment.Model performance was evaluated using accuracy, sensitivity, specificity, F1 score, area under the ROC curve for classification tasks, andr2, intraclass correlation coefficient, and mean absolute error for regression tasks.Statistical comparisons were performed using the Kruskal-Wallis test for multi-group comparisons, the Mann-Whitney U test for pairwise comparisons, and Spearman’s rank correlation for correlation analyses.Source code and experimental configurations have been made publicly available to ensure reproducibility.
Large-scale and multi-ethnic cohort description
All overnight PSG data in this study consist of three components: multi-channel digital signals stored in European Data Format (EDF), overnight annotation files in XML format (including the onset and duration of respiratory and other abnormal events, along with 30-s sleep stage annotations), and subject-level clinical baseline information.For sleep staging performed using the Rechtschaffen & Kales (R&K)48standard, we standardize it to the AASM34标准。In addition, we statistically assess the significant differences in all clinical information among different SA severity groups (Supplementary Table 1)。The cohorts used in this study are described as follows:
-
(1)
SHHS cohort:The SHHS cohort includes two longitudinal multicenter cohorts, referred to as Visit 1 and Visit 2. The aim is to investigate the interaction between sleep-disordered breathing and cardiovascular health, as well as other health factors, particularly the association with coronary heart disease, stroke, and hypertension risk.Visit 1 includes men and women aged 40 years or older, while Visit 2 involves a subset of participants who underwent a second PSG exam.The number of participants providing analyzable files in the two cohorts is 5793 and 2651, respectively.The timeframes for these visits range from November 1995 to January 1998 for Visit 1, and from January 2001 to June 2003 for Visit 2.
-
(2)
MESA cohort:The MESA cohort is a longitudinal investigation conducted by six collaborating centers, involving American men and women aged 45 to 84 from Black, White, Hispanic, and Chinese ethnic backgrounds.As a multi-ethnic study, its primary goal is to determine whether there are associations between subclinical atherosclerosis and sleep, as well as sleep disorders, across different genders, races, or other demographic variations.The cohort provides analyzable files for 2056 participants.
-
(3)
MROS cohort:The MROS cohort is conducted between December 2003 and March 2005 as part of the sleep research initiative within the Osteoporotic Fractures in Men study.The objective is to assess the extent to which sleep disorders are linked to adverse health outcomes, such as increased mortality, fractures, falls, and cardiovascular disease risk.Participants underwent a comprehensive PSG.The cohort includes recordings from two visits, with a total of 3930 analyzable participant files.
-
(4)
CFS cohort:The CFS cohort is a large-scale family-based study designed to quantify the familial aggregation of SA.The cohort data is collected during PSG monitoring in a clinical laboratory setting, with 730 analyzable subject files available.This cohort includes a nearly equal proportion of White and Black participants.
-
(5)
FDU-HSH cohort:The FDU-HSH cohort is a recent investigation focusing on sleep, with all participants being of Asian descent, aiming to address the lack of representation of this ethnicity in publicly available cohorts.This cohort comprises a retrospective cohort of 350 participants enrolled from January 2021 to December 2023 in clinical laboratory settings and a prospective cohort of 297 participants monitored from December 2023 to December 2024 in home environments.The retrospective cohort establishes baseline validation in clinical settings, while the prospective cohort evaluates system performance under genuine home sleeping conditions with maintained high-quality reference standards.The primary goal is to assess the potential of the AIX system in real-world data applications.For both cohorts, overnight PSG recordings are available, along with analyses of subject age, BMI, and AHI.The annotation standards for respiratory events are consistent with public cohorts (SHHS, MESA, MROS, and CFS), referencing the NSRR annotation variableahi_a0h3a, while sleep stage annotations follow the AASM guidelines.
For historical databases (SHHS, MESA, MROS, and CFS), respiratory events are initially scored without preset criteria for desaturation or arousal.Instead, sleep scoring software (such as Compumedics Profusion) preliminarily identifies apnea and hypopnea events based on airflow reductions lasting more than 10 s49。The scoring system then links these events to SpO2and EEG data, enabling researchers to retrospectively apply different standardization criteria to generate AHI variables.To ensure scoring consistency, we specifically select the AHI variableahi_a0h3athat complies with AASM 2012 recommended rules from these cohorts34。This has been confirmed through direct communication with NSRR database administrators in previous cross-cohort research17。
For our recently collected Asian cohort (FDU-HSH cohort collected after 2012), events are directly scored following AASM 2012 guidelines, with all scoring performed by certified sleep technicians.This standardized approach enables us to maintain consistent definitions of apnea and hypopnea events, ensuring valid comparisons of AHI measurements across all cohorts regardless of their original collection period.
Different channel types for different scenarios
In clinical practice, scorers primarily rely on three types of information to annotate apnea events: Flow, Chest, and SpO2。Combining these three types of information is expected to aid in the physiological detection of corresponding respiratory events.Other information, such as snoring (Snore)50and pulse rate (PR)51, can also provide further assistance.However, considering the significant number of subjects in public cohorts who lack these two channel types, they are not included.It is also worth exploring whether simplifying commonly used signal combinations in SA screening can meaningfully replace the traditional integration of the three classic types of information, pointing towards simplified and more comfortable monitoring of sleep-disordered breathing.
This study explores the topic using large-scale, multi-ethnic, multi-center sleep data, providing a foundation for the reliability of the conclusions.Our investigation includes three single-channel types (Flow/Chest/SpO2) and one multi-channel type, Gold (the integration of Flow, Chest, and SpO2)。Recent large-scale studies have compellingly demonstrated that SpO2-based analysis can achieve robust SA diagnosis, with only 0.2% missed moderate-to-severe cases compared to 21% for traditional metrics across multiple validation cohorts17。The selection of SpO2as a primary single channel is supported by both clinical and practical considerations.From a clinical perspective, SpO2directly reflects the physiological impact of breathing cessation during SA, and the AASM guidelines specifically include oxygen desaturation (≥3%) as a key criterion for scoring respiratory events34。The practical advantages of SpO2are substantial.It requires only a simple finger sensor for non-invasive monitoring, demonstrates superior signal stability with fewer artifacts compared to Flow signals requiring nasal cannulas or Chest signals requiring thoracic bands, and enables comfortable long-term monitoring in both clinical and home-based settings.These characteristics make SpO2particularly valuable for expanding screening coverage while maintaining diagnostic reliability.Some studies suggest that SA screening and classification based on single-channel SpO2information is feasible, but there is a lack of consistent cross-sectional comparisons across subject populations, especially between single-channel SpO2information and the performance of the Gold channel type.Therefore, this study examines the significance of balancing accuracy and comfort in various channel combinations.We consider two scenarios applicable to SA management: the first is a more professional-grade analysis based on the Gold channel, as it includes all the necessary information for manual review, helping to correct ambiguous samples from AI models.The second is based solely on the SpO2channel, which is easier to implement in more accessible home settings, where participants only need to monitor SpO2整夜。Finally, since Flow and SpO2contain morphological features of SA episodes, AI interpretability analysis based on these two channels is valuable, as reflected in this study’s consideration of transparency in AI model design logic.
Analysis of AHI-related factors under different gender conditions
Considering the potential differences in SA phenotypes between genders, we analyze the associations between AHI, BMI, and age using all available measurement data from SHHS1, SHHS2, MROS, CFS, and FDU-HSH (male,n = 7013;女性,n = 4694) to understand the relationships of these variables across different gender groups (MESA is excluded due to missing BMI data).This analysis helps reveal the extent to which gender influences the characteristics and pathophysiological features of SA patients (Supplementary Fig. 29)。First, we divide the cohorts into male and female categories and derive three correlation analysis groups for each gender: AHI-BMI, AHI-age, and age-BMI.We then construct scatter plots and calculate Spearman’sÏfor the variable pairs, with statistical significance assessed using two-sided tests.To better reflect the information of each variable, we also provide probability density estimates for all data points.In the AHI-BMI and AHI-age analyses, different colors (blue, light yellow, red, and black) represent healthy (AHI < 5), mild (5 ≤ AHI < 15), moderate (15 ≤ AHI < 30), and severe (AHI ≥ 30) subjects, respectively, according to the AASM guidelines34。In the age-BMI group analysis, youth (18 ≤ age < 30, light yellow), middle-aged adults (30 ≤ age < 60, red), and older adults (age ≥ 60, black) are distinguished by different color scatter points.The results show that the correlation between BMI and AHI is similar in both males (Ï = 0.2824,p < 0.0001) and females (Ï = 0.2882,p < 0.0001).However, in the correlation analysis between age and AHI, females exhibit a significant positive correlation (Ï = 0.3085,p < 0.0001), while males show no significant correlation (Ï = 0.0206,p = 0.0846), suggesting that age may be a particularly important factor for women but not for men.Additionally, we observe a significant negative correlation between age and BMI in males (Ï = −0.1848,p < 0.0001), while the correlation is weaker in females (Ï = −0.0401,p < 0.01), indicating that these factors are relatively independent in women.
Evaluation approach
The algorithm is evaluated using several metrics: accuracy (ACC, the ratio of the number of correctly classified samples among the total number of samples), sensitivity (SEN, the ratio of correctly classified events to all true events), specificity (SPE, the ratio between correctly classified non-events and all non-events), positive predictive value (PPV, the ratio of correctly classified events in all recognized events), F1 score (the harmonic mean of SEN and PPV), AUC (area under the ROC curve), and\({{R}}_{{{{\rm{AHI}}}}}^{2}\)((r2of AHI)17,,,,18:$${{{\rm{ACC}}}}(\%)=\frac{{{{\rm{TP}}}}+{{{\rm{TN}}}}}{{{{\rm{TP}}}}+{{{\rm{TN}}}}+{{{\rm{FP}}}}+{{{\rm{FN}}}}}$$(1)
$${{\mathrm{SEN}}}(\%)=\frac{{{{\rm{TP}}}}}{{{{\rm{TP}}}}+{{{\rm{FN}}}}}$$
(2)
$${{{\rm{SPE}}}}(\%)=\frac{{{{\rm{TN}}}}}{{{{\rm{TN}}}}+{{{\rm{FP}}}}}$$
(3)
$${{{\rm{PPV}}}}(\%)=\frac{{{{\rm{TP}}}}}{{{{\rm{TP}}}}+{{{\rm{FP}}}}}$$
(4)
$${{{\rm{F}}}}1(\%)=\frac{2\times {{{\rm{SEN}}}}\times
{{{\rm{PPV}}}}}{{{{\rm{SEN}}}}+{{{\rm{PPV}}}}}$$
(5)
$${{{\rm{AUC}}}}={{{\rm{Area}}}}\,({{{\rm{un
der}}}}\,{{{\rm{ROC}}}}\,{{{\rm{curve}}}})$$
(6)
$${{R}}_{{{{\rm{AHI}}}}}^{2}=1-\frac{{\sum }_{{{{\rm{sub}}}}}{({{{{\rm{AHI}}}}}_{{{{\rm{true}}}}}-{{{{\rm{AHI}}}}}_{{{{\rm{pred}}}}})}^{2}}{{\sum }_{{{{\rm{sub}}}}}{({{{{\rm{AHI}}}}}_{{{{\rm{true}}}}}-{{{{\rm{AHI}}}}}_{{{{\rm{mean}}}}})}^{2}}$$
(7)
where TP is true positive, TN is true negative, FP is false positive, and FN is false negative.
Signal quality control and data preprocessing
Due to the complexity of sleep monitoring and the susceptibility to interference signals, there are factors that disrupt the accurate AHI assessment in subjects.First, SpO2artifacts may occur due to loose sensor attachment or excessive movement.We exclude these contaminated intervals to improve AHI evaluation accuracy.
Second, subjects may improperly wear airflow sensors or thoracic bands before and after formal sleep testing, resulting in flat-line recordings with negligible signal variation.We calculate the standard deviation (SD) for these signal segments and apply an exclusion threshold of 0.0001.Signal segments with SD below this threshold are excluded.To ensure reliable sleep evaluation, we remove recordings where the duration of valid signals during sleep is less than 4 h.This data cleaning process ensures a more accurate AHI assessment.
The sampling rates of physiological signals vary considerably across different sleep cohorts.Specifically, the airflow and thoracic signals are sampled at 32 Hz in MESA and CFS cohorts, 16 Hz or 32 Hz in MROS cohort, and predominantly 8 Hz or 10 Hz in SHHS cohort.The SpO2signals maintain a consistent sampling rate of 1 Hz across all cohorts.To address these variations, we implement a standardized resampling approach that converts all 270-s segments to a fixed length of 256 points.This resampling strategy is theoretically sound as normal human respiratory rates during sleep typically range from 12 to 20 breaths per minute (0.2–0.33 Hz)52, and even during respiratory events, the fundamental frequency rarely exceeds 0.5 Hz53。Our resampling frequency (256/270 ≈ 0.95 Hz) satisfies the Nyquist sampling theorem, ensuring adequate capture of respiratory event characteristics.For SpO2signals, this sampling rate is also sufficient given the relatively gradual nature of blood oxygen variations.The effectiveness of this approach is validated by our model’s consistent performance across multiple external validation cohorts with different original sampling rates, demonstrating successful preservation of discriminative features necessary for accurate SA detection.
Performance comparison across sampling rates
To assess the impact of sampling rates on model performance, Macro F1 scores are compared across signal types (Flow, Chest, SpO2, and Gold) and four sampling rates: 0.95 Hz, 1 Hz, 4 Hz, and 10 Hz, selected based on clinical standards and prior literature54,,,,55,,,,56。The lowest rate (0.95 Hz) corresponds to performance calculated for 256-length signal segments (270-s windows), while 1 Hz reflects the relatively stable nature of SpO2signals compared to respiratory signals.To handle varying input resolutions, the TSD-Net’s Stem layer is replaced with a stack of convolutional layers that reduce inputs to a fixed length of 64. High-resolution inputs (e.g., 10 Hz) require more layers, while low-resolution inputs (e.g., 0.95 Hz, 1 Hz) require fewer.These layers are configured with appropriate kernel sizes, strides, and paddings, ensuring effective feature extraction and dimensionality reduction.
Signals are downsampled for each configuration, and Macro F1 scores are evaluated across test cohorts (SHHS2, MESA, MROS, CFS, FDU-HSH).Error bars represent 95% CIs to capture performance variability.Results indicate stable performance across most sampling rates, with minor variations (Supplementary Figs. 9和10)。For instance, in the Flow channel, SHHS1 achieves a Macro F1 score of 0.603 (95% CI: 0.591–0.615) at 0.95 Hz and 0.630 (95% CI: 0.624–0.636) at 10 Hz, showing slight improvements at higher rates.However, the Gold configuration, which integrates Flow, Chest, and SpO2signals, exhibits consistent performance across rates.For example, in SHHS2, Gold achieves 0.810 (95% CI: 0.807–0.814) at (Flow: 0.95 Hz, Chest: 0.95 Hz, SpO2: 0.95 Hz) and 0.809 (95% CI: 0.806–0.812) at (Flow: 10 Hz, Chest: 10 Hz, SpO2: 1 Hz), suggesting that SpO2compensates for information loss caused by downsampling respiratory signals.For SpO2signals, performance differences between 0.95 Hz and 1 Hz are negligible.In SHHS2, Macro F1 scores are 0.786 (95% CI: 0.783–0.789) at 0.95 Hz and 0.787 (95% CI: 0.781–0.793) at 1 Hz, reflecting the stability and low variability of SpO2信号。Notably, in cohorts like MESA, the Flow channel shows a performance decline at lower sampling rates (e.g., 0.429 at 10 Hz versus 0.399 at 0.95 Hz).However, the Gold configuration maintains robust performance, achieving 0.741 (95% CI: 0.731–0.751) at (Flow: 10 Hz, Chest: 10 Hz, SpO2: 1 Hz) compared to 0.735 (95% CI: 0.728–0.742) at (Flow: 0.95 Hz, Chest: 0.95 Hz, SpO2: 0.95 Hz).These findings demonstrate that while higher sampling rates slightly improve performance for isolated respiratory signals (Flow, Chest), the Gold configuration effectively mitigates the impact of downsampling by integrating SpO2信号。
This underscores the robustness of the proposed method and its potential for practical applications in resource-constrained environments, such as wearable devices and home-based monitoring systems, where lower sampling rates reduce computational demands without compromising performance.Granularity prediction model architectureThe study proposes the TSD-Net to comprehensively explore local and global dependencies of one-dimensional physiological signals
38
,,,,57, achieving cross-scale attention decision disclosure.TSD-Net consists of four stages, as shown in Supplementary Fig. 12。Stages 1 and 2 use the multi-scale convolutional attention (MSCA) module to capture local dependencies and model local attention.The MSCA module includes three key components: a multi-head convolutional encoder (MHCE), a cross-scale encoding fusion (CSEF) module, and a squeeze-and-excitation network (SE-Net).
MHCE aims to expand the diversity of receptive fields for a comprehensive learning of local features, while CSEF effectively integrates multi-scale local fine-grained information from different heads, maintaining the network’s lightweight structure.SE-Net applies attention mechanisms to the channel dimensions of feature maps, further enhancing information fusion.Stage 3 combines the MSCA module with the multi-head self-attention (MHSA) module to achieve a smooth transition from local to global dependencies.The final Stage 4 uses only the MHSA module to efficiently capture long-range dependencies.Detailed parameters are presented in Supplementary Table 12。
-
(1)
MSFA block:The MSCA block constitutes a primary component in both stage 1 and stage 2, comprising the MHCE module, the CSEF module, and SE-Net (Supplementary Fig. 12b)。
-
我。
MHCE module:As shown in Supplementary Fig. 12c, the MHCE module splits the input channels intondistinct heads and applies separable convolutions with different depths to each.This approach effectively captures cross-scale features, enhancing local detail capture while also reducing parameter size and computational costs:
$${{{\rm{MHCE}}}}({X})={{{\rm{Concat}}}}({{{{\rm{DW}}}}}_{{{k}}_{1}\times {{k}}_{1}}({{x}}_{1}),\ldots,{{{{\rm{DW}}}}}_{{{k}}_{{{{\rm{n}}}}}\times {{k}}_{{{{\rm{n}}}}}}({{x}}_{{{{\rm{n}}}}}))$$
(8)
这里,x1到xnsplit the original features into multiple heads along the channel dimension, focusing on different granular features through various convolutional kernel sizesk1到kn。ii。
-
CSEF module:
The CSEF module recombines and groups local features of various granularities produced by the MHCE module (Supplementary Fig. 12d)。It selects one channel from each head to form a group and performs contextual feature fusion within each group using an inverted bottleneck structure, enhancing multi-scale feature diversity.Finally, it aggregates information through pointwise convolution, facilitating the fusion of information from multiple heads within the MHCE module.公式如下:
$$M={W}_{{{{\rm{agg}}}}}([{G}_{1},{G}_{2},\ldots,{G}_{{{{\rm{M}}}}}])$$
(9)
$${G}_{i}={W}_{{{{\rm{group}}}}}([{H}_{1}^{i},{H}_{2}^{i},\ldots,{H}_{{{{\rm{N}}}}}^{i}])\qquad$$
(10)
$${{H}}_{j}^{i}={{{{\rm{DWConv}}}}}_{{{k}}_{j}\times {{k}}_{j}}({{x}}_{j}^{i})\in {{\mathbb{R}}}^{{L}\times 1}\qquad\qquad$$
(11)
在哪里\({W}_{{{{\rm{group}}}}}\)和\({W}_{{{{\rm{agg}}}}}\)represent the group and aggregation weights of pointwise convolutions, respectively.这我-th channel corresponds to the group\({G}_{{{{\rm{i}}}}}\), which consists ofndifferent heads\({H}_{{{{\rm{j}}}}}^{{{{\rm{i}}}}}\)。iii。
-
SE-Net:
The SE-Net structure (Supplementary Fig. 12e) enhances the network’s feature modeling capability through an attention mechanism.It adaptively learns the correlations among channels and dynamically adjusts the importance of different channels in the feature maps.This allows the model to focus precisely on the most meaningful features for the task.
In conclusion, assuming there exists a feature inputx, with weights\({W}_{s}\)和\({W}_{v}\)for two linear layers, the MSFA module modulates the contribution ofvthrough branchmto obtain the final outputz。公式如下:
$$Z={{{\rm{SENet}}}}(M\odot V)$$
(12)
$$V={W}_{{{{\rm{v}}}}}X$$
(13)
$$M={{{\rm{CSEF}}}}({{{\rm{MHCE}}}}({{W}}_{{{{\rm{s}}}}}{X}))$$
(14)
-
(2)
MSCA-MHSA block:Supplementary Fig. 12fpresents the composition of this block, which includes a MSCA block and a MHSA block.By interleaving the stacking of MSCA and MHSA, the transition from local information to global information is accomplished, effectively reducing computational complexity.This stacking process facilitates the evolution of information from local to global, thereby optimizing computational efficiency.
-
(3)
MHSA block:For stage 4, this study exclusively employs the MHSA block to efficiently capture long-range dependencies21。Supplementary Table 12provides detailed model parameters for different parameter configurations.The model is composed of a stem layer and stage 1 through stage 4. The stem layer includes a 1D convolution layer with a stride of 2 and an output dimension of 64 (64-d), and a batch normalization (BN) layer.Stage 1-4 each consist of two MSCA blocks, one MSCA-MHSA block, and one MHSA block.dim 64denotes an embedding dimension of 64, andsam.ep.r 2indicates an expansion rate of 2 for the CSEF module.
For a one-dimensional physiological signalp, its dimension is defined as [b,,,,c,,,,l], 在哪里brepresents batch size,crepresents the number of channels, andlrepresents the length of the signal.In this study, with an input dimension of [512,1,256], after passing through the Stem layer, the dimension becomes [512,64,64], with the number of channels reduced to 64 and the length down-sampled by a factor of 4 to 64, resulting in an output feature map size of 64 × 64.Subsequently, in the second stage, the feature map resolution is halved, and the number of channels is doubled, resulting in an output feature map size of 128 × 32.The structures of the third and fourth stages are similar to the second stage, with their output feature map sizes being 256 × 16 and 512 × 8, respectively.The final output is obtained by passing through AdaptiveAvgPool1d, Flatten, a 1-d layer, and finally, using Sigmoid to output probabilities.
Unlike traditional convolutional neural networks (CNNs) that focus only on local patterns or recurrent neural networks (RNNs) that process sequences step by step, TSD-Net combines the advantages of both convolutional and Transformer architectures.The MSCA modules effectively capture local respiratory patterns through multi-scale convolutions, while the MHSA modules, based on Transformer self-attention mechanisms, excel at modeling long-range physiological dependencies without the sequential constraints of RNNs.This hybrid architecture is particularly suitable for SA analysis, where both local respiratory events and their long-term temporal relationships are crucial for accurate diagnosis.
Lightweight metric comparison and evaluation of TSD-Net
This study introduces the TSDNet series of models, including two variants: TSDNet-B and TSDNet-T, and compares them with multiple baseline models (including ResNet18, ResNet34, ResNet50, ResNet101, EfficientNet-B0, 1D ViT-S, 1D ViT-B, 1D ViT-L, and 1D ViT-H) across four key performance metrics (Supplementary Fig. 15a–d)。
Model parameter analysis (Supplementary Fig. 15a) demonstrates TSDNet’s excellent lightweight characteristics.TSDNet-T contains 3.7 M parameters, while TSDNet-B has 10.0 M parameters.Both variants are significantly smaller than most comparison models, such as 1D ViT-H (629.7 M) and even lighter than EfficientNet-B0 (16.0 M).
Computational complexity evaluation (Supplementary Fig. 15b) shows TSDNet’s exceptional FLOPS performance.TSDNet-T achieves 0.05 Gmac FLOPS, the lowest among all comparison models, while TSDNet-B operates at 0.15 Gmac FLOPS.For reference, other models like 1D ViT-B and ResNet50 require substantially higher FLOPS (1.45 Gmac and 0.20 Gmac, respectively).
Inference time testing (Supplementary Fig. 15c), conducted on a 12th Gen Intel(R) Core(TM) i5-12600KF, 3.70 GHz CPU with 10 repeated experiments using samples of shape [1,1,256], reveals that TSDNet-T achieves 9.8 ms average inference time, while TSDNet-B requires 28.9 ms.Both outperform larger models such as 1D ViT-H (158.2 ms) and 1D Swin-B (61.9 ms).
Classification performance evaluation (Supplementary Fig. 15d) across four independent cohorts (SHHS2, MESA, MROS, and CFS) demonstrates TSDNet’s superior effectiveness.Despite its lightweight design, TSDNet achieves higher classification performance (AUC = 0.887, 95% CI: 0.882-0.892) compared to all baseline models, including larger architectures like ViT-B (AUC = 0.872, 95% CI: 0.868-0.876) and ResNet101 (AUC = 0.856, 95% CI: 0.851-0.861).
TSDNet successfully achieves an excellent balance between model complexity, computational efficiency, and classification performance.Its lightweight design and strong performance make it particularly suitable for deployment in resource-constrained environments while maintaining high classification accuracy.TSDNet-B provides solutions for tasks requiring stronger expressiveness through slightly increased complexity, while TSDNet-T offers an ideal choice for lightweight application scenarios.This flexibility makes the TSDNet series particularly suitable for various application scenarios, from resource-constrained mobile devices to complex systems requiring higher precision, proving its potential as a highly promising, scalable, and transparent DL architecture.
Details and advantages of transparent scale diffusion technology
The AIX system incorporates a transparent scale diffusion mechanism, which is a technology driven by a next-generation of transparent AI.To comprehensively evaluate our interpretability framework, we conduct systematic comparisons between TSD-Net and the widely-used Grad-CAM58method implemented on a 1D ResNet50 backbone across four external validation cohorts (SHHS2, MESA, MROS, and CFS).From each cohort, we randomly select 50 overnight recordings (totaln = 200), with particular emphasis on analyzing 30-s windows containing positive respiratory events accompanied by expert second-by-second annotations.Both TSD-Net and ResNet50 are trained with identical configurations, including early stopping criteria, to ensure fair comparison.The attention matrices from all four stages of TSD-Net and Grad-CAM attention are normalized and thresholded at 0.5 to generate high-confidence regions.Quantitative assessment using Intersection over Union (IoU) metrics (Supplementary Fig. 24and Supplementary Table 13) demonstrates TSD-Net’s superior performance, with Stage 3 achieving mean IoU scores of 0.253-0.356 for Flow and 0.228–0.323 for SpO2across cohorts, consistently outperforming Grad-CAM (mean IoU of Flow: 0.145–0.273, mean IoU of SpO2: 0.140–0.258), providing a solid decision-making basis for human interactive review.The TSD-Net consists of four stages, each meticulously designed to capture features at different scales.Comparative analyses (Supplementary Figs.Â
22和23) demonstrate that TSD-Net’s four-stage hierarchical feature importance analysis offers more comprehensive interpretability than the single-layer visualization provided by Grad-CAM on ResNet50.Stages 1 and 2 employ MSCA blocks, which include MHCE module, CSEF module, and SE-Net.The MHCE module effectively captures cross-scale features by segmenting input channels and applying separable convolutions of different depths.The CSEF module enhances the diversity of multi-scale features by reorganizing and grouping multi-granularity features from MHCE.SE-Net introduces an attention mechanism, further enhancing the network’s feature modeling capability.Stage 3 combines MSCA blocks with MHSA blocks, achieving a smooth transition from local to global dependencies.Finally, Stage 4 exclusively uses MHSA blocks to efficiently capture long-range dependencies.This progressive feature extraction process starts with an input of [b,1,256] and gradually extracts and fuses features through four stages, ultimately resulting in a highly abstract feature map of [b,512,8].The feature map resolution halves at each stage while the number of channels doubles, allowing the model to capture information at different scales, thus achieving a comprehensive understanding of complex physiological signals at different resolutions.
The core advantage of transparent scale diffusion technology lies in its visualization capability based on multi-scale attention matrices.As demonstrated in Supplementary Figs. 22–24, and Supplementary Table 13, TSD-Net exhibits robust attention distribution across all stages, with Flow channel maintaining stable high IoU scores (SHHS2: 0.315–0.330, MESA: 0.227–0.253, MROS: 0.346–0.353, CFS: 0.328–0.360) through different stages and SpO2channel showing progressive improvement from Stage 1 to Stage 4 (SHHS2: 0.218–0.328, MESA: 0.175–0.244, MROS: 0.207–0.340, CFS: 0.257–0.398).Statistical analysis shows that each stage of TSD-Net significantly outperforms Grad-CAM across all cohorts (p < 0.001 except for one comparison, Supplementary Table 13), demonstrating its superior feature representation capability.By average pooling the attention matrices output at each scale and projecting them onto the signal length to form heatmaps, the system provides multi-level interpretability perspective for the model’s decision-making process, preserving richer and more detailed transparent explanatory power for physiological signal analysis.
LightGBM model for channel feature integration
We use the traditional ML model LightGBM35to perform integrated prediction on intermediate features from the Flow, Chest, and SpO2频道。Based on the granularity prediction model, 8 features are output for each channel within a 30-s sliding window.By concatenating the features, we generate 24 features for the three channels, and then LightGBM is used to predict respiratory and normal events.We set the maximum number of leaves per tree to 31, with a learning rate of 0.05, and use 90% of the features in each iteration to avoid overfitting.The training is conducted for 100 rounds.
To justify our choice of LightGBM and ensure its superiority for our specific task, we conduct a comprehensive comparison with other classical ML models.We consider six classical ML classifiers: Support Vector Machine (SVM), artificial neural network (ANN), K-Nearest Neighbors (KNN), Random Forest (RF), Extreme Gradient Boosting (XGB), and LightGBM.We use data from SHHS1 for training, employing 11-fold cross-validation, and apply the models to test a mixed dataset from SHHS2, MESA, MROS, and CFS.The trained models are compared using ROC curves (95% CI), and the training and testing times for a single sample are measured.On both validation and test sets, RF (AUC 0.988–0.992, 0.819–0.823) and LightGBM (AUC 0.989–0.992, 0.818–0.822) demonstrate superior performance (Supplementary Fig. 16)。For a single sample, the average training and testing times (conducted on a 12th Gen Intel(R) Core(TM) i5-12600KF, 3.70 GHz CPU) are 14.34 and 0.79 microseconds for RF, and 3.80 and 0.54 microseconds for LightGBM, respectively.To enhance the operational fluidity of AIX, we adopt the LightGBM model.
To further understand the contribution of different channel features in the integration process, we conduct SHAP (SHapley Additive exPlanations) analysis on the LightGBM model.As shown in Supplementary Fig. 17, the feature-level SHAP distribution reveals the relative importance and impact of different respiratory features extracted by TSD-Net.Each point represents a sample, with color indicating the feature value (red for high, blue for low) and horizontal position showing the SHAP value (positive values indicate increased likelihood of respiratory events).The features are ordered by their mean absolute SHAP values, providing insight into which features most strongly influence the model’s predictions across different channels.
Furthermore, we perform a quantitative comparison of SHAP value magnitudes across respiratory channels (Flow, Chest, and SpO2) as presented in Supplementary Fig. 18。This channel-wise analysis demonstrates that SpO2-derived features generally exhibit higher SHAP values (mean ± SD: 3.39 ± 0.02) compared to Flow (0.54 ± 0.02) and Chest (0.73 ± 0.01) features, aligning with clinical observations about the importance of oxygen desaturation in SA diagnosis.This analysis not only validates our feature integration strategy but also provides interpretable insights into how different channels contribute to the final prediction.
AHI regression model architecture
For different channel types, the input shape of a single-channel signal is [t秒 × fs,1], wheret秒represents the number of seconds andfsrepresents the sampling rate.We train a granularity prediction model for each channel type.For single-channel scenarios, the granularity prediction model directly outputs the full-night probability sequence (normal probability and respiratory event probability).In multi-channel scenarios, the granularity prediction model acts as a feature extractor, outputting intermediate features for each channel type, which are concatenated and fed into LightGBM to generate the full-night probability sequence (Supplementary Fig. 11)。For each subject, the length of the output full-night probability sequence is resampled to 1024 using the resample function from the Python SciPy library.
Considering the generalization and prediction speed of the regression model, we define a simple AHI regression architecture, consisting of three 1D convolutional layers and two fully connected layers.The input to the regression model has a shape of [b,2,1024], wherebrepresents the number of subjects, and 2 represents the normal probability and respiratory event probability (Supplementary Fig. 13)。
模型培训
-
(1)
Model 1-granularity prediction model (TSD-Net):Training was conducted for a maximum of 100 epochs, with an early stopping patience of 15 epochs and a batch size of 512. The optimization during training employed the AdamW optimizer with a weight decay set to 0.0559。The learning rate was reduced from 0.0001 to 0.00001 using the cosine annealing schedule.
The focal loss function was utilized in Model 1, which aims to reduce the weight of classes with a large number of samples60:
$${{{\rm{FL}}}}({{p}}_{t})=-{\alpha }_{t}{(1-{{p}}_{t})}^{\gamma }\log ({{p}}_{t})$$
(15)
在哪里ptdenotes the predicted probability of belonging to the true class.γrepresents the focusing parameter, which smoothly adjusts the weight ratio of easy-to-classify samples.In this work, we setγto 2.
The key architectural hyperparameters of the model were optimized through Bayesian optimization over 100 trials.The training set was split into 80% for training and 20% for validation during the optimization process.Six critical parameters were explored: MLP expansion ratio (range: 2–8), channel expansion ratio (range: 1–4), dropout rate (range: 0.0-0.5), attention dropout rate (range: 0.0–0.5), path dropout rate (range: 0.0–0.3), and head convolution kernel size (options: 3, 5, 7, 9).Other architectural parameters, such as the number of blocks in each stage (2, 2, 8, 1), convolutional attention heads (4, 4, 4, 1), and Transformer attention heads (-1, -1, 8, 16), were adopted from validated configurations in previous studies57,,,,61。The parameter configuration achieving the lowest validation loss was selected for the subsequent experiments (Supplementary Fig. 33)。
-
(2)
Model 2-AHI regression model:Training was conducted for up to 100 epochs, with an early stopping patience of 15 epochs and a batch size of 512. During training, the optimization used the AdamW optimizer with a learning rate of 0.001, and the loss function is MSE loss:
$${{{\rm{MSE}}}}=\frac{1}{{N}}{\sum }_{{B}=1}^{{N}}({{{{\rm{AHI}}}}}_{{{{\rm{true}}}}}-{{{{\rm{AHI}}}}}_{{{{\rm{pred}}}}})$$
(16)
-
(3)
Experimental environment:As the computing environment for network training, the PyTorch (Ver. 1.13) DL framework was employed using the NVIDIA A100 GPU (NVIDIA Corporation, Santa Clara, CA, USA) with 80 GB VRAM in Python 3.9.
超参数优化
The hyperparameter optimization of TSD-Net (Model 1) was conducted through Bayesian optimization over 100 trials, revealing the relative importance of different architectural components in 30-s granular respiratory event detection (Supplementary Fig. 33)。这mlp_ratio, controlling the hidden feature expansion in feed-forward networks, showed the highest importance and converged to 2. This moderate expansion suggests that the temporal patterns in physiological signals can be effectively captured without requiring extensive feature transformation capacity.
Dropout-related parameters (drop_rate,,,,attention_drop_rate, 和path_drop_rate) ranked as the second most important group but approached zero, indicating our four-stage progressive attention design provides sufficient inherent regularization.这expand_ratio, which determines channel expansion in convolutional attention modules, stabilized at 2, achieving effective feature representation while maintaining computational efficiency.
The head convolution kernel size demonstrated relatively low importance and converged to 3. This small convolution window is sufficient for capturing local respiratory features in the initial embedding stage, preparing informative local representations for subsequent large-scale attention processing in deeper layers.
For the AHI regression model (Model 2), we adopted a proven architecture design with three convolutional layers using decreasing kernel sizes (5 → 3 → 1) followed by two fully connected layers62。This simple yet effective architecture helps prevent overfitting while enabling efficient multi-scale temporal feature extraction.The lightweight network structure with progressively reduced kernel sizes ensures both computational efficiency and robust prediction accuracy for clinical deployment.
Data augmentation
To enhance the diversity of training data and improve the generalization performance of the model, we randomly add noise perturbations to the original inputs to create additional samples.This process applies to all channel signals after z-score normalization:
$${{X}}_{{{{\rm{synthesis}}}}}={{X}}_{{{{\rm{raw}}}}}+{N}$$
(17)
$${N} \sim {{\mathcal{N}}}(0,{{\sigma }}_{{{{\rm{noise}}}}}),{{\sigma }}_{{{{\rm{noise}}}}}\in [0.005,0.01]$$
(18)
在哪里\({X}_{{{{\rm{synthesis}}}}}\)represents the synthesized signal,\({X}_{{{{\rm{raw}}}}}\)represents the original signal, andnrepresents Gaussian-distributed noise.We randomly initialize SD\({\sigma }_{{{{\rm{noise}}}}}\)to range from 0.005 to 0.01 to enhance the diversity of synthesis.This data augmentation process expands the sample variance of the input to the model, thereby mitigating overfitting.
Transparency in overnight sleep monitoring
The AIX system consists of two key components: a 30-s granularity event prediction model (Model 1) and a full-night, 30-s granularity probability AHI regression model (Model 2).The transparency scale diffusion mechanism based on Model 1 helps reveal the model’s attention to scale differences at the granularity of events, providing auxiliary interpretations for different channel features.From Model 1, we obtain a full-night, 30-s probability sequence for an individual subject, which is resampled to a length of 1024 (approximately 8.53 h) to standardize the input sequence length for Model 2. Based on this, we average the respiratory event probabilities in the sequence to generate the overnight SA risk index (SARI), which serves as an interpretable risk marker.This metric incorporates the varying lengths of respiratory events between 30-s windows, whereas the probability values help reflect these differences, providing a more nuanced consideration of event durations than the AHI value (Supplementary Fig. 11)。
Additionally, we define an interaction threshold, which is the absolute difference between the model’s 30-s probability outputs (normal and respiratory event).This metric aims to identify ambiguous predicted events and, based on the transparency scale diffusion mechanism, offers reference points for manual review of the model’s logic.As illustrated in Fig. 6a–c, the selective review of a small number of ambiguous samples can further enhance the model’s prediction performance.
The concept and cost analysis of the AIX system
The AIX system consists of a user-friendly interactive interface that facilitates operator analysis and an AI model backend designed for overnight multi-channel data analysis (Supplementary Fig. 31)。The data acquisition mode supports both overnight offline export and Bluetooth transmission, providing a comprehensive analysis of the subject’s overnight sleep-breathing status.AIX accommodates various channel configurations, making it suitable for both professional and home monitoring scenarios.For the collected overnight raw data, the backend preprocessing algorithm removes poor-quality signals and applies appropriate filtering.The AIX system ultimately provides 30-s granularity visualizations (including surrounding signals), along with corresponding model prediction probabilities and event types.The system also displays SARI and AHI for the entire night.Additionally, attention heatmaps generated through a transparent scale diffusion mechanism are overlaid on each 30-s granular signal, offering decision logic for any optional segment.Moreover, the AIX system features an interactive sample indexing and search function, allowing rapid filtering of ambiguous samples for manual review by setting interaction thresholds.Finally, the one-click export function efficiently generates intelligent SA monitoring reports in batches (Supplementary Fig. 32)。These reports contain detailed analyses of respiratory events and relevant physiological parameters during sleep, including AHI estimation and SA risk stratification assessment, to prompt subjects for timely further diagnosis and intervention.
To validate the cost-effectiveness of AIX, we conduct a comprehensive cost analysis comparing it with existing clinical solutions (Supplementary Fig. 34)。All PSG devices included in the comparison are currently in clinical use, with their prices and average testing durations provided under the guidance of sleep medicine specialists.The prices of portable/simplified devices are obtained directly from equipment manufacturers, and the AIX system processing time is experimentally verified.All prices are converted to US dollars using current exchange rates.As shown in Supplementary Fig. 34, the AIX system demonstrates significant advantages in terms of equipment cost, per-test expenses, and technical time requirements.Traditional Lab-PSG systems require substantial initial investment (approximately $68,000) and involve high per-test costs ($1000–1500) with lengthy technical operations (3–4 h).While HSAT offers a more economical alternative with lower equipment costs ($14,000) and reduced per-test expenses ($200–400), it still requires considerable technical time (approximately 1 h).In contrast, the AIX system demonstrates remarkable cost efficiency and flexibility, supporting various monitoring devices from wearable sensors to portable PSG configurations.With equipment costs as low as $15 when using a single-channel finger pulse oximeter, and since AIX can be deployed on personal laptops without additional hardware requirements, the per-test costs remain under $10, which includes disposable supplies (such as nasal cannulas), brief training requirements, equipment depreciation, and basic technical support.The technical operation time is streamlined to 1–10 min through its transparent AI-assisted interaction logic.
Demographic auxiliary value assessment in overnight AHI regression
To investigate the potential auxiliary value of demographic features in SA assessment, we explore their integration at the sequence level, hypothesizing that demographic risk factors might modulate the overall overnight respiratory patterns.We design two distinct approaches (Supplementary Fig. 36), operating on 1024-length sequences interpolated from 30-s window probabilities.The first approach employs a feature concatenation method, where demographic features (including gender, age, BMI, and race) are first processed through a demographic encoder (transforming from 4-dimensional input to 128-dimensional features through two fully connected layers), while the probability sequences are processed through three convolutional layers (with filter sizes of 5, 3, and 1, and channel dimensions of 16, 32, and 64) followed by max-pooling operations, as detailed in Supplementary Fig. 13。The flattened sequence features (8 × 1024) are then concatenated with demographic features (128) before final AHI regression through two fully connected layers.The second approach utilizes a cross-attention mechanism, where the same convolutional architecture processes probability sequences into features of shape [b,64,128], while demographic features are mapped to 64 channels through a 1 × 1 convolution.A multi-head attention module (4 heads) then uses sequence features as queries and demographic features as keys and values for dynamic feature enhancement.
Taking the single-channel SpO2configuration as an example (Supplementary Fig. 38), experiments on SHHS2, MROS, and CFS cohorts show that both demographic feature integration approaches fail to improve performance compared to the baseline system.The concatenation approach achieves accuracies of 0.7633/0.7752/0.7465 and Macro F1 scores of 0.7714/0.7564/0.7449, while the cross-attention method yields accuracies of 0.7769/0.7687/0.7604 and Macro F1 scores of 0.7821/0.7259/0.7525, both underperforming the baseline AIX system (accuracies: 0.7831/0.7851/0.7743, Macro F1: 0.7883/0.7672/0.7750).The exceptional reliability of sequence probability features, validated by highr2values (0.9526/0.9551/0.9334) and ICC coefficients (0.9514/0.9540/0.9311), suggests that direct integration of static demographic features with dynamic sequence probabilities might not be optimal, leading us to explore more fundamental representation learning strategies.CLIP-inspired framework for fine-grained feature alignmentTo address the challenge of effectively incorporating demographic information, we develop a CLIP
63
-inspired alignment framework operating at the 30-s segment level.This shift from sequence-level integration to representation learning was motivated by the observation that demographic features, while not directly beneficial for sequence-level prediction, might better serve as conditioning factors for learning more discriminative respiratory pattern representations.We design the framework at the 30-s segment level (Supplementary Fig.Â
39), trained on 3,779,943 multi-channel segments from SHHS1 (2,631,479 normal events and 1,148,464 respiratory events).To ensure fair comparison, the framework utilizes identical TSD-Net architectures as encoders (without classification heads) for Flow, Chest, and SpO2signals, each producing 8-dimensional features projected to 64-dimensional embeddings through two fully connected layers with layer normalization and ReLU activation.The demographic encoder processes 4-dimensional features (gender, age, BMI, and race) through a deeper network of four fully connected layers (4 → 32 → 64 → 128 → 64) with layer normalization, ReLU activation, and dropout.
We implement three CLIP-based learning strategies: pairwise signal alignment between each pair of physiological signals, leave-one-out alignment comparing each signal against the mean representation of the other two64, and signal-demographic alignment between each signal and demographic features.All features are normalized to unit length before computing scaled cosine similarities with a learnable temperature parameter.The model is trained using the AdamW optimizer (learning rate 1e-4) with composite loss functions weighted differently for various alignment tasks and cosine learning rate scheduling with warmup.Following CLIP’s paradigm, the encoders are pre-trained through contrastive learning with only the classification head fine-tuned for downstream tasks.
The t-SNE visualization (Supplementary Fig. 40) reveals effective cross-channel alignment between physiological signals while maintaining a natural separation between physiological and demographic feature clusters.This separation reflects the inherent complementarity between dynamic respiratory patterns and static population-level risk factors.Through contrastive learning objectives, our framework facilitates meaningful interaction between these distinct feature modalities during representation learning, while preserving their respective characteristics essential for SA detection.Further performance evaluation (Supplementary Fig. 40) demonstrates the effectiveness of this design.While our fully-supervised TSD-Net framework demonstrates superior performance with sufficient labeled data (Flow: AUC 0.7853, Chest: 0.8147, SpO2: 0.7982, Gold standard: 0.8202), the CLIP-inspired framework shows stable performance across varying amounts of labeled data (Flow: 0.6046–0.7535, Chest: 0.7065–0.7654, SpO2: 0.6647–0.7645, Gold standard: 0.7731–0.7751), maintaining reasonable performance even with limited fine-tuning (1%–10%).These results establish the CLIP-inspired framework as a valuable complementary approach, particularly in scenarios with limited labeled data availability.
报告摘要
Further information on research design is available in the Nature Portfolio Reporting Summary链接到本文。