
在机器学习下对金融市场中欺诈检测的分析
作者:Zhang, Yongqing
介绍
随着全球金融市场的持续发展,金融欺诈问题变得越来越突出,这给金融市场,消费者和投资者带来了巨大的经济损失。金融欺诈不仅损害了市场参与者的利益,而且还严重影响了金融市场的稳定性和信誉。因此,预防和确定金融欺诈已成为当今金融业的紧急问题之一。
在财务欺诈检测领域,许多学者和从业人员进行了广泛而深入的研究,并取得了丰富的研究结果。传统方法主要包括基于规则的方法和统计分析方法。基于规则的方法依靠专家的经验来制定一系列明确的规则来识别欺诈,例如设置交易量阈值,交易频率限制和其他规则,当交易数据触发这些规则时,它被判断为可疑交易1。该方法的优点是规则清晰,易于理解和解释,并且可以快速检测已知的欺诈模式。但是,它的局限性也很明显。规则的制定取决于专家经验,很难涵盖所有可能的欺诈场景。面对不断变化的新欺诈方法,更新和维护规则的成本很高,灵活性也很差。
基于统计分析的方法使用数据的统计特征来构建检测模型,例如假设检验和回归分析。通过对正常交易和欺诈交易的数据分布的统计分析,确定了正常交易的行为模式,然后将新的交易数据与此模式进行比较,并且将大大偏离正常模式的交易被判断为欺诈性交易2。该方法的优点是它可以使用数据的统计定律来检测,并且具有明显的统计特征的某些欺诈具有良好的检测效果。但是,他们通常认为数据遵守特定的分布,而实际的财务数据通常是复杂而多样的,这很难满足这些假设,从而导致了受影响的模型的准确性和可靠性。
随着机器学习(ML)技术的兴起,基于ML的方法已被广泛用于财务欺诈检测领域。常见的ML方法包括决策树(DT),支持向量机(SVM)和神经网络(NN)。DT算法通过递归将数据集分为多个子集并构建树结构来做出分类决策。它的优点是该模型是直观且易于理解的,并且可以处理多分类问题并自动选择功能3。但是,DT易于过度拟合,尤其是在复杂的数据和更多噪声的情况下,该模型的概括能力将受到很大的影响。基于统计学习理论,SVM通过找到最佳超平面来实现数据分类,该超平面在处理高维数据和非线性问题方面具有良好的性能4。SVM可以有效地处理较小的样本数据,并且具有出色的分类精度。但是,SVM的训练时间很长,尤其是对于大型数据集,计算复杂性很高。同时,SVM对选择参数和内核功能的确定敏感,这需要某些专业知识和经验来调整。
NN,尤其是深度学习及其变体中的卷积神经网络(CNN)和经常性NN(RNN),在金融欺诈检测中也表现出强大的能力。NN可以自动学习数据中的复杂功能和模式,并且可以在没有手动功能工程的情况下处理高维和非线性财务数据5。但是,NN模型通常具有大量参数,并且培训过程需要大量计算资源和数据,这很容易出现过度拟合问题,并且该模型的可解释性差,因此很难理解做出决策的基础。
基于对现有研究的深入分析,在处理大规模,高维和动态财务数据时,当前方法存在一些主要问题和缺点。在功能提取方面,传统方法通常依赖人工功能工程,这要求专家根据经验选择和构建功能,这不仅消耗了大量的人力和时间,而且很难全面,准确地捕获财务数据中的复杂功能。对于ML方法,尽管某些深度学习模型可以自动学习功能,但在处理高维数据时,它们仍然可能面临功能冗余和功能选择的问题,这会影响模型的性能和效率。
就模型泛化能力而言,财务欺诈手段正在不断变化和发展,新的欺诈模式接连出现。现有的检测模型通常在训练数据上表现良好,但是面对前所未有的欺诈情况,概括能力很弱,无法准确识别新的欺诈行为。此外,财务数据具有动态变化的特征,市场环境,用户行为和其他因素的变化将导致数据分布的变化,而模型的培训通常基于历史数据,因此很难实时适应这些变化,从而影响检测的准确性。
这项研究的目的是探索ML算法在金融市场欺诈检测中的特定应用并分析其实际效果。通过深入研究欺诈检测任务中不同ML算法的性能,这种方法可以显着提高欺诈检测的准确性,从而为金融业的风险管理提供大力支持。同时,本研究还将讨论如何优化ML模型以提高其在实际应用中的性能,并为未来的财务欺诈检测提供新的想法和方法。通过这项研究,我们可以为金融业的欺诈检测提供更科学和有效的技术手段,并为金融市场的稳定和消费者的利益做出积极贡献。
本文的结构排列如下:
第一部分(引言)详细阐述了研究背景和意义,指出了财务欺诈的危害和传统检测方法的局限性,并阐明了本文的研究目标。
第二部分(文献综述)系统地回顾了国内外财务欺诈检测领域的研究进度,比较了传统方法和机器学习技术的优势和缺点,并总结了现有研究的缺点。
第三部分(方法论)提供了研究过程的详细描述。
第四部分(实验结果和分析)介绍了性能比较,统计测试结果以及不同算法的视觉分析(P-R曲线,AUC-ROC曲线,稳定性分析等)。
第五部分(讨论)探讨了模型的实际应用价值,局限性和未来优化方向(例如计算成本,实时性能,解释性)。
第六部分(结论)总结了研究结果,并强调了改善堆叠模型的优势和空间。
文献综述
随着金融技术的快速发展,金融市场的欺诈行为日益增加,这为金融机构和个人用户带来了巨大的经济损失和安全风险。由于其固有的局限性,基于规则和统计分析的传统欺诈检测方法很难有效地应对欺诈手段的持续发展和欺诈模式的多元化。作为一种新的数据分析技术,ML以其强大的模式识别能力和自学能力显示了财务欺诈检测领域的巨大应用潜力。
财务欺诈检测一直是财务风险管理的重要领域。传统方法主要依赖于规则系统和统计分析,并通过设置一系列阈值和条件来判断交易或行为是否异常。尽管这些方法简单明了,但它们受固定规则的限制,并且很难处理日益复杂和多变的欺诈手段6,,,,7。随着技术的发展,ML方法逐渐在金融欺诈检测中占据重要地位。ML方法可以自动从数据中学习和识别模式,并且不依赖于预设规则,因此它更灵活和适应性。近年来,许多国内外的学者对这个问题进行了深入研究,并取得了一系列显着的结果。
研究表明,ML算法可以有效地识别信用卡欺诈,在线银行欺诈和其他财务欺诈8。常用的ML算法包括DT,随机森林(RF),SVM,NN)等。一些学者还提出了各种改进的算法,例如合奏学习和深度学习,以提高欺诈检测的准确性9,,,,10。
近年来,一些学者还开始关注ML在财务欺诈检测中的应用11。研究表明,ML算法在国内金融市场中还显示出良好的欺诈检测效果。国内研究主要关注信用卡欺诈和在线付款欺诈12。常用的ML算法包括逻辑回归(LR),DT,RF,XGBoost等。一些学者还提出了一些针对国内金融市场特征的改进算法和模型13,,,,14。
ML算法被广泛用于外国金融机构来检测欺诈。例如,银行使用RF算法实时监视信用卡交易,该交易有效地识别欺诈并降低了错误的警报率15。国内金融机构还开始使用ML算法来提高其欺诈检测能力。例如,付款平台使用XGBoost算法来评估在线支付交易的风险,从而提高了欺诈检测的准确性和效率16,,,,17。
机器学习(ML)算法在金融欺诈检测中的应用已取得了显着的结果。常用算法包括逻辑回归(LR),支持向量机(SVM),随机森林(RF)和神经网络(NN)。
逻辑回归通过在数据中拟合线性关系来预测欺诈的概率。它的主要优点是该模型简单易用。但是,它可能受到数据中线性的假设的限制。
支持向量机可以通过在高维空间中找到最佳的超平面来区分欺诈性行为。此方法特别适用于非线性可分离数据集。尽管有效,但SVM倾向于具有相对较高的计算复杂性18。
随机森林通过构建多个决策树(DT)并结合结果来提高预测准确性。它在处理高维数据并有助于防止过度拟合方面表现良好 19。
神经网络,尤其是深度学习模型,能够捕获复杂的非线性关系。但是,它们需要大量数据和大量的计算资源进行培训。
尽管ML方法在财务欺诈检测方面取得了显着的结果,但仍然存在一些缺点。在处理高维数据和不平衡数据集时,某些算法的性能较差。一些复杂的模型,例如深度学习网络,具有很强的性能,但解释性能力和对数据和计算资源的高要求;财务欺诈的手段正在不断变化,这需要检测模型快速适应新情况,但是在这方面,现有方法仍然需要改进。高质量的培训数据是建立有效模型的前提。但是,在实际应用中,财务数据通常存在影响模型性能的缺失,噪声和失衡等问题。在金融行业中,监管机构和用户都要求该模型可以解释。但是,一些有效的ML模型(例如深度学习)通常被视为黑匣子,很难解释他们的决策过程。借助欺诈手段的不断发展,需要连续更新模型以适应新的欺诈策略,这对维护模型的维护很高 20。
总而言之,这项研究旨在通过深入分析和比较不同ML算法在金融欺诈检测中的应用效应来找到一种更准确,有效的检测方法。同时,鉴于现有研究的缺点,本研究将探讨如何优化模型以提高其在实际应用中的性能,并为财务欺诈检测提供新的理论支持和实际指导。
方法论
数据收集和预处理
在这项研究中,为了确保数据的普遍性和代表性,通过多个渠道收集了超过100万个金融交易数据。具体而言,我们首先与10家金融机构建立了合作关系,并获得了约600,000个历史交易记录,包括信用卡交易,电子银行转让和各种帐户活动。其次,使用公共财务数据集平台Kaggle和UCI机器学习存储库收集了大约300,000个匿名数据,这些数据集为本研究提供了宝贵的信息,同时保护用户隐私。最后,与五个专业财务数据提供商合作,获得了约100,000个详细且全面的金融市场数据,其中涵盖了股票交易,债券,期货和其他金融衍生产品的信息。
收集原始数据后,采取严格的数据清洁措施,以确保数据的准确性和完整性。包括删除重复记录以消除数据冗余,处理缺失值并根据数据特征和业务逻辑选择填充,插值或删除方法,并使用统计方法和业务领域知识来检测和处理异常值,从而减少噪声数据对后续建模的负面影响。
数据预处理是ML模型培训之前的关键步骤,旨在将数据转换为适合模型学习的格式。在这项研究中,首先将数据进行标准化或标准化,以确保不同特征之间的维度的一致性,从而消除了维差异的影响。唯一的热编码技术用于编码类别数据的功能,以便模型可以有效地识别和处理这些数据。对于与时间序列相关的数据,我们应该关注时间窗口的合理分割,并从中提取有意义的功能,以捕获和利用时间序列数据中的动态信息。数据预处理结果显示在表中 1多于。
特征工程
功能工程在机器学习任务中起着关键作用,因为它需要从原始数据中提取有意义的信息并将其转换为模型可以解释和利用的形式。在这项研究中,特征工程的过程分为两个主要阶段:特征提取和特征选择。
特征的提取构成了机器学习模型胜利的关键阶段。它需要从原始数据中汲取有价值的信息并将其转换为特征向量。基本交易信息(例如数量,时间和类型)在处理金融交易数据时直接使用,为模型提供了直观的交易特征。考虑到财务欺诈可能显示时间序列的特定模式,本文分析了每次交易之前和之后的序列信息,包括时间序列特征,例如交易间隔和数量变化。此外,用户的行为模式也是调查的关键对象,用户行为的轮廓是通过计算统计数据(例如交易频率,平均交易量和最大/最小交易量)来描述的。地理位置信息也包含在功能集中。如果有的话,交易场所及其变化的频率也可以为模型提供重要的地理维度特征。
特征选择涉及消除多余且无关的功能,以简化模型并增强其性能。在这项研究中,采用递归功能消除(RFE)技术迭代识别最佳特征子集,取决于模型的性能。RFE通过递归评估逐渐较小的功能集来实现这一目标。 21。
RFE算法的序列如下:
输入:培训数据集\(\:d \),初始功能集f,所需的功能号码k 输出:选定的功能子集s |
\(s = f \)//将所选功能子集初始化为所有功能 模型=初始化基本模型()\(while〜 \左| s \ right |〜> 〜k〜做\) 模型。训练\(\ left({d,s} \ right)\)\)//使用当前功能子集s训练模型 重要性=模型。获得功能重要性()//获取当前功能子集的重要性得分 最不重要的功能=找到对应于最小重要值的功能 \(\:S = S \) - {最不重要的功能} //从功能子集中删除最不重要的功能 \(\:end \:while \) 返回s |
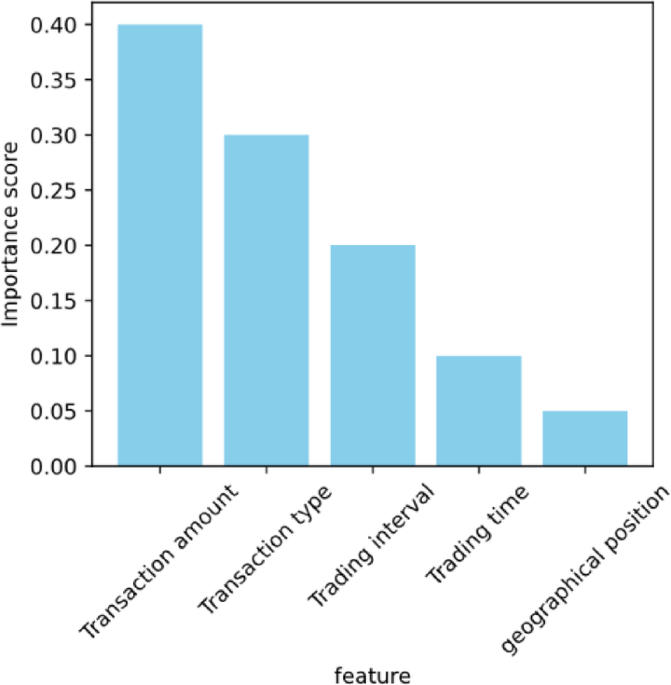
实施了RFE算法,并获得了每个功能的重要性得分。特征选择结果如图所示。 1。

特征选择结果。
可以看出,交易金额的特征具有最高的重要性得分,这表明交易金额是金融欺诈检测模型中非常重要的指标。这可能是因为欺诈交易通常涉及异常高的交易,或者在短时间内频繁进行小型交易,以避免检测。交易类型和交易间隔的特征也显示出相对较高的分数,表明它们在区分正常和欺诈交易方面起着重要作用。交易类型可能表明某些类型的交易更可能与欺诈有关,并且交易间隔的异常模式可能表明欺诈者正在试图掩盖其行为。交易时间和地理位置特征的重要性得分相对较低,但这并不意味着它们是无关紧要的。低分可能意味着这些功能在单独使用时对模型的贡献较小,但是它们仍然可以用作辅助信息与其他功能相结合以改善模型的整体性能。功能选择的结果还表明,在检测财务欺诈时,我们应该全面考虑多个维度的信息,而不是依靠单个功能。这种多种功能的综合分析有助于提高模型的概括能力和准确性。
模型构建
在这项研究中,选择堆叠合奏学习算法作为主要ML模型22。堆叠是一种强大的集成学习技术,它通过结合多个基本学习者的预测结果来构建更强大的模型。在堆叠中,在第一阶段,使用了几个不同的基本学习者来预测原始数据,在第二阶段,新的学习者被用来学习如何最好地结合这些基本学习者的预测结果。
选择堆叠算法主要是因为它可以显着提高预测性能,降低过度拟合的风险和高灵活性。通过有效整合多个基本学习者的预测结果,堆叠算法不仅可以整合每个模型的优势并提高整体预测性能,而且可以有效地降低过度拟合并通过集成多个模型来增强模型的通用能力。此外,堆叠的灵活性反映在其对各种基本学习者的支持中,这使其能够有效地识别和利用数据中的不同模式和功能,从而应对各种复杂的预测任务。
在这项研究中,探索和设计了基于堆叠的创新整合策略(图 2)。这种策略的创新在于其三个关键方面。一种是通过充分利用各种类型的基本学习者(例如DT,SVM,NN等)来捕获数据中的不同信息。其次,在堆叠的第二阶段中,要合并一个重要的加权过程。然后根据初始学习者在初始阶段确定的特征重要性得分来调整预测结果。这种方法使该模型能够更多地集中于显着影响预测的功能,从而提高了模型的整体精度。随后,设计了一种机制来动态修改学习者的权重。这种机制允许根据训练阶段的表现进行实时调整,从而确保在综合结果中提高表现的学习者更加突出。这种集成策略的整体设计旨在增强模型的预测功效,减轻过度拟合的风险,并增强模型对复杂数据模式的韧性。

基于堆叠的集成策略。
在堆叠的第一阶段,每个基本学习者将产生一组预测值,并且可以根据模型的内部评估给出特征的重要性评分。在第二阶段,这些重要性得分用于加权基础学习者的预测结果。
假设有m基础学习者,以及 \(J \)基础学习者,生成的特征重要性得分为\(\:entument {e} _ {j} \)。然后,在堆叠的第二阶段,预测结果\({p_j} \)的j - 基本学习者可以通过以下公式加权:
$$ \:{w} _ {j} = {p} _ {j} \ times \:encumentanc {e} _ {j} $$
(1)
在哪里\(\:{W} _ {J} \)是加权预测结果。这个加权过程可确保该模型更多地关注对预测结果具有很大影响的功能。
为了动态调整学习者的权重,根据验证集中每个基本学习者的性能分配权重。一种常见的方法是使用基本学习者或其他绩效指标的预测准确性作为体重的基础。假定每个迭代中都有一个验证设置以评估基础学习者的绩效。为了\(\:J \) - 基础学习者,其在验证集上的准确性为\(efcerac {y_j} \)。然后,重量\(\:{W} _ {J} \)可以通过以下公式来计算学习者:
$$ {w_j} = \ frac {{efcerac {y_j}}}} {{\ mathop \ sum \ nolimits _ {{k = 1}}}}^{m} {m} eccepACECECERA
(2)
该公式可确保表现更好的学习者在整合结果中占据更大比例。这些权重用于在堆叠的第二阶段加权基础学习者的预测结果。
模型培训和优化
在模型培训阶段,对原始数据进行清洁,转换和标准化,以确保数据质量并满足不同基本学习者的输入要求。然后,选择了各种类型的基本学习者,例如DT,SVM,NN,以使其各自的学习优势完全发挥作用。这些基本学习者首先预测原始数据并产生初步预测结果。然后,根据基本学习者的内部机制评估每个特征的重要性,并且这些分数用于在堆叠的第二阶段中对基本学习者的预测结果进行加权,以增强关键特征的影响。最后,这些加权预测结果被用作训练第二阶段元学习者的新功能集。
为了提高模型的性能,我们采用网格搜索技术以及交叉验证方法来微调基础学习者和元学习者的关键参数。这涉及系统地探索参数空间以识别最佳参数配置。设计一种机制,以动态调整学习者的体重。在交叉验证过程中,每个基本学习者的重量根据其表现动态调整。表现更好的学习者将获得更高的体重,从而在整合结果中发挥更大的作用。
为了评估模型的概括能力和性能稳定性,数据集根据70%,15%和15%的比例将数据集分为训练集,验证集和测试集。模型训练是在训练集,参数调整和模型选择的情况下进行的,最后通过验证集进行,最后在独立的测试集上评估模型的性能。
模型评估
为了彻底评估模型的性能,我们使用了多个评估指标,例如准确性,召回和F1分数。
准确性表示模型从总样本数量中正确预测的样品的比例。该指标提供了对模型总体预测能力的见解。以下提供了计算精度的公式:
$$ {{{a}} {{c}} {{c}}} {{u}}} {{r}}} {{a}}} {{a}} {{c}}}}} {{y}} = \ frac {{{{M}} {{{p}} {{o}}} {{r}} {{t}} {{t}} {{a}} {{a}} {{n}}} {{c}} {c}}}}} {{{o}} {{r}} {{{e}}}}} {{{{{{{{{{{{{o}} {{o}} {{t}} {{a} {a} {a}} {{l}} {l}}}} {{m}} {{p}} {{l}} {{e}}〜{{n}} {{n}} {{u}}} {{m}}} {m}}} {{b}} {{b}}} {
(3)
The recall rate is indicative of the percentage of actual positive instances that the model correctly identifies.It gauges the model’s efficacy in detecting true positives.The formula for calculating the recall rate is presented below:
$${{R}}{{e}}{{c}}{{a}}{{l}}{{l}}=\frac{{{{T}}{{P}}}}{{{{T}}{{P}}+{{F}}{{N}}}}$$
(4)
In the formula,\(\:{T}{P},{F}{N}\)represents true positives and false negatives, respectively.
The F1 score represents the harmonic mean between accuracy and recall, serving as a comprehensive metric to assess the model’s performance.A higher F1 score indicates superior model performance.The formula to compute the F1 score is outlined below:
$${{F}}1~{{S}}{{c}}{{o}}{{r}}{{e}}=2 \times \frac{{{{A}}{{c}}{{c}}{{u}}{{r}}{{a}}{{c}}{{y}} \times {{R}}{{e}}{{c}}{{a}}{{l}}{{l}}}}{{{{A}}{{c}}{{c}}{{u}}{{r}}{{a}}{{c}}{{y}}+{{R}}{{e}}{{c}}{{a}}{{l}}{{l}}}}$$
(5)
In order to choose the best ML model, the performances of several algorithms, including LR, DT, RF and Gradient Boosting Tree (GBT), are studied and compared.Each algorithm is evaluated on the same data set using the above evaluation indicators.By comparing the accuracy, recall and F1 score of each algorithm, the performance differences of different algorithms are found.The parameters of each basic classification model are shown in Table 2。
In this study, the experimental environment configuration includes high-performance hardware and advanced software tools.Specifically, the hardware platform equipped with Intel (R) Core (TM) i7-9700k CPU @ 3.60Â GHz processor, 32GB DDR4 RAM and 1Â TB SSD storage is studied and used to ensure the high efficiency of data processing and access.At the same time, in order to speed up the training process of NN, NVIDIA GeForce RTX 2080 Ti GPU is equipped.In terms of software, the experimental environment is based on Ubuntu 20.04 LTS operating system, and the algorithm is implemented by Python 3.12 programming language.Data processing and ML tasks mainly depend on NumPy 1.19.5, pandas 1.2.5, scikit-learn 0.24.2 and TensorFlow 2.5.0 library supported by CUDA and cuDNN.In addition, Git 2.33.0 is used for version control in order to effectively manage the code version and the experimental process.
Experimental results and analysis
To guarantee the integrity and precision of the experiment, we partition over one million financial transaction records into a training set, a validation set, and a test set.The model undergoes training using the training set, followed by parameter tuning and model selection via the validation set.Subsequently, the efficacy of each model is assessed using a distinct test set.The detailed experimental findings are presented in Table 3以下:
LR has shown some performance in financial fraud detection, but compared with other more complex models, its accuracy and recall rate are relatively low.This may be because LR has some limitations in dealing with nonlinear relationships and complex feature interactions.DT model performs slightly better than LR in the experiment, but its performance is still limited.DT may be too simple to fully capture the complex relationships in the data, resulting in some errors in predicting financial fraud.RF, as a method of ensemble learning, improves performance by constructing multiple DTs and taking their average prediction results.In the experiment, the accuracy and recall of RF are higher than those of single DT and LR, which shows the advantages of integrated learning.GBT is another powerful ensemble learning method, which constructs a series of DTs by gradually optimizing the residuals, and adds their prediction results to get the final prediction.In the experiment, the performance of GBT is better than that of RF, which shows that it has higher accuracy when dealing with complex data.
In order to verify whether the improvement of Stacking model compared with traditional algorithms such as LR, DT, RF and GBT is statistically significant in accuracy, recall and F1 score, paired t test is used to evaluate it.The results show that the performance of the Stacking model is significantly better than that of the traditional model in all three indexes, and the P value is less than 0.05, thus confirming its superiority.The results are shown in Table 4。
The Stacking ensemble learning algorithm employed in this research demonstrates superior performance in the experimental evaluation, outshining other algorithms in metrics such as accuracy, recall, and F1 score.This superiority stems from the Stacking algorithm’s capability to leverage the strengths of various base learners, further enhancing model performance through weighting and dynamic adjustments of weights.Additionally, the feature importance weighting step and the dynamic weight adjustment mechanism for learners introduced in this study notably enhance the model’s predictive accuracy.
As illustrated in Fig. 3, the Stacking model consistently occupies a higher position relative to other models, indicating that it sustains high precision across most recall levels.This means that the Stacking model can not only effectively identify more positive cases, but also has a high proportion of positive cases in these positive cases.The position and shape of the curves of LR, DT, RF and GBT in the diagram can be used to compare their performance.In general, the closer the curve is to the upper right corner, the better the performance of the model.If the curve is flatter or in a lower position, it shows that the model may sacrifice a part of precision while improving the recall rate.The Stacking model in Fig. 3shows the best balance between precision and recall, which shows that it has high accuracy and sensitivity in identifying financial fraud.

P-R curves of different models.
Figure 4clearly shows the dynamic changes of the weights of three basic learners (DT, SVM, NN) in 50 training cycles.These changes reflect the adaptive learning characteristics of the model in the training process and the contribution of each basic learner to the performance of the final integrated model.

Dynamic changes of weights of basic learners during training.
It can be seen from the figure that the weight of each basic learner is constantly changing during the whole training process.This change reflects the dynamic adjustment ability of Stacking integration strategy, which can allocate weights according to the performance of each basic learner in different training stages.Specifically, in some training periods, the weight of a basic learner may increase significantly, which indicates that the learner has a great contribution to the improvement of model performance at this stage.On the contrary, if the weight of a basic learner decreases at a certain stage, it may mean that other learners provide more effective information at that stage, or the learner has problems such as over-fitting, which leads to its performance degradation.The figure also shows the weight relationship between different base learners.In some training cycles, the weight of a learner may be dominant, while in other cycles, the weight of each learner may be more balanced.This dynamic distribution of weights helps the model to make full use of the advantages of each basic learner, thus improving the overall prediction performance.
The accuracy of the four algorithms in detecting different types of fraud is different.LR and DT show high accuracy in the detection of non-fraudulent behaviors, but the accuracy is slightly lower in the detection of credit card theft and false transactions, and there are cases of misjudgment and omission.RF maintains a high accuracy in detecting non-fraudulent behaviors, and also shows a good ability to detect credit card theft and false transactions, although there are still some misclassification cases.GBT performs well in the identification of non-fraudulent behaviors with high accuracy, and also shows good performance in the detection of credit card theft and false transactions, with the accuracy slightly higher than that of RF.Stacking method has almost reached perfect accuracy in the detection of non-fraudulent behavior, and also showed excellent performance in the detection of credit card theft and false transactions, and the accuracy is obviously higher than other algorithms (see Figs. 5,,,,6和7)。

Detection accuracy of LR and DT.

Detection accuracy of RF and GBT.

Detection accuracy of Stacking.
From LR and DT to RF, GBT, and then to Stacking method, with the increase of model complexity and the application of ensemble learning technology, the detection accuracy of different types of fraud is gradually improving.Because of its powerful integrated learning ability, Stacking method has shown the best performance in detecting all kinds of fraud.
Figure 8shows the violin diagram of the accuracy distribution of five different machine learning algorithms in many experiments.Violin chart is a visual tool combining box chart and kernel density estimation, which can intuitively show the distribution characteristics of data, including information such as concentration trend, dispersion degree and skewness of data.

Stability of performance of different models.
It can be clearly seen from Fig. 8that the distribution of the accuracy of the five algorithms in many experiments shows different characteristics.Among them, Stacking ensemble learning algorithm is particularly outstanding.It not only has the highest average accuracy, but also has a relatively narrow and long “violin†shape, which shows that its accuracy has a small fluctuation and a low variance.This feature makes Stacking ensemble learning superior to the other four algorithms in stability and overall performance.Followed by gradient lifting trees GBT and RF.These two tree-based ensemble learning methods also show good stability and performance.Although their accuracy distribution is slightly inferior to Stacking, they still remain at a high level, and the fluctuation of their distribution is relatively small.This shows that these two algorithms can keep consistent performance in many experiments.
In contrast, the performance of DT and LR is relatively poor.Although the accuracy distribution of DT is not as volatile as that of LR, its overall performance is still lower than the first three algorithms.The performance of LR is the worst among the five algorithms, and its accuracy is not only low as a whole, but also the shape of the distributed “violin†is wide and flat, which indicates that it has great fluctuation and poor stability in many experiments.
Through the comparative analysis of violin charts, we can draw the following conclusions: Stacking ensemble learning algorithm performs best in the average accuracy and stability;GBT and DT are the second, but they still have good performance and stability.However, the performance of DT and LR is relatively poor, especially in terms of stability and overall performance.

AUC-ROC curve.
From the analysis of Fig. 9, it can be seen that the Stacking ensemble model is significantly better than the basic learners with AUC of 0.896, DT of 0.887, SVM of 0.880 and neural network of 0.886, which shows the effectiveness of feature importance weighting and dynamic weight adjustment mechanism.It can achieve 90%+ TPR at low FPR(< 0.2), especially suitable for the scene where the false alarm rate needs to be controlled in financial fraud detection;Compared with DT with the best performance, the TPR of the integrated model reaches 92.5% when FPR = 0.1, that is, it can identify 5–12% points more fraudulent transactions while maintaining the false alarm rate of 10%, showing stronger discrimination ability and practical application value.
Table 5shows that the average single prediction delay of Stacking integrated model is significantly higher than that of single model due to the integration of multiple basic learners and the weighted calculation, especially the complex calculation brought by neural network increases the delay;At the same time, its training time is far longer than the traditional algorithm (up to 89%), because it needs to train multiple basic learners and meta-learners in stages, and involves grid search and cross-validation;In addition, the memory occupation of the model increases exponentially, and it is necessary to store multiple model parameters and intermediate results.If the deep learning model is used as the base learner, additional GPU memory support is needed.On the whole, the Stacking model relies on multi-threaded CPU parallel training, and if it includes neural network, it needs GPU to speed up the operation.
Under a unified experimental protocol (70%/15%/15% data partitioning, Accuracy/Recall/F1 evaluation, 5 repeated experiments), cross domain performance comparisons were conducted on multiple SOTA methods based on 4.2 million transaction data (including 1 million private data and 3.2 million public data including newly added IEEE-CIS Fraud, PaySim, and Alipay SEC).Table 6shows that the Stacking method proposed in this study (integrating DT, SVM, NN, LR, combined with feature importance weighting and dynamic weighting) performs the best with 0.950 Accuracy, 0.930 Recall, and 0.940 F1;Other methods such as GNN Fraud, TabTransformer FT, LightGBM Focal, etc. have their own advantages, but their performance decreases on specific datasets due to sparse graph structures, feature drift, or high cardinality categories.This validates the robustness and leadership of the proposed method in cross domain fraud detection.
讨论
Financial fraud is a global problem, which not only brings economic losses to the victims, but also poses a threat to the stability of the entire financial system.The fraud detection system based on Stacking integrated learning algorithm proposed in this study has high accuracy and stability, and can provide timely and accurate fraud warning for financial institutions in practical application.This helps financial institutions to find and deal with fraud in the first time, thus protecting customers’ assets, maintaining market confidence and improving the overall security and customer satisfaction of financial services.
The weighting steps of feature importance and the mechanism of dynamically adjusting the weight of learners proposed in this study also provide new ideas for financial institutions to deal with complex data.These technologies can not only improve the accuracy of fraud detection, but also be applied to credit risk assessment, market trend prediction and other fields, thus comprehensively improving the risk management ability and business efficiency of financial institutions.
ML algorithm shows great potential in financial fraud detection.They can automatically extract useful features from a large number of data and find patterns and associations hidden in the data, thus realizing accurate identification of fraud.However, these algorithms also have some limitations.The performance of ML model is highly dependent on the quality and quantity of data.If the training data is biased or insufficient, the model may not be able to accurately identify all types of fraud.ML model usually takes some time to adapt to the new fraud mode.In the realistic environment where fraudulent means are constantly changing, this may cause the model to be unable to effectively deal with new fraudulent behaviors in a short time.
In practical application, although the Stacking model is excellent in accuracy, recall and F1 score, financial institutions still need to consider other important factors when adopting the model, among which model delay and calculation cost are two crucial challenges.These factors are directly related to the feasibility and efficiency of the model in the actual business environment and have a far-reaching impact on the decision-making of financial institutions.In the detection of financial fraud, the response speed of the model is very important.The model with too high delay may lead to fraud not being identified in time, thus increasing the economic losses of financial institutions and customers.Stacking model, as an integrated learning algorithm, improves the accuracy, but it may also introduce extra computing time because it needs to run multiple basic learners at the same time and integrate them in the second stage.This may lead to the delay of the model in dealing with real-time transactions, and affect the immediacy of fraud detection.When financial institutions adopt the Stacking model, they must balance the accuracy and real-time requirements of the model to ensure that the model can meet the requirements of rapid response while ensuring the accuracy.
Calculation cost is another factor that cannot be ignored.Stacking model needs a lot of computing resources in the process of training and optimization, including high-performance CPU, GPU and a lot of memory and storage space.This may lead financial institutions to invest huge costs in hardware upgrade and maintenance.In addition, with the continuous increase of data volume and the improvement of model complexity, the calculation cost may continue to rise.When financial institutions decide to adopt the Stacking model, they need to carefully evaluate their own technical infrastructure and budget constraints to ensure that they can bear the relevant calculation costs and consider the long-term operation and maintenance costs of the model.
In order to overcome the limitations of the existing fraud detection model and improve its performance, the future research can be developed in the following directions: First, the training data set is expanded and enriched by adopting more sophisticated data enhancement technology, and at the same time, the data preprocessing step is strengthened to eliminate noise and outliers, thus improving the data quality and enhancing the generalization ability of the model.Secondly, develop a dynamic model updating mechanism that can quickly adapt to new fraudulent means, and use online learning, incremental learning or migration learning to ensure that the model maintains high efficiency in the ever-changing fraudulent environment.Further, we can explore the integration of data from different modes (such as text, image and sound) to obtain a more comprehensive perspective of fraud detection and capture the characteristics of fraud more accurately.Finally, strengthening the interpretive approach of ML model will make financial institutions understand the decision logic of the model more deeply, which will not only enhance the trust of institutions in the model, but also promote its application and promotion in business.In the future, we will explore the use of Synthetic Minority Over-sampling Technique (SMOTE) and Generative Adversarial Networks (GAN) to increase the number of rare fraud cases, thereby enhancing the model’s capability to handle imbalanced datasets.We will also investigate online learning and incremental learning methods to enable the model to adapt in real-time to new fraud patterns and market changes, maintaining its predictive accuracy.
结论
Through in-depth analysis and comparison of the application effects of different ML algorithms in financial fraud detection, this study found a method that can significantly improve the accuracy of fraud detection.In particular, Stacking ensemble learning algorithm is the best in this study, which is significantly better than other algorithms in accuracy, recall and F1 score.This is due to the fact that Stacking algorithm can make full use of the advantages of multiple basic learners, and further improve the performance of the model through the weighting step of feature importance and the mechanism of dynamically adjusting the weights of learners.However, the ML method has the problem of performance degradation when dealing with high-dimensional data and unbalanced data sets, and some complex models, such as deep learning network, have strong performance but poor explanatory power, which requires high data and computing resources.In addition, the continuous updating and changes of financial fraud means require that the detection model can adapt to the new situation quickly, and the existing methods still need to be improved in this respect.
数据可用性
The datasets used and/or analyzed during the current study are available from the corresponding author Jing Jin on reasonable request via e-mail jinj@sumhs.edu.cn.
参考
Zioviris, G., Kolomvatsos, K. & Stamoulis, G. Credit card fraud detection using a deep learning multistage model.J. Supercomputing。78(12), 14571–14596 (2022).Google Scholar
一个 Rohith, B. C. & Nelson, M. Artificial intelligence based credit card fraud detection for online transactions optimized with sparrow search algorithm.
int。J. Perform.工程。 19(9), 624–632 (2023).
Li, C., Ding, N., Zhai, Y. & Dong, H. Comparative study on credit card fraud detection based on different support vector machines.Intell.Data Anal. 25(1), 105–119 (2021).
Ata, O. & Hazim, L. Comparative analysis of different distributions dataset by using data mining techniques on credit card fraud detection.Tehnicki Vjesnik, TehniÄki vjesnik 27, 2(2020)(1848–6339), 618–626.(2020).
Ahirwar, A., Sharma, N. & Bano, A. Enhanced Smote & fast random forest techniques for credit card fraud detection.Solid State Technol. 63(6), 4721–4733 (2020).
Darwish, S. M. An intelligent credit card fraud detection approach based on semantic fusion of two classifiers.柔软的。Comput. 24(2), 1243–1253 (2020).
Mishra, K. N. & Pandey, S. C. Fraud prediction in smart societies using logistic regression and k-fold machine learning techniques.Wireless Pers.社区。 119(3), 1–27 (2021).
Fajardo, V. A., Findlay, D., Jaiswal, C., Yin, X. & Emerson, D. B. On oversampling imbalanced data with deep conditional generative models.Expert Syst.应用。 169(9), 114463 (2020).
Li, X., Wang, J. & Yang, C. Risk prediction in financial management of listed companies based on optimized Bp neural network under digital economy.Neural Comput.应用。 35(3), 2045–2058 (2023).
Ni, D., Lim, M. K., Li, X., Qu, Y. & Yang, M. Monitoring corporate credit risk with multiple data sources.Industrial Manage.Data Syst. 123(2), 434–450 (2023).
Zheng, X. L., Zhu, M. Y., Li, Q. B., Chen, C. C. & Tan, Y. C. Finbrain: when finance Meets Ai 2.0.正面。通知。技术。电子。工程。 20(7), 914–924 (2019).
Zhu, Z. & Liu, N. Early warning of financial risk based on k-means clustering algorithm.Complexity, 2021(24), 1–12.(2021)。
Bouker, S. & Mansouri, F. Correction to: Sovereign contagion risk measure across financial markets in the eurozone: a bivariate copulas and Markov regime switching arma based approaches.Rev. World Econ. 159(1), 255–255 (2023).
Du, G. & Elston, F. Retraction note: Financial risk assessment to improve the accuracy of Financial prediction in the internet Financial industry using data analytics models.Oper.管理。res。 17(2), 805–805 (2024).
Ivanova, M. N. et al.Yesterday is history, tomorrow is a mystery: directors’ and ceos’ prior bankruptcy experiences and the financial risk of their current firms.J. Bus.Finance Acc. 51(1–2), 595–630 (2024).
Sacks, D. W., Vu, K., Huang, T. Y. & Karaca-Mandic, P. How do insurance firms respond to financial risk sharing regulations?Evidence from the affordable care act.Health Econ. 30(6), 1443–1460 (2021).
PubMed一个 Google Scholar一个
Hartnett, N., Gerrans, P. & Faff, R. Trusting clients’ financial risk tolerance survey scores.Financial Anal.J. 75(2), 91–104 (2019).
Scharding, T. Structured finance and the social contract: how tranching challenges contractualist approaches to financial risk.公共汽车。Ethics Q. 29(1), 1–24 (2019).
Weagley, D. Financial sector stress and risk sharing: evidence from the weather derivatives market.Rev. Financial Stud. 32(6), 2456–2497 (2019).
Katarzyna SekciÅ„ska, Jaworska, D., Rudzinska-Wojciechowska, J. & Kusev, P. The effects of activating gender-related social roles on financial risk-taking.经验。Psychol. 70(1), 40–50 (2023).
Coelho, E. D. O. P., Aquila, G., Bonatto, B. D., Balestrassi, P. P. & Nakamura, W. T. Regulatory impact of photovoltaic prosumer policies in Brazil based on a financial risk analysis.Utilities Policy。70(3), 101214 (2021).
Judit Oláh, Virglerova, Z., József Popp, Kliestikova, J. & Sándor Kovács.The assessment of non-financial risk sources of Smes in the v4 countries and Serbia.可持续性 11(17), 4806 (2019).
资金
This research received no external funding.
Ethics declarations
竞争利益
作者没有宣称没有竞争利益。
道德声明
This article does not contain any studies with human participants or animals performed by any of the authors.All methods were performed in accordance with relevant guidelines and regulations.
附加信息
Publisher’s note
关于已发表的地图和机构隶属关系中的管辖权主张,Springer自然仍然是中立的。
权利和权限
Open AccessThis article is licensed under a Creative Commons Attribution-NonCommercial-NoDerivatives 4.0 International License, which permits any non-commercial use, sharing, distribution and reproduction in any medium or format, as long as you give appropriate credit to the original author(s) and the source, provide a link to the Creative Commons licence, and indicate if you modified the licensed material.您没有根据本许可证的许可来共享本文或部分内容的改编材料。The images or other third party material in this article are included in the article’s Creative Commons licence, unless indicated otherwise in a credit line to the material.If material is not included in the article’s Creative Commons licence and your intended use is not permitted by statutory regulation or exceeds the permitted use, you will need to obtain permission directly from the copyright holder.To view a copy of this licence, visithttp://creativecommons.org/licenses/by-nc-nd/4.0/。重印和权限
Cite this article

Jin, J., Zhang, Y. The analysis of fraud detection in financial market under machine learning.
Sci代表15 , 29959 (2025).https://doi.org/10.1038/s41598-025-15783-2
已收到:
公认:
出版:
doi:https://doi.org/10.1038/s41598-025-15783-2