
多发性硬化症进展的AI驱动重新分类
作者:Holmes, Chris C.
抽象的
多发性硬化症(MS)影响290万人。将MS分为不同的亚型的传统分类反映了其病原体学,并且预测疾病进化和治疗反应的价值有限,从而阻碍了药物发现。在这里,我们通过分析大型临床试验数据库(大约8,000名患者,118,000例患者就诊和35,000多个磁共振成像扫描),报告了MS疾病进化的数据驱动分类。四个维度定义了MS疾病:身体残疾,脑损伤,复发和亚临床疾病活动。早期/轻度/演变(EME)MS和高级MS代表疾病严重程度谱的两个极点。EME MS的患者显示出有限的临床障碍和脑部较小的脑损伤。通过炎症态,有或没有伴随的症状,通过脑损伤积累而过渡到高级MS。高级MS的特征是中度至高残疾水平,放射学疾病负担和疾病进展的风险独立于复发,而返回早期MS状态的可能性很小。我们在独立的临床试验数据库和现实世界中验证了这些结果,总计4,000多名MS患者。我们的发现支持将MS视为疾病连续性。我们提出一种简化的疾病分类,以提供对疾病的统一理解,改善患者管理并提高药物发现效率和精度。
主要的
MS是中枢神经系统(CNS)的一种使人衰弱的疾病,影响了全球约290万个人(三分之一的人)1,,,,2。MS课程描述符,通过临床共识定义和修订3,,,,4,在诊所和临床试验的设计和招聘中有帮助患者的医师对话。这些临床疾病课程描述符复发复发的MS(RRMS),次级进行性MS(SPM)和原发性MS(PPM)对药物开发产生了重大影响,因为它们被用来描述了对MS的居住的人的实际管理,因为它们定义了对治疗措施和患者的访问权限的访问。但是,这些传统的课程描述符基于疾病的临床表现,而不是基于潜在的疾病生物学。它们对预后的价值仅限于观察到,患有进行性疾病病程(PPMS或SPMS)的患者的预后往往比复发疾病病程的患者更差。5,疾病进行性谱系中对治疗的反应取决于放射学疾病活动的存在,而不是MS的亚型6。现实世界研究和临床试验的最新证据表明,疾病进展与复发活性无关(PIRA)在RRMS中很常见7,,,,8,,,,9,,,,10并且与长期预后不良有关11。此外,当前的MS课程描述符是绝对的和相互排斥的(对患者使用批准的药物有影响),而实际上,复发和进行性疾病特征通常重叠10。复发和进行性MS之间的病理生理差异比定性本质上比定性更具定量性,许多特征与疾病恶化有关,例如缓慢扩展的病变,脑膜和分裂的炎症,神经X。12,,,,13,,,,14,,,,15。这就提出了一个重要的问题,即当前的MS分类是否合理地为不同的亚型,还是将MS从局部炎症到进行性疾病过程中更好地描述为疾病连续性。
在过去的三十年中,在开发有效疗法方面取得了进步,这显着改善了与MS的人们的前景10,,,,16。当前的疗法主要是对MS的复发阶段的许可,其进行性MS(SPM和PPM)的益处主要仅限于最近疾病活动的患者。基于在MS的进行性亚型中观察到的异质治疗效果和利益风险考虑因素,美国和欧洲的监管机构在最近的批准中创造了复杂的子类别以量身定制适应症(例如,Active SPMS和PPMS早期),从而偏离了原始的共识定义(扩展的数据图)。1)。这种对MS在药物开发过程中构成挑战的看法不一致,尤其是在该疾病的进行性范围内,那里仍然存在很高的医疗需求。司法管辖区和与共识定义偏差之间的定义差异也有可能在患者获得批准治疗方面在临床实践中造成混乱17。为了解决这些基本问题,至关重要的是使用数据驱动和基于证据的方法重新评估当前的MS分类15,,,,18,,,,19。
为了实现MS数据驱动的重新分类,我们采用了一种基于AI的方法,更具体地说是一种定制的概率机器学习方法,以重新分类来自Novartis-Oxford MS(No.MS)数据库的8,000多名患者的疾病轨迹,该数据库目前是目前最大,最全面的MS临床试验数据库数据库20。我们的方法学是一种可扩展的概率因子分析,隐藏了马尔可夫模型(FAHMM)对传统MS亚型的不可知论使用概率潜在因子分析(PFA)代表多模式临床和放射学试验数据。这种方法通过捕获变量之间的相关性来简化复杂数据,然后假定这些变量遵循隐藏的马尔可夫模型(HMM)。通过应用此模型,我们报告了这些状态之间的均质多元疾病状态和过渡概率矩阵,从而提供了对过渡途径的定量见解,并对MS随时间的演变产生了数据驱动的观点。从我们的发现和现有文献中借鉴,我们提出了MS的重新分类,该重新分类提供了一个机会,可以使对这种疾病的理解具有对药物开发的影响以及对MS居住人员的实际管理。
结果
发现和验证
在No.MS数据库中的9阶段2/3 ms临床试验中,总共有8,023例随访15年的患者(118,235次访问)。试用期间的诊断为RRM(RRMS)(n= 5,761),spms(n= 1,550)或PPM(n= 712)。基线特征在很大程度上重叠了研究,有更多的残疾患者正在进行性MS试验中(补充图。1.1)。数据集分为发现(n= 6,419)和复制(n= 1,604)样品。在独立的Roche临床试验数据集中对结果进行了外部复制21,,,,22((n= 2,243;请参阅扩展数据表1对于来源研究)和现实世界的同类,多发性硬化伴侣推进了技术和健康解决方案(MS路径)23((n= 2,080),基于预定义的验证标准(方法)。人口统计和MS特征分布在扩展数据表中的数据集中进行了比较2和补充图。1.2。四个潜在维度来表征MS使用潜在变量建模的FAHMM模型与图2中的验证结果一起显示。
1
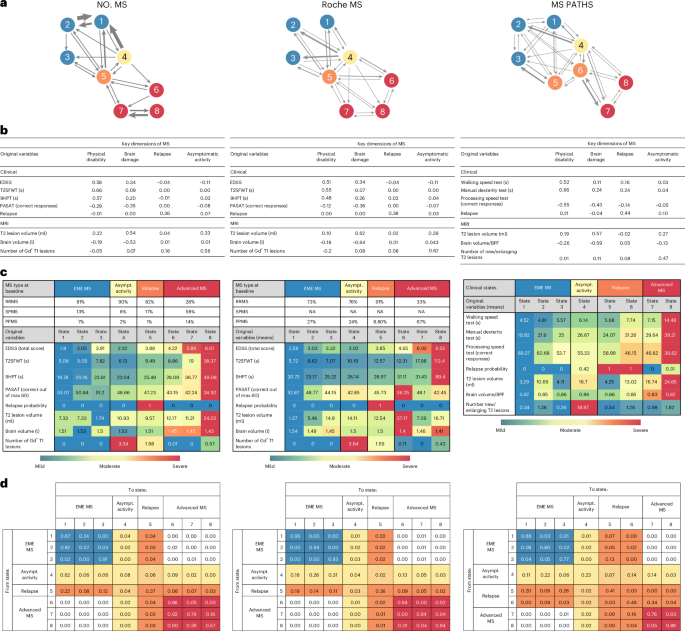
并在图中说明。1a。在临床试验中测得的所有临床和放射学特征的概率潜在变量建模鉴定了MS的四个潜在维度(表1):身体残疾,脑损伤,复发和无症状放射学活动。这些是基于加载矩阵中的临床和放射学特征命名的(图。1B)。图1:MS的疾病演变是基于FAHMM模型NONEM(主要结果),独立验证数据集(Roche MS)和现实世界同类(MS Paths)提出的MS的过渡概率的演变。

,MS的八个统计状态及其之间的过渡概率的图形摘要。b,估计的加载矩阵以识别MS的关键维度。粗体数字是指基于属于平板成分的后验概率显着(正面或负面)的度量。根据GD的存在,鉴定出无症状的MS疾病活性+T1病变,在没有复发的情况下。c,具有MS亚型诊断(RRMS,SPMS或PPMS)的患者百分比的描述性摘要以及表征八个状态的原始变量的经验方式;有关更完整的摘要统计信息,请参见补充表2.1并扩展数据图。3。请注意,对于MS路径,该诊断是由患者自我报告的,并且大多数(53%)缺失,因此在这里未报告。有关No.MS,Roche MS和MS Paths数据集中患者基线特征的更详细比较,请参见补充图。1.2和扩展数据表2。d,通过FAHMM估计的疾病状态之间的过渡矩阵,每个细胞都表明患者在1个月的时间内从当前状态(行)过渡到后续状态(列)。患者可以在疾病状态之间以任何顺序过渡。箭头的厚度一个与状态之间的过渡概率成正比,如过渡概率矩阵中所述d。在所有数字中,颜色代码是指临床元国家:蓝色表示EME MS;黄色表示无症状的MS疾病活性;橙色表示复发;红色表示高级MS。BPF,脑实质分数;GD+,增强Gadolinum;s,秒。
MS疾病状态和随着时间的推移进化
四个潜在维度(来自概率模型)的纵向复合评分用于识别疾病状态(图。1C)。使用贝叶斯信息标准选择了状态数(BIC;扩展数据图。2),它偏爱具有更多状态的模型,而不是更简单的替代方案,尤其是传统的MS子类型(RRMS,SPM和PPMS),这将类似于一个三州模型,其单程单向从RRMS到SPMS和PPMS作为一个独特的静态实体。更复杂的模型揭示了状态之间的重叠特征分布,实际上,在残疾和脑损伤方面代表了疾病的严重程度梯度,并且仅在复发和患者具有高无症状放射学疾病活性的时期(扩展数据图)。3)。具有八个或以上状态的模型类似地具有低比例,并且充分代表了数据。我们在图2中的主要文本中介绍了八态模型及其外部验证。1(在补充表中具有特征分布2.1),九个国家和10态变体在扩展数据中详细介绍。4和扩展数据表3和4。疾病状态在保留数据中成功地复制了(补充图。3.1)。
FAHMM模型提供了数据驱动的,概率的评估,以评估随着时间的流逝,疾病状态之间MS过渡的个体如何。FAHMM模型的这种动态方面被捕获在过渡概率矩阵中(图。1a,d),这允许患者从一次访问到下一个州的州之间或在各州之间移动或移动。患者可以按任何顺序过渡疾病状态之间。在将模型拟合到数据之前,我们没有限制过渡,从而允许以数据驱动的方式发现过渡模式(请参阅方法有关详细信息)。
一个关键的发现是,没有从州1到3个州6 8的直接每月过渡;患者必须首先通过一个活跃状态(4或5)(图。1a,d)。此外,在州6 8中,患者不会返回早期的州(1â3)。因此,仅基于在NO-MS数据集中观察到的那些过渡模式,可以将八个州分为四个临床(meta-)状态,我们以共同作者的共识和患者在这些州的疾病特征的共识命名为emeâ(eme)(eme eme)(州1 3),状态MS的状态和状态(5)(5),5个状态(5),5个状态(5),(5)(5)(5)(5)(5)(5)(5)(5)(5)(5)(5)(5)(5)(5)(5)(5)(5)6â8)。桌子1提供了MS的每个临床(元)状态中患者的临床表征以及过渡概率。摘要如下:
-
EME MS(States1â3)代表临床稳定的,残疾低,认知障碍最小和脑损伤的MS的卧床患者。EME MS的患者最有可能从一次访问到另一个访问后保持EME状态。通过发展无症状放射学活性(状态4)或经历复发(状态5),可以向活性状态过渡。直接过渡到MS的高级状态(6â8)而无需进入活动状态(接近零概率)。
-
无症状的放射学MS疾病活性(状态4):一种放射学活跃但临床上沉默的状态,在没有据报道新的或恶化的神经系统症状的情况下,具有多个Gadolinium(GD)增强病变。如我们的临床试验数据集所示,该州的大多数患者都年轻,但患有SPMS或PPM的患者也达到了无症状的放射学活性状态,在该数据集中揭示了磁共振成像(MRI)扫描在设定的时间内收集,无论症状如何。患者经常从EME状态(1 -3)或复发后进入(状态5)。他们可能会保留在这种状态下,返回EME状态(1â3)或通过发展急性神经系统发展症状(状态5)或过渡到高级MS(State6â8)而复发。值得注意的是,通过无症状疾病活动直接到达MS的高级状态(6â8),存在可测量的风险(约11%),表明亚临床疾病活动是疾病进化的危险因素。
-
复发(状态5):以急性新或恶化的神经系统症状发生特征。尽管复发在疾病的早期更为普遍,但它们也发生在老年和残疾人较高的患者中。在患有RRMS的诊断患者中,最常见的是它们,但诊断为SPMS或PPM的患者也经历了它们。复发是进一步疾病进化的危险因素,因为以18%的概率是从复发状态到高级MS状态之一(即状态5到州6 8)的直接过渡。
-
高级MS(状态6 -8)是由较高水平的身体和认知障碍,更大的脑萎缩和局灶性炎症减少来定义的。一旦处于高级状态,患者就不太可能返回早期州。尽管仍然可以发生复发和病变,但从高级元状态中的过渡很少见。大多数患者仍留在这些状态下。该模型在这些晚期阶段中没有区分SPM和PPM,即SPM和PPM的患者在状态下以相似的频率分布。
表中为四个临床(meta-)状态提供了来自No.M的人口统计学和MS疾病特征2。
基于预定义的验证(方法)标准如下:
Roche Ocreelizumab 3期计划(Roche MS)临床试验数据集的验证(Roche MS)(n= 2,243)证实了四个MS维度的身体残疾,脑损伤,复发和无症状疾病活性,并表明,尽管没有SPMS患者,但从EME到晚期MS的进展主要是通过活跃状态发生的。临床解释与主要发现并满足验证标准相一致(图。1)。
现实世界中MS路径队列中的验证(n= 2,280)。Despite using different measures (for example, new/enlarging T2 lesions, brain parenchymal fraction and no Expanded Disability Status Scale (EDSS)), lower-frequency assessments (6–12 monthly visits) and some patient-reported rather than physician-assessed measurements, the four MS dimensions and the EME-to-advanced disease gradient were also reproduced in the MS PATHS cohort.向高级MS的过渡通常通过活跃状态,并且从早期到高级MS的直接恶化被证实很少见。出现了较小的差异:仅确定了两个晚期状态(与第3个状态相比,第三个状态),并将复发分为两个复发状态(一个在早期患者中,一个在更高级的患者中)。这是由于以下事实:在MS路径中反映了现实世界实践,访问更多是症状驱动的,而不是独立的,就像临床试验中通常情况一样(图。1)。灵敏度分析对BOUT-ENSET MSâ(RRMS和SPMS)和PPMS的分析分别揭示了相似的疾病状态和过渡模式(扩展数据。
5
)。每次访问时FAHMM都需要完整的数据。在主要分析中,仅针对部分观察到的访问,预定的临床就诊和计划外的复发就诊估算了丢失的数据。
固定数据上估算值的数据速率和平均绝对错误如下:定时步行测试(T25FWT):32.3%,0.14;9孔PEG测试(9HPT):43.6%,0.17;节奏的听觉串行添加测试(PASAT):53.9%,0.30;T2病变体积:72.5%,0.08;大脑体积:69.9%,0.08;和GD增强病变:73.1%,0.08。这些指标表明,变量跨变量具有合理水平的准确度。
EDSS和复发数据已完成。在没有数据插图的情况下,进一步的灵敏度分析的结果,根据年度脑扫描的可用性将可用的评估映射到年度访问中,并在扩展数据中给出。6。它显示了通过复发或无症状放射学疾病活性过渡到晚期MS疾病严重程度梯度的EME ME,尽管纵向信息大大丧失,但与主要模型一致(所有患者访问的88.5%和87.1%的复发都因年度访问而遗漏了87.1%的复发)。
与疾病状态的复发活性无关的进展
疾病状态下,患者处于临床试验的基准状态,对第一个PIRA事件进行了分析(图。2a)。从EME或活性状态开始的患者(复发或无症状活性)的风险较低,PIRA的时间比从高级状态开始的患者更长,而PIRA的时间则更长,这表明尽管进展风险早早存在,但在晚期MS中的增加显着增加。

,是第一个3个月PIRA作为临床状态的函数的时间,在该状态下,患者在试验基线时开始。卡普兰·梅尔(Kaplan Meier)估计,阴影区域为95%的置信区间。b,在5年的时间范围内,MS四个临床状态之间的单个患者轨迹的桑基图。在第0年,患者以临床试验的疾病状态显示:患者处于EME状态(蓝色),处于无症状放射学疾病活性(黄色),复发(橙色)或MS的晚期状态(红色)。从左到右,该地块说明了保持在同一疾病状态或转移到另一种疾病状态的患者的比例。请注意,为了清楚图形,仅显示患者的年度状态,并且未显示每年访问之间的过渡以避免人满为患。如果患者在这些年度就诊时患有复发或放射学炎症,则分别以橙色和黄色的形式出现。但是,患者可能在这些年度造成恶化的年度之间经历了复发或无症状的放射学炎症状态,这在此图形表示中无法出现。这解释了为什么该图在图中在图中显示EME和晚期疾病状态之间的蓝色连接线,即使EME和晚期状态之间直接过渡的概率而不经过炎症状态的概率实际上是低的(请参阅图2中的基础过渡矩阵。1d)。c(任何)DMT(与安慰剂)对MS四个临床状态之间的过渡概率的影响。``任何DMT都包括以下一项:干扰素β-1,乙酸盐,Teriflunomide,fingolimod,siponimod或fatumumab,它们与无DMT(即安慰剂)进行了比较。数字是指降低风险百分比(1 HR,HR是指治疗和未治疗(安慰剂)患者之间的危险比,并报告了95%的置信度限制)。
单个轨迹的预后
在5年以上的临床疾病状态中,个人患者的旅程在Sankey的地块中被可视化(图。2b)。在临床试验的基线下,大多数患者处于EME MS状态(蓝色)或活性疾病状态(黄色或橙色);只有少数患者已经处于晚期MS疾病状态(红色),反映了No.MS数据库的组成和各种试验的资格标准。患者每年在状态之间过渡,观察到恶化和改善。每次访问炎症状态(复发或无症状活性)都会增加发展为高级MS的风险。随着时间的流逝,越来越多的患者会累积疾病负担并进入晚期州。在RRMS,SPM和PPM中观察到类似的模式(补充图。4.1),无论MS亚型如何,都通过炎症活动从早期到晚期的过渡途径一致。
我们根据估计的FAHMM模型评估了拟议分类的预测性分类的预测性能以及改良疾病疗法(DMTS)的影响(DMTS)(DMTS)(DMT)(DMT)(DMT)(方法)。分析表明,总体而言,该模型可以预测独立保留数据中具有很高一致性的个体患者轨迹,并具有良好的样本外部性能(C分数= 0.82,Brier Score = 0.06)。
DMT对MS疾病进化的影响
使用DMT治疗可显着降低EME MS过渡到高度活跃的无症状MS疾病状态的风险,以及他们过渡到复发状态的风险(图。2C)。与安慰剂相比,DMT还降低了在访问中保持活跃状态的机会。通过通过这些高风险状态中断对中枢神经系统的损害的积累,DMT与在MS的EME期停留更长的患者的可能性更高。
讨论
我们通过将定制概率的机器学习方法应用于8,000多名患者的纵向多模式疾病轨迹,开发了MS的数据驱动分类,涵盖了MS的所有经典亚型。No.MS的主要分析基于大约120,000个标准化的神经系统评估和超过35,000次MRI扫描。
如前所述,我们的研究是在具有协议定义的资格标准的临床试验数据集中进行的20,与临床实践中通常遇到的通常遇到的人口更狭窄。我们通过验证和复制我们的发现不仅在保留数据集上,还可以在独立的临床试验数据集(Roche MS数据集)中验证和复制我们的发现来解决这一可能的限制。21,,,,22在现实世界中(MS路径)中23。我们的分析中包含的人群与No.M的完整数据集和基于报告的人口统计学和疾病特征(扩展数据表)大致相似。2和补充图。1.2)。通过包括MS路径和Roche MS,我们显着扩大了所使用的处理范围。
该模型与MS的诊断临床亚型不可知,使我们能够将其与基于共识的MS课程描述符对比(表3)。通过将我们的发现与传统的MS分类和现有文献相关联,我们提出对分类的修订,并建议采取行动,从而对患者的管理和临床试验产生积极影响。
我们的FAHMM模型结果与MS视为疾病连续体更具兼容性10,,,,13,,,,15而不是传统的不同表型的观点。发现静态MS亚型(RMS,SPM和PPM)的三态模型不如更复杂和动态模型。在这些动态模型中,疾病活动的频率在个体之间有所不同,从而解释了中枢神经系统损害积累的某些个体差异以及随着时间的推移的身体和认知障碍的获得。基于四个维度的身体残疾,放射学疾病负担(即局灶性和弥漫性脑损伤),复发和亚临床疾病活性以及疾病状态之间的过渡矩阵,FAHMM具有良好的表现,可在个体水平上预测疾病课程(C评分> 0.8)。因此,该模型可以根据访问的频率进入一种活性疾病状态和疾病负担的积累来预测时间。这种方法的结果支持卢布林的提案24那就是框架的时间,即在设定的时间窗口内(例如,在一年之内)中疾病活动的频率和进展,应在MS的实际管理中考虑。
我们的疾病连续体是通过我们的建模以多种重叠状态的形式来确定的,这些状态代表梯度在疾病的严重程度方面,这是由残疾和对大脑损害的水平定义的。因此,放射疾病负担的积累是疾病恶化的表现,可以通过有效的DMT减少(甚至可以预防)。我们将元状态EME MS(状态1 3)与高级MS(状态6-8)确定为疾病严重程度梯度的两个极点。具有八个以上状态的模型显示出对同一梯度的分辨率更大,没有临床解释的额外值。与PPM相对于PPMS的BOUT-ENSET-MS-MS-MS(RRMS和SPMS)的单独模型基本相似。
FAHMM的结果表明,MS的局灶性炎症和渐进形式在其表型表现中形成了连续性。模型将RRMS,Active SPMS和早期PPMS分组在MS的EME阶段,而没有区别,而完全进化的PPM则在高级阶段与SPMS分组,也没有区别。从EME MS到高级MS的主要过渡途径是通过局灶性炎症态,伴随着神经系统症状或通过临床沉默的放射学疾病活动而隐身。The FAHMM considers the highly active disease states (4 and 5) as distinct disease states set apart from all other states by the occurrence of acute neurological symptoms or the unequivocal evidence of high levels of inflammation on the MRI scan (Gd-enhancing T1 lesions mean (s.d.): 3.34 (5.22)), respectively.This differs from the traditional view of MS that attributes lesions and relapses primarily to RRMS and is justified based on abundant evidence that lesions and relapses are not exclusive to any specific subtype of MS but can occur across the entire MS spectrum, including in patients with PPMS10,,,,20。
The finding that ‘early PPMS’—that is, relatively young patients with low to moderate levels of disability and/or evidence of radiological disease activity—can benefit from anti-inflammatory treatment is consistent with subgroup results of the first trials of B-cell-depleting antibodies in PPMS25,,,,26。More recently, a meta-analysis of 12 studies in the progressive spectrum of the disease (SPMS or PPMS) in a total of 8,659 patients showed that patients with recent disease activity could benefit from available DMTs, irrespective of whether their disease course was diagnosed as SPMS or PPMS, whereas patients without such recent disease activity could not6。The 2013 revisions by Lublin et al.4
to the definition of the MS disease course introduced disease activity measures (MRI lesions and relapses) and progression as ‘modifiers’ of the classical static phenotypes (RRMS, SPMS and PPMS), without substantiating the quantitative relevance of such modifiers for disease evolution.Our FAHMM results enhance understanding of MS by offering a data-driven examination of the latent dimensions for disease characterization and a probabilistic quantification of the transition pathways between disease states.In our analysis, focal inflammation, with or without accompanying neurological symptoms, is the key driver of worsening.This finding was validated in the independent clinical trial dataset as well as in the real-world cohort.Our FAHMM shows that clinical and radiological assessments provide complementary information that differs from the initial consensus-based classification of MS, which focused on only two clinical dimensions (relapses and disability progression)3。It also differs from a more recent data-driven classification of MS that used only MRI data based on the premise that this would better reflect the pathophysiology of MS27。FAHMM results suggest that, in addition to the level of disability and relapse, two MRI-based latent dimensions of MS are relevant and should be considered for disease characterization and disease evolution:
-
(1)
Brain damage: assessed by the total T2 lesion volume and the level of brain atrophy as cumulative measures of focal and diffuse radiological disease burden.As the disease evolves, disease-related damage to the brain gradually accumulates, progressively lowering the patient’s chances for disability improvement28and increasing the risk of further disability worsening29and progression30,,,,31。This decreasing ability to compensate and improve as the disease advances will similarly contribute to the clinical presentation of a progressive disease course, much like active drivers of worsening would, albeit likely through a different pathophysiological mechanism28。Thus, the accumulation of a radiological disease burden is a form of disease worsening, associated with poorer long-term outcomes;it should be minimized through the use of efficacious DMTs.
-
(2)
Asymptomatic radiological disease activity was revealed as a major pathway for patients to worsen, as shown by the FAHMM transition matrix.Our results from the much larger NO.MS dataset confirm the finding of a previous report by Thorpe et al.32, showing that more than 90% of the MS disease activity visible on regularly scheduled MRI scans (brain and spinal cord) is not accompanied by new or worsening neurological symptoms.High lesion activity is predominantly, but not exclusively, seen in young patients and occurs in all subtypes of MS20and contributes to neuronal injury33,,,,34,,,,35and brain tissue loss36and, thereby, to the overall accumulation of damage to the brain.Enhancing lesions contribute to disease worsening in the same direction as clinical relapses28。Such damage is, in turn, associated with a lower chance of improvement and an increased risk of disease worsening and progression28(see the FAHMM-proposed brain damage-related latent dimension of MS).Therefore, monitoring and preventing subclinical disease activity to protect reserve capacities should be a priority in MS management, considering that brain reserve influences how structural damage translates into clinical symptoms37。However, this approach may require novel strategies considering the current era of low relapse rates and safety concerns associated with regular use of Gd38。
Our FAHMM model confirms that PIRA starts early in MS and becomes the dominant feature in the advanced disease states when brain reserve is depleted, in line with the findings of Kappos et al.9and Lublin et al.10。Patients in all states of MS can experience PIRA events, but the absolute risk of PIRA is higher in the advanced states compared to the EME states of the disease.In relative terms, PIRA is the most frequent manifestation of disability accumulation across the full spectrum of traditional MS phenotypes, as summarized in a recent literature review39。Perhaps surprisingly, FAHMM did not identify any direct pathway from EME to advanced states of the disease without passing through focal inflammatory states (4–5).Among the various biological mechanisms for MS evolution that have been proposed40, this finding supports the view that inflammation is central to the pathogenesis of MS and that degenerative processes in MS are secondary in nature.The risk of PIRA was estimated to be highest in the advanced states of MS, when the amount of damage to the CNS is typically substantial and response to currently available treatments is least likely.
Regarding the advanced states of MS, our results do not support maintaining a distinction between SPMS and PPMS;patients with SPMS and patients with PPMS were similarly distributed among the advanced states of the disease, both in the NO.MS dataset and in the real-world validation set.Once patients reach the advanced states of the disease, the risk of progression is high, and the chances of a treatment response are low, regardless of whether the previous disease course was characterized by relapses or not.Our results align well with the accumulating evidence that the apparent evolution from EME states to advanced states of the disease reflects a partial shift from predominantly localized acute injury to widespread chronic inflammation and secondary neurodegeneration13,,,,14,,,,41,,,,42,,,,43,,,,44,,,,45,,,,46。Aging has a modulating effect;it decreases the likelihood of focal inflammation, increases neural susceptibility to injury and reduces resilience15,,,,20。Abandoning the distinction between primary and secondary progressive MS in the advanced spectrum would acknowledge that these patients likely progress for the same reasons.Treating advanced PPMS and advanced SPMS as a uniform population would facilitate trial recruitment and drug discovery and would simplify drug indications and access in the progressive spectrum of the disease (that is, advanced MS is seen as one indication).
One may consider how the classical disease course descriptors (at presentation) would map to the FAHMM states and how this relates to current and potentially future disease classification.Radiologically isolated syndrome (RIS), which, in specific situations, is now MS47, would be detected based on asymptomatic lesions (state 4).Clinically isolated syndrome (CIS) would be identified based on a first clinical episode (state 5).Fully ambulatory patients with MS with limited damage to the brain who are not in a relapse and not in a highly inflammatory state would be considered in one of the EME disease states (1–3), irrespective of whether they have a relapsing or a progressive disease onset.Patients who have progressed in their disease, are impaired in their walking ability, have cognitive deficits and/or have accumulated a substantial lesion load or brain atrophy would likely qualify as being in an advanced disease state (6–8).It should be noted that, under the FAHMM, the combinations of physical and cognitive impairment and radiological damage to the brain that determine the classification of patients to a particular disease state can vary, reflecting inter-individual differences.Such differences render it impossible to provide simple thresholds that would demark movement between states and be applicable to all patients with MS.For the practical management of patients with MS and for the conduct of clinical trials, we propose it to be adequate and sufficient to consider the two ends of the disease continuum (EME MS versus advanced MS) while acknowledging that the shift in pathobiology is gradual rather than sudden, with considerable overlap of focal inflammatory and degenerative biology.
EME MS would include RIS, CIS and RRMS as well as ambulatory and cognitively functional patients with SPMS or PPMS who had recent imaging features characteristic of inflammatory activity.The primary goal would be to prevent relapses and asymptomatic disease activity by addressing the evolving disease pathology15。Meta-analyses suggest that such patients can benefit from currently available anti-inflammatory drugs6,,,,16,,,,48。
Advanced MS would include SPMS and PPMS (without distinction) and patients with RRMS who progressed in absence of relapse activity (PIRA) and who have moderate to high levels of disability with evidence of brain damage as shown by T2 lesion burden or evidence of disease-related brain atrophy.The primary goal would be to minimize the risk of further progression and to maintain or restore function.Secondary goals could be to minimize the risk of lesion expansion and brain atrophy.Developing treatments for advanced MS remains an urgent unmet medical need.
We summarized our recommendations for clinical practice and for clinical trials based on our findings and the literature in Table4。
We acknowledge the limitations in our dataset in terms of imaging frequency (typically only available in annual visits) and lack of advanced MRI features, including spinal cord imaging, cortical lesions and slowly expanding and paramagnetic rim lesions, which might account for some discordance between MRI disease activity and clinical outcomes.The overall limited data from spinal cord MRI in our database do not allow for definite or generalizable conclusions regarding its added value as a disease descriptor.Although there is evidence to show that spinal cord volume loss is significantly associated with present and future disability49,,,,50,,,,51,,,,52,,,,53,,,,54, its potential added value over brain atrophy has not been studied or demonstrated.Regarding spinal cord lesions, based on a recent review55systematic assessment of such lesions for monitoring of disease activity seems to have limited added value over monitoring of brain lesions and is considered optional based on current guidelines38。
To conclude, our model is a potentially important stepping stone to a data-driven disease characterization of MS.Although more comprehensive clinical information, such as spinal cord abnormalities or biological data, will be required before it can be considered definite, we think that if more advanced MRI measures and fluid biomarker data, such as proteomic or metabolomic data from banked samples, could be made available in this or any other large MS database, the FAHMM model would be suitable for a more in-depth pathophysiological description of MS and, provided availability of respective data, of any other diseases with similar complexities.With this comprehensive analysis, we hope to contribute to a more unified understanding of MS.
方法
Analysis set from the NO.MS database
The NO.MS database was previously described20。In brief, it comprises 39 clinical trials from 2003 to April 2021, approved by institutional review boards (IRBs) or ethics committees (‘Ethics’ subsection and Supplementary Table5.2) and conducted following the principles of the Declaration of Helsinki and Good Clinical Practice.All patients from all 39 trials provided written informed consent.Trial protocols prospectively defined the objectives, eligibility, endpoints, assessments and statistical analyses.The individual study results were previously published.Data were deidentified in a risk-based approach as reported elsewhere56,,,,57。For this analysis, all phase 2 and 3 studies conducted in RRMS, SPMS or PPMS and their corresponding open-label extensions were selected based on the availability of protocol-defined standardized clinical assessments and regular MRI acquisitions.Studies contributing to the analysis are listed in Extended Data Table1。In addition, an analysis of the wider NO.MS database, including all patients with clinical assessments of relapses and EDSS, investigated the risk of relapses and progression from pediatric MS to adult MS and from RRMS to SPMS and PPMS and identified a decreasing gradient of focal inflammation and an increasing gradient of the risk of progression10。
伦理
The ethics committees and IRBs used in the nine NO.MS source studies included: Alta Bates Summit IRB;Asahikawa Medical Center IRB;Ascension Wisconsin IRB;Aurora IRB;Baltimore IRB;Biomedical IRB;CentraState IRB;Central Ethics Committee;Chiba University Hospital IRB;Christiana Care IRB Helen F.;Copernicus Group IRB;Crescent City IRB;Dean IRB;Ebara Hospital IRB;Ehime University Hospital IRB;Georgetown University IRB;Health Sciences Institutional Review Boards;Health Sciences Campus IRB;Health System IRB;Healthcare -IRB;Henry Ford Hospital IRB;Hospital IRB;IRB University of California Davis;IRB of Beijing Hospital;IRB of West China Hospital;IRB-WB2;IRB/OSA;IRBMED;Institutional Ethics Committee, Bakirkoy;Institutional Ethics Committee, Dokuz Eylul;Institutional Ethics Committee, Ege;Institutional Ethics Committee, Gazi;Institutional Ethics Committee, Gaziantep;Institutional Ethics Committee, Hacettepe;Institutional Ethics Committee, Istanbul;Institutional Ethics Committee, Mersin;Institutional Ethics Committee, Uludag;Iwate Medical University Hospital IRB N/A;Johns Hopkins IRB;Keio University Hospital IRB;Kyoto Min-iren Chuo Hospital IRB;Lifespan IRB;Local Ethics Committee of AHEPA;Multicentric Ethics Committee IKEM;NIMS Institutional Ethics Committee;National Ethics Committee;Network IRB;Osaka University Hospital IRB;Pro Health Care IRB Research;Providence Health & Service IRB;Providence Health & Services IRB;Psychiatry IRB;Quorum Review IRB;Research Ethics Committee;Saitama Medical Center IRB;Schulman Associates, IRB;Sone Clinic IRB;The Ethics Committee of Sri;University IRB;University of Colorado Health IRB;University of Utah IRB;WIRB;WakeMed IRB;Wayne State University IRB;and Wheaton Franciscan Healthcare IRB N/A (see Supplementary Table5.2for full list and further details).
Clinical assessments in NO.MS
For all the trials included in the NO.MS analysis set, the following clinical assessments, which are commonly used in MS clinical trials, have been regularly monitored (typically every 3 months or 6 months; for details, see the individual protocols and study designs) by specifically trained healthcare professionals:
-
EDSS58,,,,59: a standard tool for assessing the neurological disability status and disability progression, ranging from 0 (neurologically normal) to 10 (death due to MS).
-
T25FWT60: an objective quantitative measure of neurological function (patient’s walking speed).
-
9HPT60: an objective quantitative measure of upper extremity (arm and hand) function.
-
PASAT61: an objective measure of cognitive function that specifically assesses auditory information processing speed and flexibility as well as calculation ability.
-
Relapse occurrence: defined as the appearance of a new neurological abnormality or worsening62, as experienced by the patients and reported by the study investigator.Patients who experienced new or worsening symptoms were instructed to come for an unscheduled visit where symptoms were assessed (with an EDSS assessment performed), and onset as well as end date were recorded by the physician.Patients were transferred to an EDSS rater (in phase 3 trials) and an independent physician for the EDSS assessment.In the present analysis, all patient-experienced and physician-reported new or worsening symptoms are considered, irrespective of the EDSS confirmation.
It should be noted that such visits could happen at any time and would typically occur in unscheduled visits between the regular scheduled visits.For this reason, to capture the timing of events adequately, a monthly grid was used for modeling purposes.
Radiological assessments in NO.MS
In NO.MS, all images obtained according to study-specific standardized protocols were reanalyzed centrally by the Big Data Institute in Oxford, United Kingdom, using a harmonized MRI pipeline on standard MRI outcomes in MS (normalized brain volume using SIENAX63, part of FSL 6.0;percentage brain volume change using SIENA64, part of FSL 6.0).Gd-enhancing lesions and T2 lesion volume were used as reported in the original trials.
Variables in NO.MS
The clinical and radiological variables used in our modeling are presented in Table2, and their assessment is described in the previous two方法subsections.Demographic and disease-related features are updated longitudinally.For each visit, the patient’s age is updated, and the normalized brain volume is calculated based on the normalized brain volume measured at baseline (using SIENAX63) and the percentage change from baseline measured at post-baseline visits (using SIENA64)。Lesion assessments were done centrally as previously reported for each of the original trials.
Demographic features and the diagnosed phenotype of MS (RRMS, SPMS or PPMS) were not used in the modeling but are reported across visits for the disease states newly identified by the model to characterize the patients in a specific state and to help establish the link between the newly proposed FAHMM states and the traditional classification of MS.PIRA was derived as a 3-month EDSS-confirmed irreversible worsening of disability in the absence of relapses10。
FAHMM
The proposed hierarchical model uses a PFA65model to find a parsimonious representation of data.It exploits the shared information among elements of observed data to find MS dimensions (loading matrix) and corresponding composite scores (latent variables) that are continuous and a posteriori following a normal distribution.The spike and slab prior with Laplace components on the loading matrix favors sparsity that helps with the interpretation of MS dimensions.The number of MS dimensions is determined in a data-driven manner by putting an Indian buffet process prior on the inclusion/exclusion binary variables of spike and slab prior.Moreover, it helps with assigning observed variables to the MS dimensions by using a posterior probability of inclusion to the slab component greater than 0.5.
Next, our model assumes that the composite scores follow an HMM with multivariate normal emission distribution66。For modeling purposes, only the time gap between two consecutive visits is assumed to be 1 month (except for MS PATHS where it is assumed to be 6 months; see Supplementary Information Section5for more details).The HMM models MS evolution over time by (1) finding homogeneous disease states (latent unobserved) where the distribution of longitudinal composite scores is similar in terms of mean and covariance and (2) characterizing the progression between states by a transition probability matrix where all transitions are a priori possible (we are not restricting the transition probability matrix or assuming any structure).The number of states is determined by using the BIC.
Our proposed probabilistic multivariate model for disease evolution using longitudinal data is capable of handling mixed data modalities (binary, count and continuous) and missing data.The allocation of the observed variables to the MS dimensions does not change over time, which translates into a fixed loading matrix across visits.However, the composite scores are changing over time.The PFA uses baseline data where there are no missing data to estimate the loading matrix, and then the rest of the model parameters are estimated conditionally on the estimated loading matrix.
The model parameters are estimated using an expectation–maximization algorithm67。To evaluate the proposed classification’s predictive performance for the prognostication of an individual patient’s risk to transition into an advanced state of MS, the effect of DMTs and the characterization of individual states, the estimated FAHMM model is used to assign each visit to the corresponding disease and clinical states using the Viterbi algorithm67。The states are characterized by calculating the mean and s.d.of the corresponding variables.The disease states and transition probabilities are illustrated in Supplementary Fig.5.1。A discrete time-to-event analysis using Bayesian Additive Regression Trees (BART)
68was used to evaluate the prognostication performance of the clinical (meta-)states (Results).Time to first transition to one of the advanced states for patients who are in the early, relapse or asymptomatic states at baseline was predicted using baseline radiological and clinical features and demographic characteristics, including age, sex, treatment, relapses and number of relapses before entering the trial.
A continuous-time Markov model was used to assess the association between the use versus non-use of a DMT on the transition probabilities between clinical (meta-)states (msm package69)。
Replication in holdout data from NO.MS
The analysis was based on a total dataset of 8,023 patients that was randomly divided into a discovery set (6,419 patients) for analysis purposes and a holdout set (1,604 patients) for validation purposes.这k-means clustering method was used to identify a homogeneous group of patients using the average of longitudinal composite scores per patient.The clustering method found five different groups using the elbow approach, where 80% of patients in each group are randomly assigned to the discovery set and the remaining 20% to the validation set.
More methodological details can be found in Supplementary Information Section5。
灵敏度分析
A sensitivity analysis was conducted to check whether the disease states and transition pattern for ‘bout-onset MS’ (RRMS and SPMS) is similar to that of PPMS.A separate model was fit to RRMS/SPMS (excluding patients with PPMS) and to patients with PPMS alone.
Another sensitivity analysis was conducted without data imputation.This approach presents inherent complexities as the model requires complete data for all visits, whereas relapses can occur at any time, and other assessments are often unavailable at these timepoints.To conduct an analysis without data imputation, it was, therefore, necessary to remap all available data to annual visits based on the availability of MRI scans.This approach has the limitation that all data points collected between these annual visits are either ignored or shifted in time.After remapping the data to annual visits, the model was fit to these ‘complete case’ data.
External validation on independent datasets
After submitting the initial version of this paper to自然医学based on the NO.MS data, we sought to ensure the reproducibility and generalizability of our findings through validation using independent external datasets where we established predefined validation criteria prior to accessing these datasets.The model was then fitted to each external dataset, including an independent clinical trial dataset (Roche MS dataset) and a real-world cohort (MS PATHS), confirming the reproducibility of our results following the data preparatory steps described further in this section.
Validation step 1: replication of MS dimensions
The PFA part of FAHMM65uses baseline data to find MS dimensions (loading matrix) and corresponding composite scores (latent variables).The FAHMM model was fitted to all datasets where validation was evaluated by examining whether the same disease dimensions would emerge in the external datasets.Specifically, we determined whether the same or similar sets of variables from the primary analysis were assigned to the corresponding latent variables in the validation datasets.The validation of the latent dimensions of MS would be considered successful (validation criterion 1) if we could re-identify four dimensions related to (1) physical disability, (2) brain damage, (3) relapse and (4) asymptomatic MS disease activity.
Validation step 2: replication of disease evolution modeling
In the main analysis, the MS evolution modeling using FAHMM discovered eight states that were grouped in four meta-states based solely on the patterns of the transition probability matrix using NO.MS data: EME MS, asymptomatic radiological MS disease activity, relapse and advanced MS.To replicate the main findings from the NO.MS dataset, we fit the FAHMM to either the Roche MS or the MS PATHS data with eight states as in the main model.A successful validation would entail finding meta-states with similar clinical interpretation and similar transition probability to NO.MS (validation criterion 2): the validation would be considered successful if we could re-identify an EME MS versus an advanced state of MS with a disease severity gradient and if the transition from the first to the second would primarily be through focal inflammatory disease states—that is, through a relapse or an asymptomatic radiological disease state—with little to no probability for patients to worsen from EME MS to advanced states without passing through these focal inflammatory states.
As described above, the validation focused on the qualitative similarity of the clinical interpretability rather than on numerical thresholds.By applying these predefined validation criteria to unseen data, we aimed to show the generalizability and robustness of our findings across independent datasets, including real-world data.
Variables in external datasets
In the Roche MS dataset, the same clinical and radiological variables as in the NO.MS dataset were available.As in the NO.MS dataset, the clinical measurements were collected by trained neurologists, and MRI assessments (lesions and brain volume change) were measured by a central reading center.All assessments were used as reported in the original trials.
For the real-world dataset from MS PATHS, data assertation was different than in NO.MS and in Roche MS.Specifically, no EDSS assessments were available (patient determined disease steps (PDDS) measurements were collected rather than EDSS, but this was not used in the modeling).For most other variables in NO.MS, corresponding similar measures in MS PATHS could be identified: an iPad version of the 9HPT test was used (labeled as ‘manual dexterity test’);the walking test (noted as ‘walking speed test’) was found to be similar to the T25FWT;and an iPad version of a cognitive text (noted as ‘processing speed test’) similar to the Symbol Digit Modality Test (SDMT) was used.In MS PATHS, brain parenchymal fraction70was calculated instead of normalized brain volume, and the number of new/enlarging T2 lesions was used instead of the number of Gd-enhancing T1 lesions.Other differences between MS PATHS and the clinical trial datasets were a lower frequency of visits (typically every 6–12 months) and the fact that visit occurrence was not independent of the occurrence of clinical symptoms (scanning frequency seemed to depend on the occurrence of relapses).Therefore, whereas, in the NO.MS and the Roche MS datasets, the transition probabilities refer to the probability of changing from one disease state to another one within a period of 1 month, in MS PATHS they refer to the probability of changing from one disease states to another within 6 months.
Data preparatory steps
In each of the respective independent external validation datasets, visits were mapped to a regular grid to capture the timing of regularly scheduled visits as well as of unscheduled visits (for example, due to new or worsening neurological symptoms).For the Roche MS dataset, this was a monthly grid, similar to that of NO.MS, whereas, for MS PATHS, due to the lower visit frequency, this was a six-monthly visit grid (subsequently, probabilities in the transition matrix refer to monthly versus six-monthly transitions, respectively).To account for incomplete records and missing post-baseline data, the observed variable’s trajectory over time was used to impute missing values using generalized additive models.Such data imputation was done only at scheduled or unscheduled patient visits where partial patient data were available (Supplementary Information Section5)。The percentage of imputed values overall and for each variable is reported together with the mean absolute error for the imputation.In the clinical trial dataset, baseline was defined as the last assessment prior to randomization, whereas, in MS PATHS, baseline was defined as the first timepoint that patients had all the necessary measurements required for modeling;furthermore, the availability of serial post-baseline assessments was required for inclusion into the analysis set, which led to the total sample size of 2,080 patients from MS PATHS.
报告摘要
Further information on research design is available in theNature Portfolio Reporting Summarylinked to this article.
数据可用性
For NO.MS, the reader is able to request the raw data (anonymized) and related documents (for example, protocol, reporting and analysis plan and clinical study report) of all the studies that underlie the modeling results reported in this article by connecting to CSDR (https://www.clinicalstudydatarequest.com) and signing a data-sharing agreement with Novartis.The data will be made available to researchers, with requests reviewed and approved by an independent review panel of CSDR.For Roche MS, including phase 3 ocrelizumab trial data used for the clinical trial validation, qualified researchers can request access to patient-level data by making a request viahttps://vivli.org/。The anonymized MS PATHS dataset used for the real-world validation can be obtained for purposes of replicating the findings of this study by contacting H.W.at heinz.wiendl@uniklinik-freiburg.de.
代码可用性
SIENA/X, part of FSL 6.0, available athttps://fsl.fmrib.ox.ac.uk/fsl/, was used to derive normalized brain volume and percentage of brain volume change.The FAHHM code used in this work is available athttps://github.com/habib61/FAHMM。参考
MS International Federation.
Atlas of MS.https://www.atlasofms.org
Walton, C. et al.Rising prevalence of multiple sclerosis worldwide: insights from the Atlas of MS, third edition.多。Scler. 26, 1816–1821 (2020).
Lublin, F. D. & Reingold, S. C. Defining the clinical course of multiple sclerosis: results of an international survey.神经病学 46, 907–911 (1996).
CAS一个 PubMed一个 Google Scholar一个
Lublin, F. D. et al.Defining the clinical course of multiple sclerosis: the 2013 revisions.神经病学 83, 278–286 (2014).
Rotstein, D. & Montalban, X. Reaching an evidence-based prognosis for personalized treatment of multiple sclerosis.纳特。Neurol牧师。 15, 287–300 (2019).
PubMed一个 Google Scholar一个
Capanna, M., Signori, A. & Sormani, M. P. Is the effect of drugs in progressive MS only due to an effect on inflammation?A subgroup meta-analysis of randomised trials.多。Scler. 28, 1744–1751 (2022).
PubMed一个 Google Scholar一个
Cree, B. A. C. et al.无疾病活性复发多发性硬化症的无声进展。安。神经。 85, 653–666 (2019).
Kappos, L. et al.Greater sensitivity to multiple sclerosis disability worsening and progression events using a roving versus a fixed reference value in a prospective cohort study.多。Scler. 24, 963–973 (2018).
PubMed一个 Google Scholar一个
Kappos, L. et al.Contribution of relapse-independent progression vs relapse-associated worsening to overall confirmed disability accumulation in typical relapsing multiple sclerosis in a pooled analysis of 2 randomized clinical trials.贾玛神经。 77, 1132–1140 (2020).
PubMed一个 Google Scholar一个
Lublin, F. D. et al.How patients with multiple sclerosis acquire disability.脑 145, 3147–3161 (2022).
Tur, C. et al.Association of early progression independent of relapse activity with long-term disability after a first demyelinating event in multiple sclerosis.贾玛神经。 80, 151–160 (2023).
PubMed一个 Google Scholar一个
Lassmann, H., van Horssen, J. & Mahad, D. Progressive multiple sclerosis: pathology and pathogenesis.纳特。Neurol牧师。 8, 647–656 (2012).
CAS一个 PubMed一个 Google Scholar一个
Yong, H. Y. F. & Yong, V. W. Mechanism-based criteria to improve therapeutic outcomes in progressive multiple sclerosis.纳特。Neurol牧师。 18, 40–55 (2022).
CAS一个 PubMed一个 Google Scholar一个
Filippi, M. et al.Diagnosis of progressive multiple sclerosis from the imaging perspective: a review.贾玛神经。 78, 351–364 (2021).
Kuhlmann, T. et al.Multiple sclerosis progression: time for a new mechanism-driven framework.柳叶刀神经。 22, 78–88 (2023).
PubMed一个 Google Scholar一个
He, A. et al.Timing of high-efficacy therapy for multiple sclerosis: a retrospective observational cohort study.柳叶刀神经。 19, 307–316 (2020).
CAS一个 PubMed一个 Google Scholar一个
Lublin, F. D., Coetzee, T., Cohen, J. A., Marrie, R. A. & Thompson, A. J. The 2013 clinical course descriptors for multiple sclerosis: a clarification.神经病学 94, 1088–1092 (2020).
Granziera, C., Derfuss, T. & Kappos, L. Time to change the current clinical classification of multiple sclerosis?贾玛神经。 80, 128–130 (2023).
PubMed一个 Google Scholar一个
Thompson, A. J. et al.Do the current MS clinical course descriptors need to change and if so how?A survey of the MS community.多。Scler. 29, 1363–1372 (2023).
Dahlke, F. et al.Characterisation of MS phenotypes across the age span using a novel data set integrating 34 clinical trials (NO.MS cohort): age is a key contributor to presentation.多。Scler. 27, 2062–2076 (2021).
CAS一个 PubMed一个 PubMed Central一个 Google Scholar一个
Hauser, S. L. et al.Ocrelizumab versus interferon beta-1a in relapsing multiple sclerosis.N. Engl。J. Med。 376, 221–234 (2017).
CAS一个 PubMed一个 Google Scholar一个
Montalban, X. et al.Ocrelizumab versus placebo in primary progressive multiple sclerosis.N. Engl。J. Med。 376, 209–220 (2017).
CAS一个 PubMed一个 Google Scholar一个
Mowry, E. M. et al.Harnessing real-world data to inform decision-making: Multiple Sclerosis Partners Advancing Technology and Health Solutions (MS PATHS).正面。神经。 11, 632 (2020).
Lublin, F. D. Worsening MS—a reappraisal of how we characterize the MS disease course.多。Scler. 29, 1699–1700 (2023).
PubMed一个 Google Scholar一个
Hawker, K. et al.Rituximab in patients with primary progressive multiple sclerosis: results of a randomized double-blind placebo-controlled multicenter trial.安。神经。 66, 460–471 (2009).
CAS一个 PubMed一个 Google Scholar一个
Wolinsky, J. S. et al.Fingolimod effect on disability progression in primary progressive multiple sclerosis patients with inflammatory activity: a post-hoc subgroup analysis of the INFORMS study.多。Scler. 22, 679–680 (2016).
Eshaghi, A. et al.Identifying multiple sclerosis subtypes using unsupervised machine learning and MRI data.纳特。社区。 12, 2078 (2021).
CAS一个 PubMed一个 PubMed Central一个 Google Scholar一个
Ocampo, A. et al.Prognostic factors for worsening and improvement in multiple sclerosis using a multistate model.多。Scler. 30, 1455–1467 (2024).
PubMed一个 Google Scholar一个
Sormani, M. P. et al.Defining brain volume cutoffs to identify clinically relevant atrophy in RRMS.多。Scler. 23, 656–664 (2017).
PubMed一个 Google Scholar一个
Miller, D. H. et al.Brain atrophy and disability worsening in primary progressive multiple sclerosis: insights from the INFORMS study.安。临床翻译。神经。 5, 346–356 (2018).
CAS一个 PubMed一个 PubMed Central一个 Google Scholar一个
Cagol, A. et al.Association of brain atrophy with disease progression independent of relapse activity in patients with relapsing multiple sclerosis.贾玛神经。 79, 682–692 (2022).
PubMed一个 Google Scholar一个
Thorpe, J. W. et al.Serial gadolinium-enhanced MRI of the brain and spinal cord in early relapsing-remitting multiple sclerosis.神经病学 46, 373–378 (1996).
CAS一个 PubMed一个 Google Scholar一个
Kuhle, J. et al.Serum neurofilament is associated with progression of brain atrophy and disability in early MS.神经病学 88, 826–831 (2017).
CAS一个 PubMed一个 PubMed Central一个 Google Scholar一个
Kuhle, J. et al.Blood neurofilament light chain as a biomarker of MS disease activity and treatment response.神经病学 92, e1007–e1015 (2019).
CAS一个 PubMed一个 PubMed Central一个 Google Scholar一个
van den Bosch, A. et al.Neurofilament light chain levels in multiple sclerosis correlate with lesions containing foamy macrophages and with acute axonal damage.神经。NeuroMunol。Neuroinflamm。 9, e1154 (2022).
Radue, E. W. et al.Correlation between brain volume loss and clinical and MRI outcomes in multiple sclerosis.神经病学 84, 784–793 (2015).
Petracca, M. et al.Brain reserve and timing of clinical onset in multiple sclerosis.多。Scler. 30, 1290–1295 (2024).
PubMed一个 Google Scholar一个
Wattjes, M. P. et al.2021 MAGNIMS–CMSC–NAIMS consensus recommendations on the use of MRI in patients with multiple sclerosis.柳叶刀神经。 20, 653–670 (2021).
PubMed一个 Google Scholar一个
Müller, J. et al.Harmonizing definitions for progression independent of relapse activity in multiple sclerosis: a systematic review.贾玛神经。 80, 1232–1245 (2023).
PubMed一个 Google Scholar一个
Stadelmann, C. Multiple sclerosis as a neurodegenerative disease: pathology, mechanisms and therapeutic implications.Curr。意见。神经。 24, 224–229 (2011).
CAS一个 PubMed一个 Google Scholar一个
Cree, B. A. Genetics of primary progressive multiple sclerosis.手。临床神经。 122, 211–230 (2014).
PubMed一个 Google Scholar一个
Frischer, J. M. et al.The relation between inflammation and neurodegeneration in multiple sclerosis brains.脑 132, 1175–1189 (2009).
Kuchling, J. et al.Identical lesion morphology in primary progressive and relapsing-remitting MS—an ultrahigh field MRI study.多。Scler. 20, 1866–1871 (2014).
PubMed一个 Google Scholar一个
Kuhlmann, T. et al.An updated histological classification system for multiple sclerosis lesions.Acta Neuropathol。 133, 13–24 (2017).
CAS一个 PubMed一个 Google Scholar一个
Lassmann, H. Targets of therapy in progressive MS.多。Scler. 23, 1593–1599 (2017).
PubMed一个 Google Scholar一个
Luchetti, S. et al.Progressive multiple sclerosis patients show substantial lesion activity that correlates with clinical disease severity and sex: a retrospective autopsy cohort analysis.Acta Neuropathol。 135, 511–528 (2018).
CAS一个 PubMed一个 PubMed Central一个 Google Scholar一个
Montalban, X. 2024 revisions of the McDonald criteria.Presented at the European Committee for Treatment and Research in Multiple Sclerosis (ECTRIMS), Copenhagen, Denmark.https://ectrims.eu/mcdonald-diagnostic-criteria(2024)。
Samjoo, I. A. et al.Comparative efficacy of therapies for relapsing multiple sclerosis: a systematic review and network meta-analysis.J. Comp。Eff.res。 12, e230016 (2023).
CAS一个 PubMed一个 PubMed Central一个 Google Scholar一个
Bussas, M. et al.Multiple sclerosis lesions and atrophy in the spinal cord: distribution across vertebral levels and correlation with disability.神经图像临床。 34, 103006 (2022).
Ruggieri, S. et al.The added value of spinal cord lesions to disability accrual in multiple sclerosis.J. Neurol。 270, 4995–5003 (2023).
CAS一个 PubMed一个 PubMed Central一个 Google Scholar一个
Sastre-Garriga, J. et al.Spinal cord reserve in multiple sclerosis.J. Neurol。Neurosurg。精神病学 94, 502–510 (2023).
PubMed一个 Google Scholar一个
Eden, D. et al.Spatial distribution of multiple sclerosis lesions in the cervical spinal cord.脑 142, 633–646 (2019).
Bonacchi, R. et al.Clinical relevance of multiparametric MRI assessment of cervical cord damage in multiple sclerosis.放射学 296, 605–615 (2020).
PubMed一个 Google Scholar一个
Bischof, A. et al.Spinal cord atrophy predicts progressive disease in relapsing multiple sclerosis.安。神经。 91, 268–281 (2022).
Hong, J. et al.Limited added value of systematic spinal cord MRI vs brain MRI alone to classify patients with MS as active or inactive during follow-up.J. Neurol。 272, 316 (2025).
Delbarre, D. J. et al.Application of a convolutional neural network to the quality control of MRI defacing.计算。生物。医学 151, 106211 (2022).
PubMed一个 Google Scholar一个
Mallon, A. M. et al.Advancing data science in drug development through an innovative computational framework for data sharing and statistical analysis.BMC Med。res。methodol。 21, 250 (2021).
CAS一个 PubMed一个 PubMed Central一个 Google Scholar一个
Kurtzke, J. F. Rating neurologic impairment in multiple sclerosis: an expanded disability status scale (EDSS).神经病学 33, 1444–1452 (1983).
CAS一个 PubMed一个 Google Scholar一个
D’Souza, M., Papadopoulou, A., Girardey, C. & Kappos, L. Standardization and digitization of clinical data in multiple sclerosis.纳特。Neurol牧师。 17, 119–125 (2021).
PubMed一个 Google Scholar一个
Schwid, S. R., Goodman, A. D., McDermott, M. P., Bever, C. F. & Cook, S. D. Quantitative functional measures in MS: what is a reliable change.神经病学 58, 1294–1296 (2002).
CAS一个 PubMed一个 Google Scholar一个
Tombaugh, T. N. A comprehensive review of the Paced Auditory Serial Addition Test (PASAT).拱。临床神经精神病。 21, 53–76 (2006).
PubMed一个 Google Scholar一个
McDonald, W. I. et al.Recommended diagnostic criteria for multiple sclerosis: guidelines from the international panel on the diagnosis of multiple sclerosis.安。神经。 50, 121–127 (2001).
CAS一个 PubMed一个 Google Scholar一个
Smith, S. M. et al.Accurate, robust, and automated longitudinal and cross-sectional brain change analysis.神经图像 17, 479–489 (2002).
PubMed一个 Google Scholar一个
Smith, S. M., De Stefano, N., Jenkinson, M. & Matthews, P. M. Normalized accurate measurement of longitudinal brain change.J. Comput。协助。Tomogr. 25, 466–475 (2001).
CAS一个 PubMed一个 Google Scholar一个
RoÄková, V. & George, E. I. Fast Bayesian factor analysis via automatic rotations to sparsity.J. Am。统计联合。 111, 1608–1622 (2016).
Malsiner-Walli, G., Frühwirth-Schnatter, S. & Grün, B. Model-based clustering based on sparse finite Gaussian mixtures.统计计算。 26, 303–324 (2016).
PubMed一个 Google Scholar一个
Viterbi, A. Error bounds for convolutional codes and an asymptotically optimum decoding algorithm.IEEE Trans。inf。理论 13, 260–269 (1967).
Sparapani, R. A., Logan, B. R., McCulloch, R. E. & Laud, P. W. Nonparametric survival analysis using Bayesian Additive Regression Trees (BART).统计医学 35, 2741–2753 (2016).
Jackson, C. Multi-state modelling with R: the msm package.https://cran.r-project.org/web/packages/msm/index.html(2007)。
Rudick, R. A., Fisher, E., Lee, J. C., Simon, J. & Jacobs, L. Use of the brain parenchymal fraction to measure whole brain atrophy in relapsing-remitting MS.神经病学 53, 1698–1704 (1999).
CAS一个 PubMed一个 Google Scholar一个
致谢
The authors acknowledge the physicians and patients who participated in these studies for their valuable contributions toward the advancement of our knowledge of MS.We also thank the many anonymous researchers and reviewers who have discussed the results and their interpretations with us along the way.Finally, we thank M.-C.Mousseau (Novartis Ireland Ltd.) for her writing support, including reviewing and incorporating author and reviewer comments under the guidance of the authors, as well as P. Coyle (Novartis Ireland Ltd.) and H. Prasad VS (Novartis Healthcare Pvt. Ltd.) for their editorial and design assistance, respectively.
资金
Open access funding provided by Albert-Ludwigs-Universität Freiburg im Breisgau.
道德声明
竞争利益
A.J.T.receives fees from being Co-Chair, UCL-Eisai Steering Committee drug discovery collaboration;Member, National Multiple Sclerosis Society (NMSS) Research Programs Advisory Committee;Clinical Trials Committee, Progressive MS Alliance;Board Member, European Charcot Foundation;Editor in Chief,多发性硬化症杂志;and Editorial Board Member,Lancet Neurology。He receives no fees from being Chair (Scientific Ambassadors), ‘Stop MS’ Appeal Board, UK MS Society;research & academic counsellor, Fundació Privada Cemcat;and Ambassador, European Brain Council.A.J.T.additionally holds a patent for the MSIS-29 Impact Scale.X.M.has received speaking honoraria and travel expenses for participation in scientific meetings and has been a steering committee member of clinical trials or has participated in advisory boards of clinical trials in the past years with AbbVie, Actelion, Alexion, Biogen, Bristol Myers Squibb/Celgene, EMD Serono, Genzyme, F. Hoffmann-La Roche, Immunic, Janssen Pharmaceuticals, MedDay Pharmaceuticals, Merck, Mylan, NervGen, Novartis, Sandoz, Sanofi-Genzyme, Teva, TG Therapeutics, EXCEMED, the MS International Federation and the NMSS.F.D.L.reports as sources of funding for research: Novartis, Actelion, Biogen, Sanofi, NMSS, National Institutes of Health and Brainstorm Cell Therapeutics;consulting agreements/advisory boards/data and safety monitoring board: Biogen, EMD Serono, Novartis, Teva, Actelion/Janssen, Sanofi/Genzyme, Acorda, Roche/ Genentech, MedImmune/Viela Bio, Receptos/Celgene/Bristol Myers Squibb, TG Therapeutics, MedDay Pharmaceuticals, Atara Biotherapeutics, Mapi Pharma, Apitope, Orion Biotechnology, Brainstorm Cell Therapeutics, Jazz Pharmaceuticals, GW Pharma, Mylan, Immunic, Population Council, Avotres, Neurogene, Banner Life Sciences, LabCorp, Entelexo Biotherapeutics and NeuraLight;stock options: Avotres and NeuraLight;and speaker: Sanofi (non-promotional).L.K.’s institution (University Hospital Basel) has received the following exclusively for research support: steering committee, advisory board and/or consultancy fees (Biogen, EMD Serono Research and Development, Genentech, Janssen, Novartis, Clene Nanomedicine, Bayer, Bristol Myers Squibb, Celltrion, Eli Lilly (Suisse) SA, EMD Serono Research and Development, Galapagos NV, Kiniksa Pharmaceuticals, Merck Healthcare AG, Minoryx and Santhera, Neurostatus UHB AG, Roche, Sanofi, Santhera Pharmaceuticals, Shionogi BV, Wellmera AG and Zai Lab);speaker fees (Bristol Myers Squibb, Janssen, Novartis, Roche and Sanofi);grants (European Union, Innosuisse, Merck Healthcare AG, Novartis and Roche);and testimony (Df-mp Mplina & Pohlman).D.L.A.reports consulting fees from Biogen, Biohaven, Bristol Myers Squibb, Eli Lilly, EMD Serono, Find Therapeutics, Frequency Therapeutics, GlaxoSmithKline, Idorsia Pharmaceuticals, Kiniksa Pharmaceuticals, Merck, Novartis, Race to Erase MS, Roche, Sanofi-Aventis, Shionogi and Xfacto Communications as well as an equity interest in NeuroRx.R.A.B.has served as a consultant for AstraZeneca, Biogen, EMD Serono, Genzyme, Genentech, Novartis and VielaBio.He also receives research support from Biogen, Genentech and Novartis.H.W.has received honoraria for being a member of scientific advisory boards for Biogen, Evgen, Genzyme, MedDay Pharmaceuticals, Merck Serono, Novartis, Roche Pharma AG and Sanofi-Aventis as well as speaker honoraria and travel support from Alexion, Biogen, Cognomed, F. Hoffmann-La Roche, Gemeinnützige Hertie-Stiftung, Merck Serono, Novartis, Roche Pharma AG, Genzyme, Teva and WebMD Global.H.W.is also acting as a paid consultant for AbbVie, Actelion, Biogen, IGES, Johnson & Johnson, Novartis, Roche, Sanofi-Aventis and the Swiss Multiple Sclerosis Society.His research is funded by the German Ministry for Education and Research (BMBF), the Deutsche Forschungsgemeinschaft (DFG), the Else Kröner Fresenius Foundation, the European Union, the Hertie Foundation, the NRW Ministry of Education and Research, the Interdisciplinary Center for Clinical Studies (IZKF) Muenster and RE Children’s Foundation, Biogen, GlaxoSmithKline, Roche Pharma AG and Sanofi-Genzyme.D.A.H., P.A., G.G., W.S., E.F., L.G.and B.C.K.are employees of Novartis.H.G., Y.S., S.G., T.E.N.and C.C.H.are current employees of the Big Data Institute, which received funding from Novartis to collaborate on AI in medicine, including the work presented here.C.B. and S.P.T.are employees of Roche.A.B.received speaker honoraria from Amicus Therapeutics and Biogen.十。received consulting fees from Perspectum Ltd.
同行评审
同行评审信息
自然医学thanks the anonymous reviewers for their contribution to the peer review of this work.Primary Handling Editor: Lorenzo Righetto, in collaboration with the自然医学团队。
附加信息
Publisher’s note关于已发表的地图和机构隶属关系中的管辖权主张,Springer自然仍然是中立的。
Extended data
Extended Data Fig. 1 Disease classification of multiple sclerosis.
Consensus definitions from 1996 and in its ‘2013 revisions’ and variants of it as used in indication statements in US packet inserts, summaries of product characteristics by the European Medicines Agency and in scientific publications.Relapsing forms of multiple MS include CIS, RRMS, and aSPMS in adults.aRRMS, active RRMS;aSPMS, active SPMS;CIS, clinically isolated syndrome;haRRMS, highly active RRMS;IPPMS, late PPMS (as opposed to ‘early PPMS’);MS, multiple sclerosis;naSPMS, non-active SPMS (as opposed to ‘active SPMS’);PMS progressive MS (SPMS + PPMS);PPMS, primary progressive MS;PRMS, progressive relapsing MS;RRMS relapsing remitting MS;SPMS, secondary progressive MS;«progression in MS » refers to the process of progression, which occurs in all subtypes of MS.
Extended Data Fig. 2 Selecting the number of states.
BIC, Bayesian Information Criterion.A local minimum would indicate the optimal number of states.However, no single best number of states was identified.Models with more and more states with overlapping disease features (as illustrated in Extended Data Fig.3) – representing a gradient in disease severity features – were found to be a better representation of the data than simpler models.
Extended Data Fig. 3 Graphical illustration of disease states and MS as a gradient.
The states represent a gradient of disease severity based on physical disability and brain damage with distinct inflammatory states without accompanying symptoms (state 4) or with such symptoms, that is relapse (state 5).一个, Density plots in the eight-state model: Latent factor distribution in the eight states.Overlapping distributions form a gradient of disease severity based on physical disability and brain damage.Distinct inflammatory states for the clinical relapse (state 5), and for asymptomatic lesions (state 4)b, Endpoint distribution of the original clinical and radiological variables in the eight states.EDSS, Expanded Disability Status Scale;Gd, gadolinium-enhancing;MS, multiple sclerosis;PASAT, Paced Auditory Serial Addition Test.
Extended Data Fig. 4 Alternative models with nine or ten states.
a,b, model with nine states.光盘, model with 10 states.Composite score of MS dimensions and empirical means of the original variables characterising the states (一个和c)。Transition probability matrix from FAHMM (b和d)。The transition probabilities refer to the probability of changing from one disease state to another one within a period of 1 month;the colour code refers to the clinical disease states as described in Fig.1。Asympt., asymptomatic;EDSS, Expanded Disability Status Scale;Gd + , gadolinium-enhancing;PASAT, Paced Auditory Serial Addition Test.
Extended Data Fig. 5 Eight-state modelling by MS subtypes.
Clinical states (一个) and transition matrices between states (b) for bout-onset MS (RRMS, SPMS) and PPMS separately.The disease severity gradient from EME to advanced states of MS, as well as the relapse and asymptomatic disease activity states, were re-discovered for PPMS, and similar to those observed for bout-onset MS.As a minor difference, only one EME state and several advanced states were discovered when fitting the model only to PPMS patients.This is expected, as studies in PPMS systematically excluded patients with an EDSS < 3.5.Overall, disease states and transition patterns were similar between RRMS-SPMS and PPMS patients.
Extended Data Fig. 6 Eight-state modelling with no imputation of missing data.
Analysis based on non-missing data, that is analysis without data imputation performed by mapping data to annual visits (based on the availability of annual MRI scans): (一个) clinical states and (b) transition matrix between states.The frequency of subclinical disease activity is underestimated in this model due to the remapping of relapses from other timepoints were they occurred to the annual visits where MRI scans are available.Overall, the disease states and transition patterns observed were similar to those in the main model.
补充信息
41591_2025_3901_MOESM1_ESM.pdf
The supplementary file contains five sections as follows: Section 1 (Data sources): Fig. 1.1 and Fig. 1.2.Section 2 (Main model based on NO.MS): Table 2.1.Section 3 (Replication results in holdout NO.MS data): Fig. 3.1 and Table 3.1.Section 4 (Individual patient trajectories): Fig. 4.1.Section 5 (Methodology).
权利和权限
开放访问This article is licensed under a Creative Commons Attribution 4.0 International License, which permits use, sharing, adaptation, distribution and reproduction in any medium or format, as long as you give appropriate credit to the original author(s) and the source, provide a link to the Creative Commons licence, and indicate if changes were made.The images or other third party material in this article are included in the article’s Creative Commons licence, unless indicated otherwise in a credit line to the material.If material is not included in the article’s Creative Commons licence and your intended use is not permitted by statutory regulation or exceeds the permitted use, you will need to obtain permission directly from the copyright holder.To view a copy of this licence, visithttp://creativecommons.org/licenses/by/4.0/。重印和权限
引用本文

Ganjgahi, H., Häring, D.A., Aarden, P.
等。AI-driven reclassification of multiple sclerosis progression.Nat Med(2025)。https://doi.org/10.1038/s41591-025-03901-6
已收到:
公认:
出版:
doi:https://doi.org/10.1038/s41591-025-03901-6