深度学习驱动的物联网解决方案用于智能番茄养殖
作者:Sasikumar, P.
养活世界不断增长的人口是我们今天面临的最大挑战之一。
据估计,到2050年,全球人口将达到97亿人口,这意味着粮食生产必须增加约70%才能跟上需求1。但是,由于土地有限,劳动力短缺,气候变化以及对可持续实践的需求,传统的农业方法常常缺乏。2,,,,3。因此,农民和科学家正在转向一种现代农业的耕种方式,它使用诸如物联网(IoT),无线传感器网络(WSN)和人工智能(AI)之类的智能技术,以更有效地种植农作物。
这项工作介绍了一个专为温室番茄养殖设计的智能系统。该系统使用传感器,相机和深度学习模型来监视环境条件并自动检查番茄成熟度。通过将实时传感器数据与基于图像的检测相结合,我们的系统可以帮助农民更好地管理农作物,减少废物并提高生产力。该系统是使用实际组件实施的,并使用真实的温室图像进行了测试,以证明其有用性。
物联网和WSN在PA中的作用
物联网(IoT)是一个可以收集,共享和行动数据的智能设备网络。在耕作中,物联网设备包括小型传感器,这些传感器衡量了土壤水分,温度,湿度,光线等等诸如诸如。这些设备通过无线传感器网络(WSN)无线将数据发送到中央控制器,该控制器可以根据数据做出决策。
尽管许多现有系统仅收集和显示此数据,但我们的系统进一步走了一步。它使用传感器值和相机图像来帮助监视植物状况并立即采取行动,例如打开水泵或调节光。这种自动化有助于农民节省时间并减少人为错误的机会。
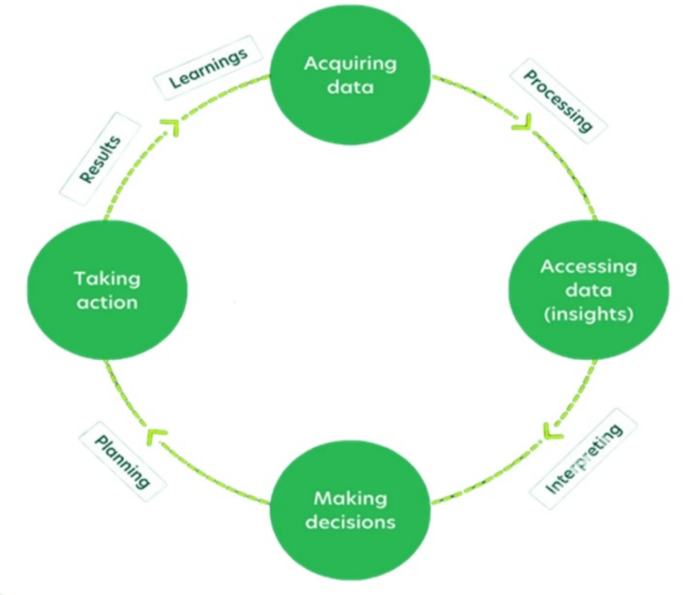
数字1说明了精确农业(PA)周期。通过不断监视环境条件并采用数据驱动的见解,PA可以帮助农民优化资源使用,例如水和肥料,增强作物产量,同时最大程度地减少环境影响。
关注番茄作物监测
西红柿是世界各地温室中最成年的农作物之一。它们对环境变化很敏感,需要适当的温度,湿度和光才能生长良好。他们还经历了从绿色到黄色的清晰成熟阶段,这使它们适合基于图像的监视8,,,,9。
传统上,农民通过检查西红柿是否成熟。这种方法并不总是可靠的,尤其是当农场庞大或不同的人有不同意见时。使用深度学习,尤其是诸如Yolov8(您只看一次)的模型,可以使用图像准确地将西红柿准确地分类为成熟阶段。但是,许多过去的系统仅在具有完美照明和干净背景的实验室设置中工作。我们的工作重点是建立一个在真正的温室条件下工作的系统,其中包括阴影,不同的光线和自然混乱。
重要的物联网在农业领域
气候控制
传感器连续监测温室内的温度和湿度水平。该系统会根据需要自动调整通风,供暖和冷却,以保持昼夜季节保持稳定,最佳的生长条件。这样可以防止植物压力并促进健康的生长。
害虫和疾病管理
物联网设备,例如信息素陷阱和基于摄像机的监测系统,早日检测有害生物侵扰和疾病暴发。这可以及时进行干预,减少了使用的有毒农药的数量和农业损失。
灌溉管理
智能灌溉系统使用天气预报和土壤水分数据来确定最佳的浇水时间表。这样可以最大程度地减少水浪费,并确保在适当的时间获取合适的水。
产生预测和作物监测
物联网设备与遥感技术相结合,提供准确的产量预测并监测作物的生长和健康。农民可以更好地管理自己的农作物,并通过使用这些数据来计划收获。
实时监控的传感器技术
PA利用各种传感器来收集温室中的关键数据点。这些可以包括:
土壤水分传感器
连续监测土壤水分水平,以确保植物的最佳水量。这可以防止过度浇水,这可能导致根腐烂和养分浸出,以及水管,这会给植物带来压力并阻碍果实的发展。
温度和湿度传感器
监视温室内的温度和湿度水平。将这些因素保持在特定范围内对于调节植物生长,水果发展和防止疾病的传播至关重要。
光传感器
测量到达植物的光强度和光谱。西红柿需要特定的光水平才能获得最佳光合作用。传感器可以触发对人造照明系统的调整,即使在低自然光的时期,也可以确保全天保持一致的光条件。
成像传感器
捕获植物的视觉数据,从而可以检测疾病或害虫侵染的早期迹象。在这项研究中,成像传感器用于从温室收集实时番茄成熟图像,从而提高了Yolov8模型的准确性。
数据分析和决策
来自各种传感器的数据被发送到云平台或中央处理单元。使用高级数据分析,模式,趋势和可能的问题。经过过去数据培训的机器学习算法可以预测未来的作物生长并提出预防措施。例如,该系统可以分析历史温度和湿度数据以及水果产量,以找到这些因素的最佳范围。这有助于农民尽早调整温室环境,以保持理想的水果生长和提高产量。分析数据和做出决策的能力对于精确的番茄生产很重要。
温室中的传感器网络收集大量的环境数据,但关键是有效地使用此数据。先进的统计分析至关重要。例如,相关分析有助于找到最佳的土壤水分水平,从而导致更好的灌溉和减少水浪费。同样,分析过去的温度,湿度和产量数据有助于预测季节性趋势并提前调整温室设置。机器学习通过使用历史数据来根据当前和预测的条件来预测未来产量变化来改善这一点。
这使农民可以采取积极的步骤,例如在热浪期间增加通风,以减少可能的产量损失。有助于害虫和疾病的风险也有助于农民预防疫情。当传感器读数与正常值不同时,实时数据分析可以发送警报。例如,温度突然升高或土壤水分降低会提醒农民迅速采取行动并保护农作物。总而言之,数据分析将原始传感器数据转化为有用的信息。这使农民更好地了解其作物需求,改善资源的使用,并在发生问题之前避免问题。结果是较高的收益率,质量更好的水果以及更可持续和高效的耕作系统。
自动和改进的资源管理
Precision农业(PA)在温室管理的几个领域支持自动化。例如,可以使用实时土壤水分数据自动控制灌溉系统。这有助于确保有效的用水并防止浪费。以同样的方式,可以根据温度和湿度读数来调整通风系统,以提高能源效率。
PA也可以用于照明控制。通过使用光传感器和计时器,系统可以遵循自然光图案或在弱光条件下提供额外的照明。这样可以确保植物获得适量的光合作用光,从而有助于提高生长和产量。
在这项研究中,还使用了基于成像的AI方法。这允许更好地使用资源,并有助于更有效地计划收获时间。
利益和未来范围
使用精密农业(PA)监测番茄作物,带来了一些明显的好处。它可以帮助提高产量,提高水果的质量并减少水和肥料的使用。这会导致降低运行成本和对环境的伤害。通过使用数据指导决策,农民可以在何时浇水,通风或收获方面做出更明智的选择,从而带来更好的总体结果。
随着技术的不断改进,我们可以期望看到更高级的传感器,更好的数据分析工具以及更强大的人工智能使用。这些发展将使番茄养殖更加准确和高效。
该项目还表明,可以使用更多的传感器节点将当前设置扩展到较大的物联网系统。这将有助于更好地进行性能测试和理解实际耕作情况下的系统。将来,移动应用程序和用户友好的接口可以使农民更容易从任何地方监视和控制温室条件。这为他们提供了更大的灵活性,并支持一种由数据和智能系统驱动的新耕作方式。
相关工作
近年来,物联网(IoT)和无线传感器网络(WSN)的结合在精确农业中引起了极大的关注。这些技术通过实时监控和控制各种环境因素来帮助提高作物产量和资源效率。许多研究探索了基于物联网的作物监测系统,将深度学习用于农业分析以及可视化和管理数据的云平台。但是,这些作品中的大多数都依赖于模拟条件或公共数据集,而无需在实际环境中测试其解决方案。
我们的研究旨在通过使用真实的温室图像和部署工作原型来弥合这一差距。本节回顾了该领域的相关工作 - 从物联网和WSN系统开始进行环境监测,然后是用于作物分析的深度学习应用程序,最后是基于云的工具,用于数据处理和可视化。它还强调了如何努力整合这些技术,以及我们的方法如何建立在它们基础上,以提供更实用的现实世界解决方案。
由于人口增长迅速而对食物的需求不断增长,因此需要采用创新的农业实践来提高生产力和可持续性1。创新的机器人系统专为自动检测温室中的番茄叶疾病而自动检测。2该系统通过深度学习模型集成了用于机器人自动导航的模糊控制算法,用于从叶子图像中对番茄植物疾病进行分类。这项研究的关键贡献是发展深度卷积生成对抗网(DCGAN)的发展。该DCGAN用于通过生成患病番茄叶的合成图像来增强训练数据集,从而显着增强了数据集的多样性和大小。该研究精心比较了九类番茄叶疾病中四种突出的深度学习架构(VGG19,Inception-V3,Densenet-201和Resnet-152)的表现。
精密农业利用了各种技术,例如传感器,无线通信和云计算,以高精度监视和管理农业变量。例如,物联网驱动的土壤水分,温度,湿度和光的监测在温室环境中起着至关重要的作用3。无线传感器网络(WSN)已成为促进此实时数据收集和控制的基础4。
传感器数据与自动执行器的集成允许制定智能控制策略,有助于减少资源浪费,提高作物产量并维持可持续性5。已经提出了越来越多的系统,该系统可以监视和调整参数,例如灌溉,通风和温室中的照明3。事实证明,这些平台在不连续的人类监督不切实际的偏远地区特别有用6。
最近的发展还结合了基于移动和云的界面,使农民可以远程可视化数据并实时与系统进行交互7。云服务提供可扩展的存储和实时分析,可以预测作物行为,确定压力状况并提出纠正措施8。
越来越多地探索边缘计算,以减少对恒定云通信的依赖。通过使用Raspberry Pi和ESP32等边缘设备,可以在现场实现实时处理和控制,从而提高系统响应能力和能源效率9,,,,10,,,,11。
专门为农业应用设计的数据集(例如番茄成熟度分类)支持了智能农业中深度学习模型的培训12。这些模型可以根据集成到温室系统的相机模块捕获的多光谱或RGB图像来检测成熟度阶段或疾病症状13。
计算机视觉和深度学习算法在植物识别,疾病检测甚至杂草分类方面表现出了令人印象深刻的结果,从而有助于有效的害虫控制和收获管理14。转移学习和模型优化技术进一步增强了实际农业环境中图像分类的性能15。
关于使用无人机和基于MAV的系统在开放场农业中的大规模数据获取,提供可扩展性和更好的空中见解方面也有大量研究16。这些工具通常与用于集中决策和自动致动的IoT基础架构相结合17。
文献指出了将物联网和AI组合到实时提供数据获取和智能分析的统一系统中的潜力18。这种融合确保了更高的自动化,并减少了对传统农业方法的依赖。
然而,在基于WSN的农业系统中,能源消耗仍然是一个关键的限制。研究重点是优化路由协议和传感器放置以延长系统寿命,尤其是在离网或太阳能的环境中19。因此,为温室自动化部署的物联网设备必须优先考虑节能沟通和计算方法20。
此外,几项作品已经证明了基于Arduino的温室的功效,用于初学者和教育目的,从而提供了低成本的智能农业。21。这些设置不仅负担得起,而且是模块化的,可以根据需要进行自定义22。
实际应用和现场部署增强了这种物联网系统用于温室监测和控制的可靠性。由于对环境变化的敏感性,温室西红柿从这种系统中受益匪浅23。现在,众多农业推广服务和在线平台现在为在当地实施这些技术提供指导24。
总而言之,文献表明,由物联网,WSN,边缘计算和深度学习支持的智能温室系统正在塑造农业的未来。这些跨学科系统可以增强环境控制,实现疾病检测,并最终提高农作物的质量和产量。当前的研究基于这些基本概念,以开发一个综合的智能番茄养殖平台,旨在弥合现有的技术差距,同时保持实用和可扩展现实世界的使用。
拟议的系统和规格
提出的系统集成了物联网,无线传感器网络(WSN),深度学习算法和云计算,以创建全面的智能农业解决方案。该系统旨在提供对作物条件的实时监控和分析,使农民能够做出数据驱动的决策以优化农作物的产量和资源利用。这项研究通过合并真正的温室图像,通过实际数据收集来提炼模型培训以及应对物联网部署挑战来增强现有解决方案。
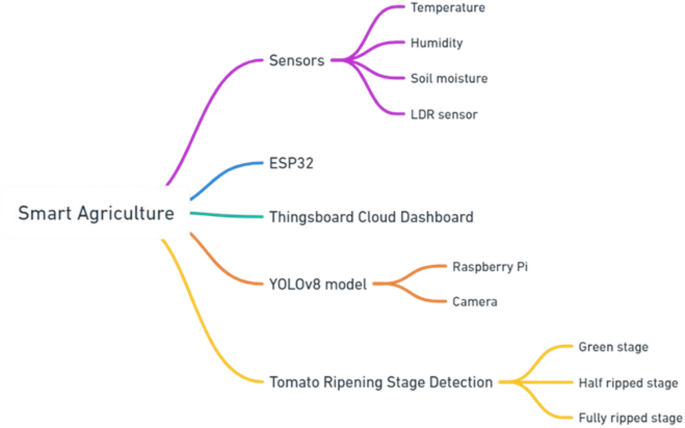
所建议的智能平台如图所示 2为了监测温室中的番茄作物,包括三个主要组件 - 用于温度,湿度和土壤水分的传感器,LDR传感器,ESP32微控制器以及用于数据可视化的Things Boards Cloud仪表板。此外,它还包括带有相机的覆盆子Pi,以及用于检测番茄成熟阶段的Yolov8模型(绿色舞台,近成熟的舞台和完全成熟的阶段),突出了现代农业中物联网和AI的集成。
基于物联网的传感器网络
实时数据通过在温室中部署原型节点来验证实时数据采集。选定的传感器包括:
土壤水分传感器
该设备确定土壤的水分水平,以允许靶向灌溉计划,以维持理想的水分水平,以获得最佳的根源发育和养分的吸收。
温度和湿度传感器
跟踪温室内的湿度和温度。这些数据对于维持舒适和控制的环境至关重要,从而促进最佳番茄生长。温度过高或湿度会导致发育迟缓,疾病爆发和果实质量降低。
光强度测量
LDR传感器可以集成到传感器网络中,以测量到达番茄植物的光量。随着光强度的增加,LDR传感器的电阻会降低。通过测量这种电阻,系统可以量化轻型植物正在接收。利用光数据:传感器测量的实时数据可能是:
受监控
农民可以通过云平台(物品板)远程查看温室中的数据水平。
分析
通过观察光趋势,他们可以确定数据水平低或过度的周期。
采取行动
可以进行调整以优化条件。这可能涉及使用人造灯在弱光期间补充自然光,或安装阴影布来调节强烈的阳光。基于传感器的动作,例如打开水轴或开关加热器,可以根据土壤水分和温度数据来控制。
多个单元设置
拟议的系统主要具有以下两个其他单元:
存储和传输单元
ESP32微控制器是中央数据收集和传输单元。它以预定义的间隔(例如,每分钟)从传感器收集数据,并使用Wi-Fi连接将其无线传输到云平台。ESP32提供了一种具有成本效益和高效的解决方案,但由于连续的Wi-Fi使用而受到高能量消耗的限制。未来的工作将探索较低的能源替代方案,例如基于洛拉的传输。
收集和图像处理单元
Raspberry Pi(单板计算机)用作图像存储和处理单元。它配备了PI摄像头模块,可定期捕获西红柿的图像(例如每小时)。然后使用Yolov8深学习模型对捕获的图像进行处理,该模型已进行了预培训,以识别和分类西红柿的成熟阶段(绿色,半成熟和完全成熟)。但是,未来的改进可能涉及使用其他温室特定图像对模型进行微调,以进一步提高准确性。
在实时对象检测任务中,选择了Yolov8模型的速度和准确性。它有效地分析了捕获的图像,识别番茄对象并分配周围的边界框。此外,该模型预测了每个检测到的番茄的成熟阶段,为收获计划和资源分配提供了宝贵的见解。为收获计划和资源分配提供宝贵的见解。但是,这项研究尚未解决嵌入式设备上的实时推断效率,这是进一步研究的潜在领域。
番茄植物环境
为了确保番茄植物的最佳生长和产量,必须在温室中维持特定的环境条件和参数 1。其中包括:
湿度
温室内的相对湿度水平应保持60%至70%。该范围有助于防止霉菌和霉菌等问题,同时确保植物具有足够的水分,以最佳蒸腾和营养吸收。
温度
番茄植物在20至25°C的温度范围内繁殖(68°F至77°F)。理想情况下,白天的温度应保持在22°C至24°C左右(72°F至75°F),而夜间温度可能会稍微稍微稍微稍低,约为18°C至20°C(64°F至68°F至68°F)。此范围以外的极端温度会对植物的生长和水果产生产生负面影响6。土壤水分定期监测土壤水分至关重要。
番茄植物需要始终如一的潮湿土壤,但不应浸水。
土壤水分水平应保持足够的水平,以确保正确的根源发育和养分吸收。
光强度
番茄植物需要充足的光合作用。在温室环境中,每天提供约6至8 h的阳光或同等人工照明是理想的选择。光强度应根据植物的生长阶段进行调整,以促进健康的发育和果实。
空气循环
适当的空气流通对于防止过热和湿度的积累至关重要。确保良好的通风有助于维持均匀的温度并降低真菌疾病的风险。未来的系统迭代可能包括用于自动化的物联网控制通风机制。
云平台
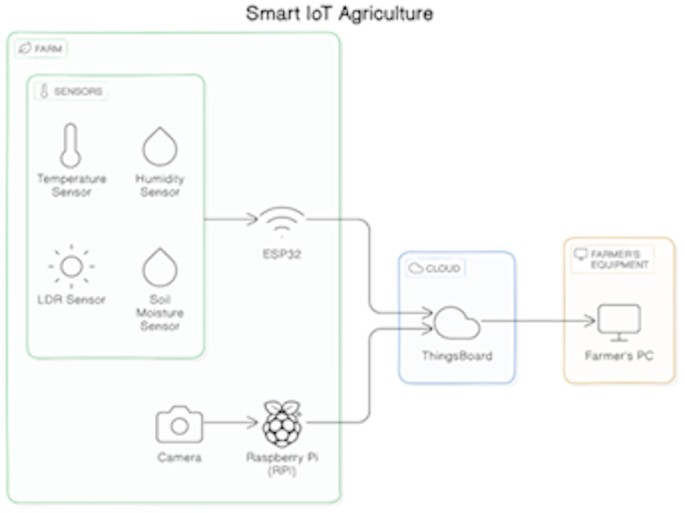
Thingsboard是一种开源的IoT平台,是基于云的平台,用于分析,可视化和数据存储。ESP32使用MQTT(消息队列遥测传输)协议,一种用于物质应用程序的轻型消息协议,用于将传感器数据发送到Themys板。图 3描绘整个物联网体系结构。图3
Thingsboard提供了直观的图形用户界面,用于远程访问记录的照片,历史趋势和传感器数据。用户可以:
-
查看各种格式的实时和历史数据,包括图表和图形,以了解趋势和环境波动。
-
为关键事件(例如,超过温度阈值或严重低的土壤水分水平)配置警报,以确保迅速干预。
-
生成报告以进行进一步分析,使农民能够随着时间的流逝来监测农作物的状况,并在恶化之前发现可能的问题。
软件实施:使系统栩栩如生
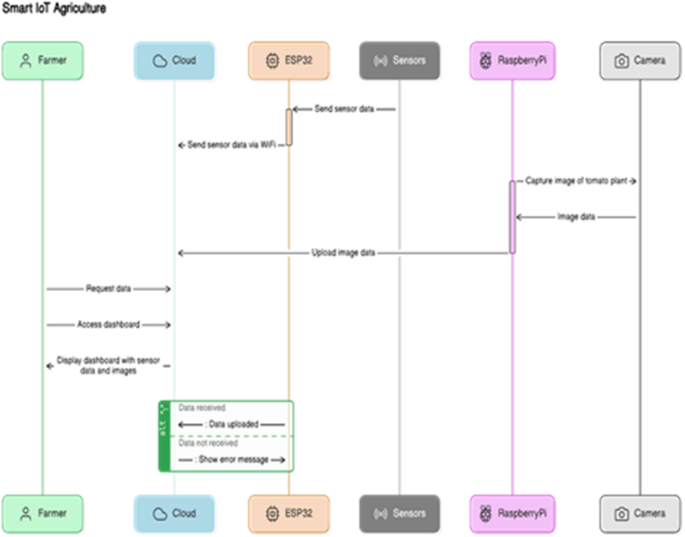
智能平台的软件组件在收集,发送,处理和显示数据中起着重要的作用,图1 4展示了我们提出的智能物联网农业的流程图。这是软件功能的概述:
传感器数据采集
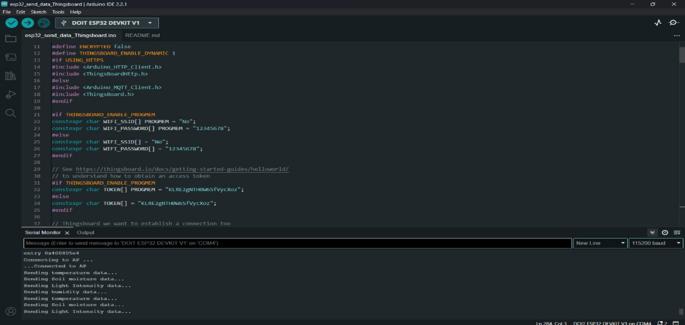
ESP32是使用Arduino IDE(集成开发环境)编程的,以预定义的间隔从连接的传感器收集数据。使用特定于传感器模型的库来确保准确的数据读数。然后将收集的数据格式化并打包,以有效地传输到云平台。
数据传输
数字3下面说明了基于智能物联网的农业系统中的数据流。ESP32微控制器收集实时传感器数据,例如温度,湿度和土壤水分,并通过MQTT将其传输到Wi-Fi上的Things clobs云。带有摄像头的覆盆子Pi捕获了农作物图像,这些图像是使用Yolov8之类的模型在本地处理的,以检测成熟度或疾病。处理后的见解和实时传感器数据显示在云仪表板或农民的PC上,实现了知情的实时决策。该设置显示了边缘设备,云平台和AI如何共同努力以增强精确耕作。
图像捕获和处理
Raspberry Pi利用其操作系统(例如Raspberry Pi OS)和Python编程语言来控制相机模块以捕获图像。诸如OpenCV(OpenSource计算机视觉库)之类的库用于图像处理任务,例如调整大小和格式转换。
数据集
'Labono Tomato是一个在成熟的不同阶段生长番茄的图像数据集,该数据集设计用于对象检测和实例分割任务。该数据集包括两种按大小分开的西红柿子集,并使用两个单独的摄像机聚集在当地的农场,具有不同的分辨率和图像质量5。
根据成熟阶段,每个番茄根据大小(正常大小和樱桃番茄)分为两类(正常大小和樱桃番茄),三类:
-
完整的涂层 - 完全红色,准备收获。在90%或更多的情况下充满红色。
-
缩小 - 绿色,需要时间成熟。在30英寸的89%*上充满红色。
-
绿色 - 完全绿色/白色,有时有稀有的红色部分。在0到30%*上充满红色。
*所有百分比均为近似,并且情况有所不同。
数据集包括804张图像,其中包含以下详细信息5:
名称:tomato_mixed。
图像拆分:643列火车,161测试。
CLS_NUM:6。
cls_names:b_uly_ripened,b_half_ripened,b_green,l_ly_ripened,l_half_ripened,l_green。
total_bboxes:train [7781],测试[1,996]。
bboxes_per_class:
*火车:b_ly_ripened [348],b_half_ripened [520],b_green [1467]。
l_uly_ripened [982],l_half_ripened [797],l_green [3667]。
*测试:b_uly_ripened [72],b_half_ripened [116],b_green [387],
l_uly_ripened [269],l_half_ripened [223],l_green [929]。
Image_Resolutions:3024â4032,3120â4160
模型创建
培训了基于Yolov8n体系结构的模型,用于检测西红柿的成熟阶段。该模型将高分辨率图像(3024â4032或3120â4160)作为培训和验证输入。头部,脖子和骨干构成了Yolov8建筑的三个主要部分。用作大脑的卷积神经网络(CNN)使用输入图像来提取关键信息。This is followed by the neck, which processes these features through layers such as Feature Pyramid Networks (FPN) or Path Aggregation Networks (PAN).Finally, the head predicts bounding boxes and class probabilities for each detected tomato.The backbone utilizes convolutional layers with kernel sizes of 3 × 3 and activation functions of Rectified Linear Unit (ReLU).MaxPooling layers are applied to each convolutional layer to reduce spatial dimensions, and the data is transformed into a column vector by a global average pooling layer.This vector is linked to a dense layer that utilizes softmax as the activation function and has six output nodes (full, half-ripened, and green, for both regular size and cherry tomatoes).
模型培训
The parameters used to train the Adam optimization algorithm and the YOLOv8n model are shown in Table 2。The loss function of the model was derived by combining binary cross-entropy for classification and mean squared error for bounding box regression, two frequently used functions for object detection tasks.The number of epochs was set to 25 to ensure adequate training time for convergence.
YOLOv8n model deployment
The YOLOv8 deep learning model is trained based on the dataset and optimized for deployment on the Raspberry Pi.To accommodate IoT-constrained devices with limited computational power, optimization techniques such as model quantization, pruning, and TensorRT acceleration were applied.
-
Quantization: Reduces the precision of weights from 32-bit floating point to 8-bit integers, decreasing model size and improving inference speed.
-
Pruning: Removes less significant neural connections, reducing computational complexity while maintaining accuracy.
-
TensorRT Acceleration: Converts the model into an optimized inference engine for ARM-based hardware.
-
Performance Changes: After optimization, the model demonstrated a 35% reduction in inference time while maintaining an accuracy of 50.8% in classifying ripening stages.Compared to the original model, RAM usage decreased by 40%, and power consumption was optimized to ensure sustainable real-time execution on the Raspberry Pi.
Once deployed, the optimized model analyzes the captured images, detecting tomatoes and predicting their ripening stages with improved efficiency.Future work will focus on further reducing latency by exploring Edge TPU-based acceleration for real-time applications.
Why YOLOv8
The selection of YOLOv8n for tomato ripeness detection is based on its superior balance of accuracy, speed, and resource efficiency, making it ideal for deployment on edge devices like Raspberry Pi in real-time agricultural scenarios.
-
Lightweight and Edge-Optimized: YOLOv8n is significantly more efficient than previous versions and other detection models, making it suitable for real-time inference on Raspberry Pi—a key requirement for our system.
-
High Accuracy with Small Objects: With an anchor-free architecture and improved bounding box regression, YOLOv8n delivers better detection of small, overlapping objects, such as tomato clusters, which are critical for precision agriculture.
-
Faster Inference: YOLOv8n supports real-time detection with minimal latency, allowing it to process footage.
Data visualization and management
The ThingsBoard platform offers a web-based interface for data visualization and management.Users can access real-time and historical sensor data presented in dashboards with customizable widgets like charts and graphs.Additionally, captured images with real-time ripening stage detection are displayed, offering a thorough perspective of the greenhouse setting.Users can also configure alerts, generate reports, and manage user access levels within the platform.
数字4above shows an IoT-based farm monitoring system.Sensors (temperature, humidity, light/LDR, soil moisture) connect to an ESP32 microcontroller, which sends data via Wi-Fi to the ThingsBoard cloud platform using the MQTT protocol.A Raspberry Pi with a camera handles image processing, while a farmer’s PC displays the data for analysis.The system enables real-time crop monitoring and precision agriculture.
代码可用性
The custom code used for sensor data acquisition, MQTT-based communication with the cloud, and YOLOv8-based tomato ripeness classification is available at Zenodo:https://doi.org/10.5281/zenodo.1642082125。This archived version ensures reproducibility and long-term accessibility.The repository includes Arduino code for the ESP32 microcontroller, Python scripts for model training of YOLOV8 that would run on Raspberry Pi.The code snapshot reflects the version used in the implementation described in this study.
-
Sensor data is transmitted via MQTT to ThingsBoard.
-
Mmodel training of YOLOV8.
Hardware implementation: Building the smart greenhouse system
The main challenge of designing the smart greenhouse system was to build low-cost and energy-efficient hardware capable of monitoring, gathering, and controlling physical parameters.The microcontroller unit (MCU) is the heart of the system.
The ESP32 microcontroller was selected due to its built-in Wi-Fi and Bluetooth capabilities, which facilitate wireless communication with the cloud platform.It is programmed using the Arduino IDE to collect sensor data, format it, and transmit it to the cloud.However, one challenge in this implementation is the ESP32’s high energy consumption, particularly when using continuous Wi-Fi transmission.Future iterations may explore power-efficient alternatives such as duty-cycled transmission or LoRa-based communication.The ESP32 operates at 3.3 V input voltage with a maximum CPU current draw of 240 mA, making it suitable for battery-powered greenhouse applications.
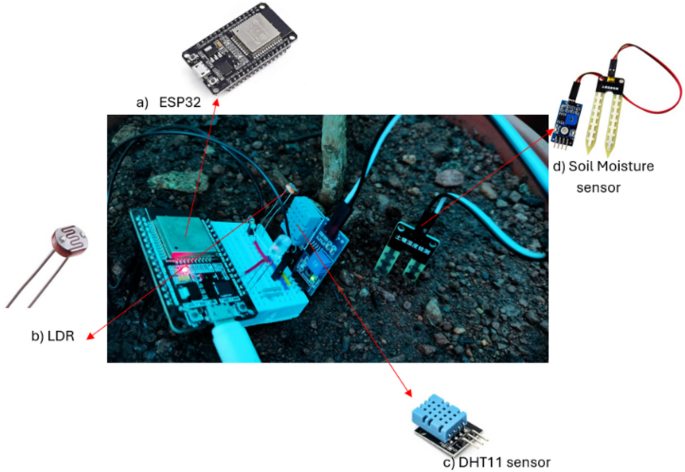
数字5shows the hardware components of a prototype node, including an ESP32 microcontroller for data processing, an LDR for measuring light intensity, and a DHT11 sensor for monitoring temperature and humidity.These components form the foundation of a sensor node used in smart agriculture systems.
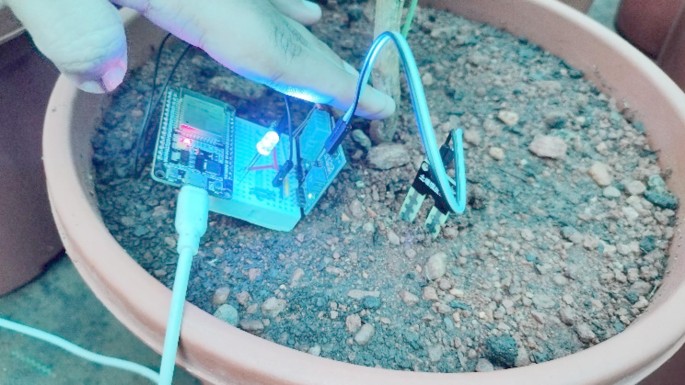
数字6demonstrates the use of LEDs to simulate or supplement natural light within a greenhouse.This visualization highlights the role of artificial lighting in optimizing plant growth conditions, especially in controlled environments where sunlight may be insufficient.
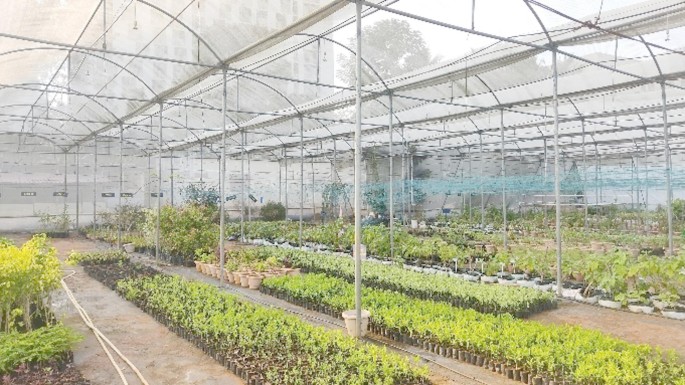
数字7is of the greenhouse located at VIT, Vellore, as part of the VAIAL department.The greenhouse represents an operational setup for studying advanced agricultural techniques to improve crop yields and resource efficiency.
Sensors are crucial for monitoring different environmental parameters in the smart greenhouse system.We used the sensors shown in Table 3。
The soil’s moisture content is measured by the capacitive soil moisture sensor, which is essential for ensuring that tomato plants receive the right amount of watering.The DHT11 sensor monitors the ambient temperature and humidity within the greenhouse, enabling control of ventilation and other climate factors.The LDR detects changes in light intensity, potentially useful for regulating supplemental lighting for the plants.
A Raspberry Pi serves as the image processing unit, enabling real-time monitoring of tomato ripening stages.Unlike prior works that utilized pre-labelled datasets, this study collected images directly from the greenhouse, improving model relevance for real-world applications.
A Pi Camera attached to the Raspberry Pi makes up the camera module, capturing images of the tomato plants for further analysis, as shown in Fig. 8。
Additional hardware components include jumper wires, a breadboard (optional), and a power supply.Jumper wires are used for connecting the various components, including sensors, and ESP32, as shown in Fig. 8。A breadboard provides a temporary platform for prototyping and testing the hardware connections before finalizing the design.The power supply ensures adequate power delivery to all the components, which could be a USB power bank or a dedicated power supply unit.
The hardware assembly process involves the following steps:
-
Connecting the sensors: Following the sensor datasheets and pin configurations, connect the soil moisture sensor, temperature and humidity sensor, and LDR to the ESP32 using jumper wires.一个·。
-
Set up the Raspberry Pi: Install the Raspberry Pi OS and configure the Raspberry Pi according to its user guide.一个·。
-
Connect the camera module: Attach the Raspberry Pi camera module following the official instructions.
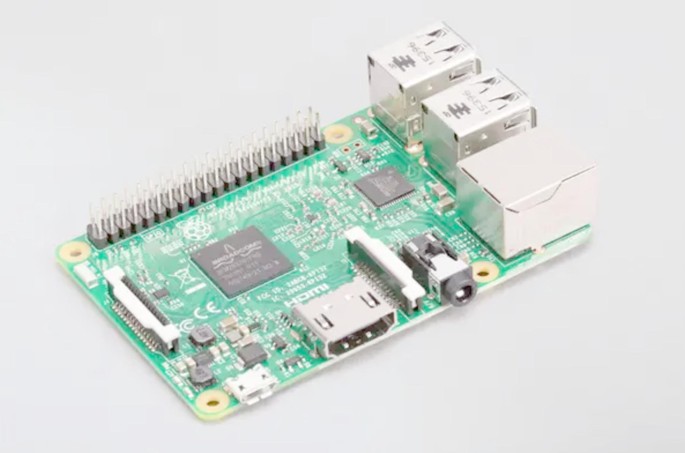
The single-board computer is a Raspberry Pi, serving as the processing unit for image capture, pre-processing, and running the YOLOv8 model for ripening stage detection.It features a ‘1.2 GHz 64-bit quad-core ARMv8 CPU, an integrated 802.11n wireless LAN and Bluetooth 4.1, Bluetooth Low Energy (BLE), 4 USB ports, a display interface (DSI), and a micro-SD card slot7。
Results: showcasing the platform’s capabilities
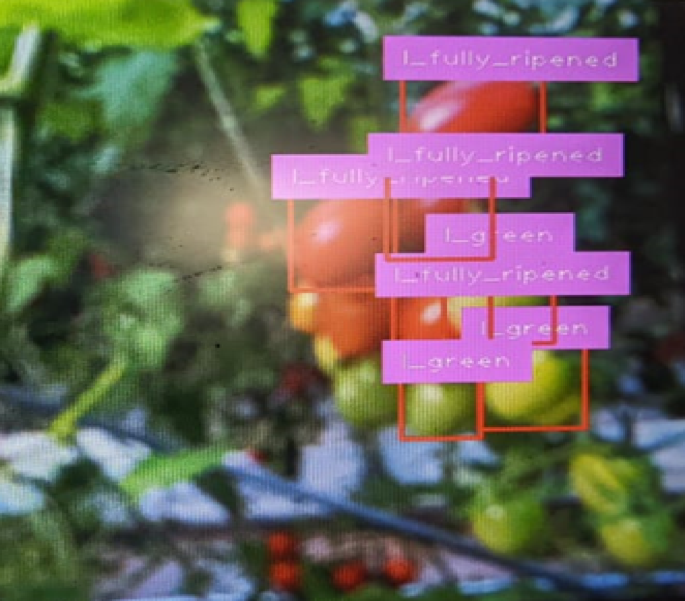
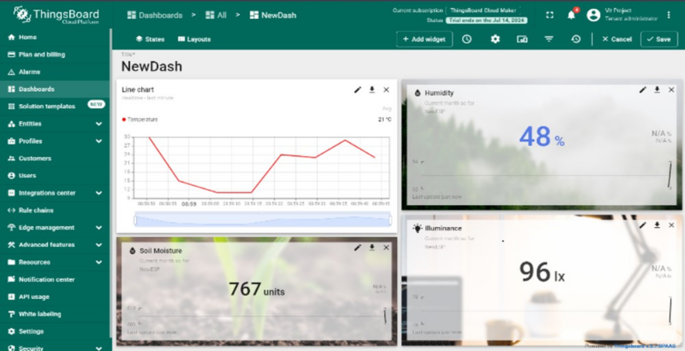
The proposed smart platform was implemented in a controlled greenhouse environment.The sensor network successfully collected real-time data on soil moisture, temperature, and humidity.ESP32 transmitted this data wirelessly to the ThingsBoard platform, where it was visualized on a user-friendly dashboard shown in Fig. 9。The Raspberry Pi captured images of tomatoes at regular intervals.The YOLOv8 model accurately detected tomatoes in the images and classified them according to their ripening stage (green, half-ripened, fully ripened).The processed image data, including bounding boxes and ripening stage labels, was transmitted to the ThingsBoard platform.
Image with ripening stage detection: Convolution neural network model
The YOLOv8 model accurately detected the ripening stages of the tomatoes.The Raspberry Pi captured images of the tomatoes at different stages of ripeness, and the model classified them into green, half-ripened, and fully ripened categories with high accuracy.Figure 10presents an example image captured by the Raspberry Pi camera.The image overlays bounding boxes around detected tomatoes with labels indicating their respective ripening stages (green, half-ripened, or fully ripened) predicted by the YOLOv8 model.This visual representation provides valuable information for harvest planning and resource allocation shown in Figs. 11和12。
Ripening stages of tomatoes5。
Confusion matrix
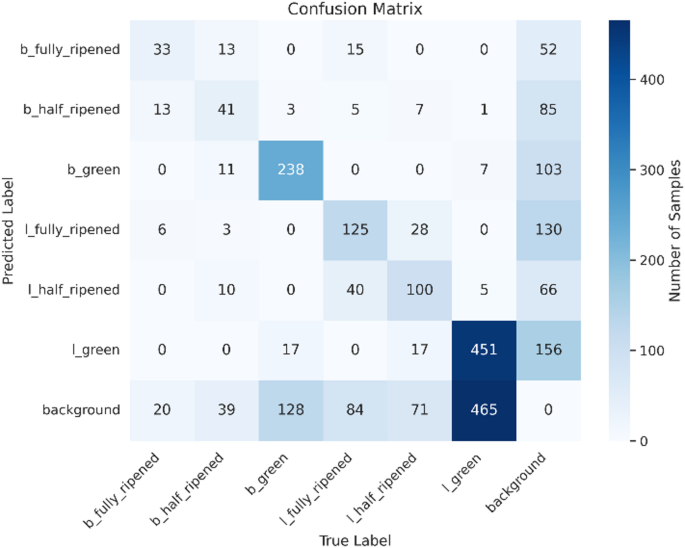
To examine the effectiveness of the YOLOv8n model, a confusion matrix was created (Figs. 17,,,,18,,,,19)。The matrix displays the predicted versus actual classes, allowing us to assess the model’s accuracy for each class.The results show that the model performs well in distinguishing between different ripeness stages.For instance, ‘l_green’ instances are mostly correctly classified, while some misclassifications occur between ‘b_half_ripened’ and ‘b_green’.The confusion matrix reveals that the ‘l_green’ class has the highest number of correct predictions, with a few instances of misclassification in other categories.This indicates that the model can accurately identify green tomatoes, but there is some room for improvement in distinguishing between half-ripened and fully ripened stages.
Model performance
Detection accuracy
The model demonstrates strong object detection capability across all six classes, with the highest accuracy in detecting l_green and l_fully_ripened tomatoes.Detection performance is slightly lower for b_fully_ripened and b_half_ripened, which can be attributed to the lower number of annotated samples.
In Table 4, the precision, recall, f1-score, and support columns show the results.Precision indicates the accuracy of the positive predictions made by the model, recall indicates how well the model can identify the overall positive class, and F1-score indicates the accuracy of the model.Based on the evaluation matrix results from Fig. 13, the model has an accuracy of 52% in testing the test data.
Visual prediction result
-
The output detection images in figure clearly show accurate bounding boxes and class labels overlaid on test images, confirming the model’s robustness under varied lighting and angle conditions.
-
Even in dense clusters or partial occlusions, the YOLOv8n model maintained reliable detections, making it viable for real-time agricultural applications.
Cloud dashboard: visualization and analysis
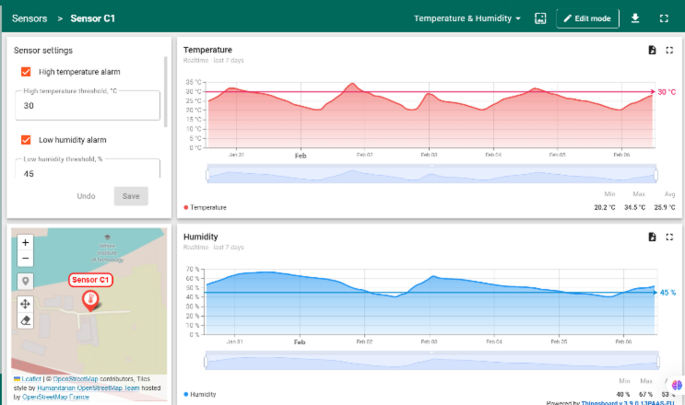
Figures 14和15depicts the ThingsBoard dashboard displaying real-time sensor data from the greenhouse.The dashboard includes widgets showcasing the current values of soil moisture, temperature, and humidity.Users can customize the dashboard to display historical data in the form of graphs and charts, providing insights into trends and fluctuations over time.Analysing these trends enables farmers to identify potential issues like rising temperatures or declining soil moisture levels and take corrective actions before they negatively impact crop health.
Data visualization
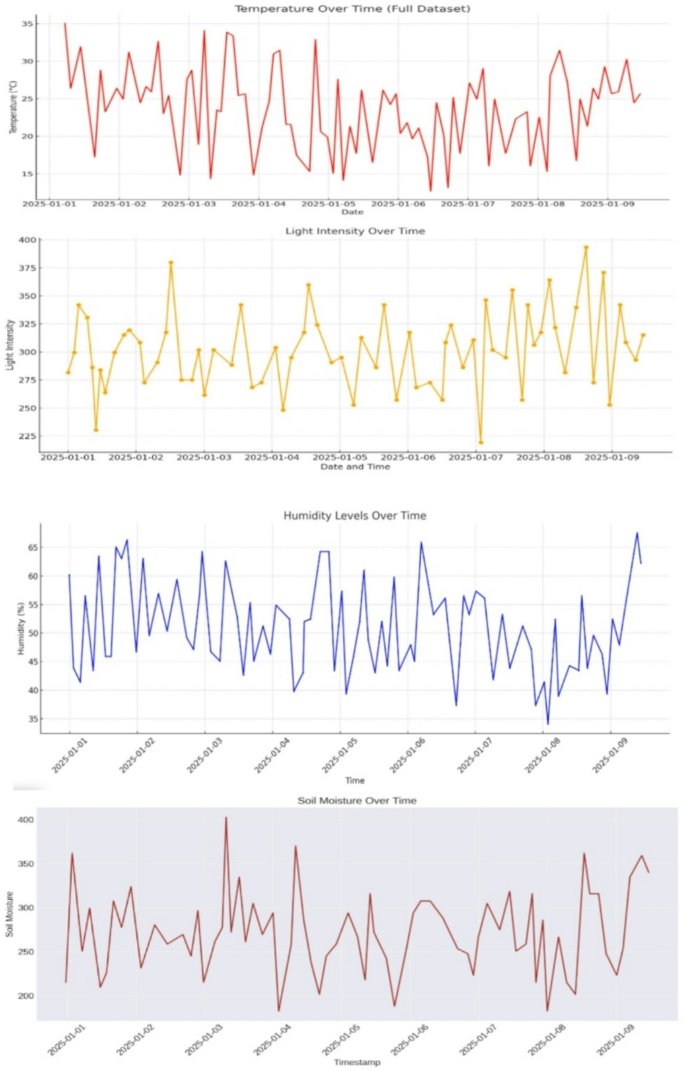
Figure 16illustrates a sample graph generated from the sensor data collected by the Thingsboard platform.The graph depicts the variations in temperature within the greenhouse over a specific period.The cloud-based dashboard provided a comprehensive view of the sensor data and ripening stages.The dashboard displayed real-time graphs of soil moisture, temperature, and humidity levels, as well as images of the tomatoes with their respective ripening stage.
分析
In this section, we present the results and analysis of the YOLOv8 model trained to detect the ripening stages of tomatoes.Various visualizations and metrics have been used to evaluate the model’s performance.
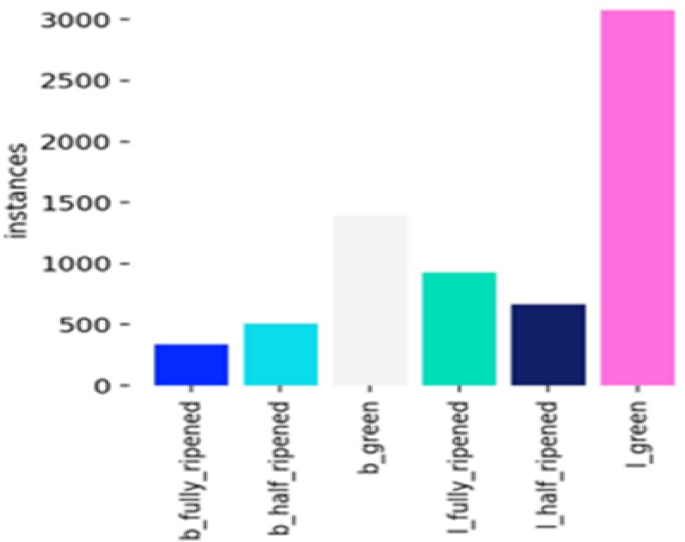
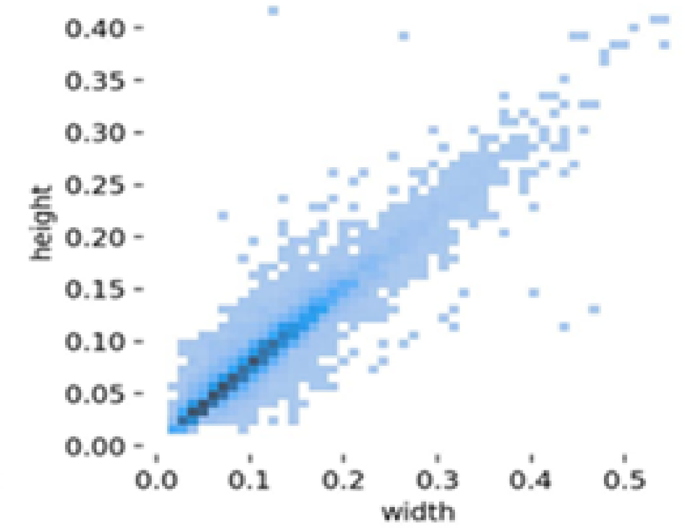
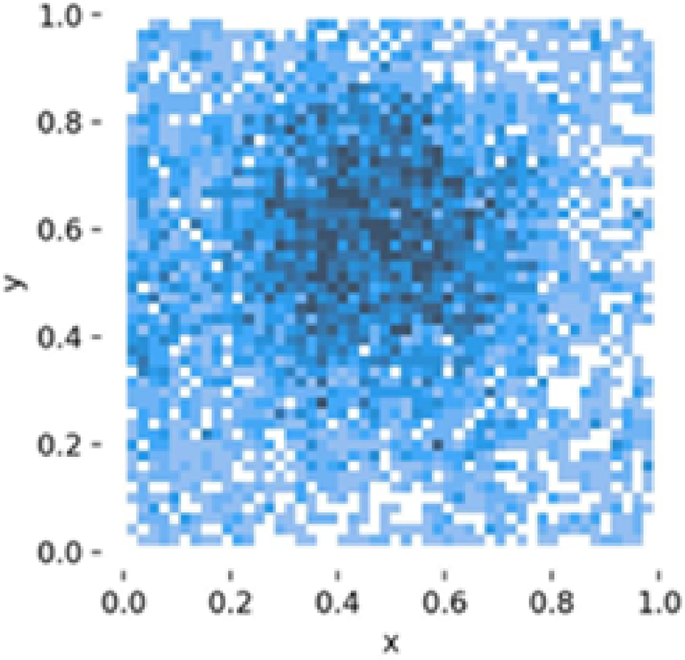
The instance distribution graph (Fig. 17) shows the number of instances for each class (‘b_fully_ripened’, ‘b_half_ripened, b_green’, ‘l_fully_ripened’, ‘l_half_ripened’, ‘l_green’).It highlights that the ‘l_green’ class has the highest number of instances, followed by ‘b_green’.The bounding box distributions (Fig. 18) display the normalized x and y coordinates, showing the density and distribution of bounding boxes in the images.The width and height distributions (Fig. 19) indicate the range of sizes of the bounding boxes, revealing a correlation between width and height.
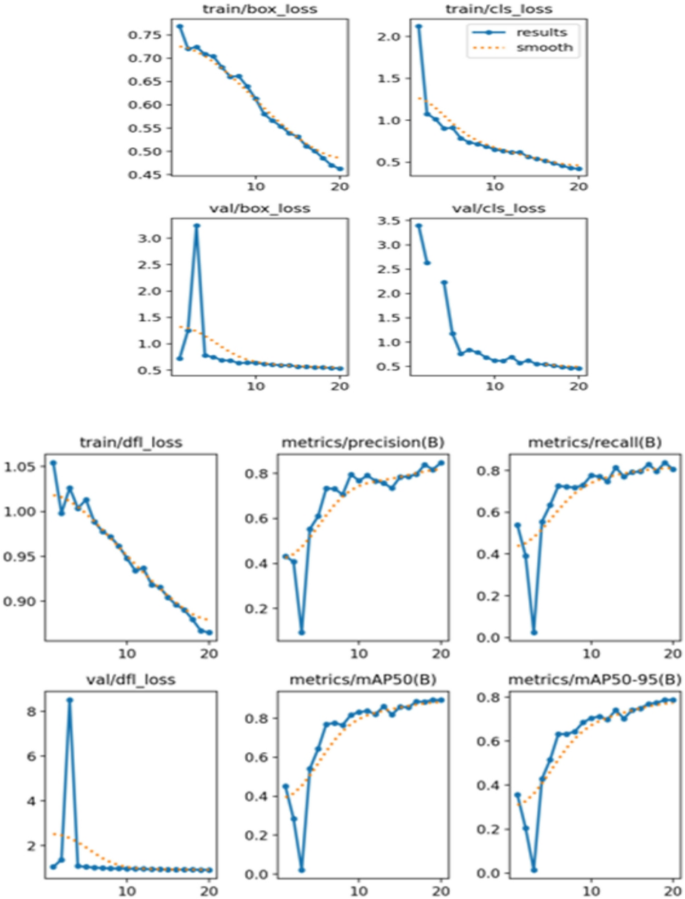
数字20presents the training and validation loss curves over 20 epochs.The training and validation box loss, class loss, and DFL loss are plotted.The results indicate a steady decrease in losses, suggesting that the model is learning effectively.Metrics such as precision, recall, mAP50, and mAP50-95 are also displayed, showing improvements as training progress.These metrics are critical for evaluating the model’s performance in detecting and classifying tomato ripeness stages.
能源消耗
Understanding the energy consumption of hardware components is critical for designing efficient and sustainable systems, especially in applications like smart greenhouses where devices are continuously operational.This section presents a detailed analysis of the Raspberry Pi 3 Model B and the ESP32 microcontroller, two essential parts of the smart greenhouse system, and how much energy they require.
Energy consumption of ESP328
The ESP32 microcontroller is designed for low-power applications and offers significant energy efficiency.It operates at a voltage of 3.3Â V and has distinct power consumption modes depending on its activity:
Active mode
When actively processing data or transmitting information, the ESP32 consumes approximately 160Â mA.
The power consumption in this mode is calculated as
$$\:P\left(active\right)\:=\:V\times\:I\:=\:3.3V\:\times\:\:160mA\:=\:0.528\:W$$
(1)
Sleep mode
In deep sleep mode, the ESP32 significantly reduces its power consumption to about 10 µA.The power consumption during sleep is:
$$\:P\left(sleep\right)=V\times\:I=3.3\:V\times\:10\:\mu\:A=0.033\:W$$
(2)
Assuming the ESP32 is active for 12Â h a day and in deep sleep for the remaining 12Â h, the daily energy consumption is:
$$\:Active\:Energy:\:E\left(active\right)=0.528\:W\times\:12\:h=6.336\:Wh$$
(3)
$$\:Sleep\:Energy:\:E\left(sleep\right)=0.033\:mW\times\:12\:h=0.000396\:Wh$$
(4)
Total daily energy consumption
$$\:E\left(total\right)=6.336\:Wh+0.000396\:Wh=\:\:6.336\:Wh$$
(5)
Wi-Fi transmission power
Wi-Fi communication is a major factor affecting ESP32’s power usage.The ESP32 uses ~ 260 mA when transmitting data over Wi-Fi, significantly increasing its power draw.To estimate the additional energy consumption:
$$\:P(Wi-Fi)\:=\:3.3V\:\times\:\:260mA\:=\:0.858W$$
(6)
Wi-Fi Usage Scenario: Assuming the ESP32 transmits data for 15Â min per hour throughout a 12-hour active period:
$$\:Wi-Fi\:Energy:\:E(Wi-Fi)\:=\:0.858W\:\times\:\:3h\:=\:2.574\:Wh/day$$
(7)
Revised Total ESP32 Energy Consumption:
$$\:E\left(total\right)\:=\:6.3364\:Wh\:+\:2.574\:Wh\:=\:8.9104\:Wh/day$$
(8)
Energy consumption of raspberry Pi 3 B7
The Raspberry Pi 3 Model B is intended for more demanding computational operations and runs at a higher voltage of 5Â V. The way it operates affects how much power it uses:
Active mode
When fully operational, the Raspberry Pi consumes approximately 500Â mA.The power consumption is:
$$\:{P}_{active}=V\times\:I=5\:V\times\:500\:mA=2.5\:W$$
(9)
Idle mode
When in idle mode, the Raspberry Pi’s consumption drops to about 400 mA.The power consumption is:
$$\:{P}_{idle}=V\times\:I=5\:V\times\:400\:mA=2\:W$$
(10)
For a continuous operational period of 24Â h, the daily energy consumption is:
$$\:\text{A}\text{c}\text{t}\text{i}\text{v}\text{e}\:\text{e}\text{n}\text{e}\text{r}\text{g}\text{y}\:{E}_{active}=2.5\:W\times\:24\:h=60\:Wh$$
(11)
Wi-Fi power consumption
Raspberry Pi Wi-Fi transmission draws ~ 300 mA additional current, leading to increased consumption.
$$\:Additional\:power\:due\:to\:Wi-Fi.\:5V\:\times\:\:300mA\:=\:1.5W$$
(12)
$$\:Estimated\:additional\:energy.\:1.5W\:\times\:\:12h\:=\:18\:Wh/day$$
(13)
Total energy consumption
$$\:E\left(total\right)\:=\:60\:Wh\:+\:18\:Wh\:=\:78\:Wh/day$$
(14)
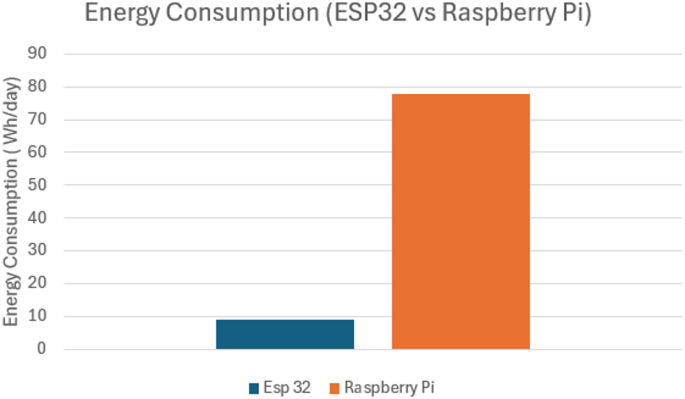
The energy consumption comparison between the ESP32 and the Raspberry Pi reveals substantial differences as shown in Fig. 21。
ESP32
Consumes about 8.91 Wh/day when active for 12Â h and in sleep mode for 12Â h.This low energy requirement highlights its suitability for battery-powered and energy-efficient applications.
覆盆子pi
Consumes approximately 78 Wh/day when continuously active.This higher energy consumption reflects its more intensive computational capabilities and constant operation.
数字21shows the comparative energy usage, highlighting the need for power-efficient alternatives in future deployments (e.g., LoRa, Edge TPU).
The proposed work considered a 9Â V Hi-Watt battery as a potential power source.While we have not physically tested this battery, analyzed its theoretical performance based on known specifications and expected power consumption patterns.The Hi-Watt 9Â V battery is a commonly available dry-cell battery with an estimated 500mAh capacity, providing approximately 4.5Wh of total energy.
Since the ESP32 operates at 3.3Â V, a voltage regulation circuit (such as an LDO or buck converter) would be required to step down the voltage.This introduces additional power losses, reducing the effective energy available to ESP32.Moreover, battery performance is influenced by nonlinear discharge characteristics, meaning that as the battery depletes, its voltage output gradually drops, affecting system stability.
The analysis highlights the importance of selecting a battery based on actual usage requirements rather than theoretical capacity alone.Factors like duty cycle, voltage regulation losses, and environmental conditions can significantly impact battery life.If a longer operational period is required, alternative power solutions such as higher-capacity Li-ion or Li-Po batteries, energy harvesting modules, or solar-powered setups could be considered.
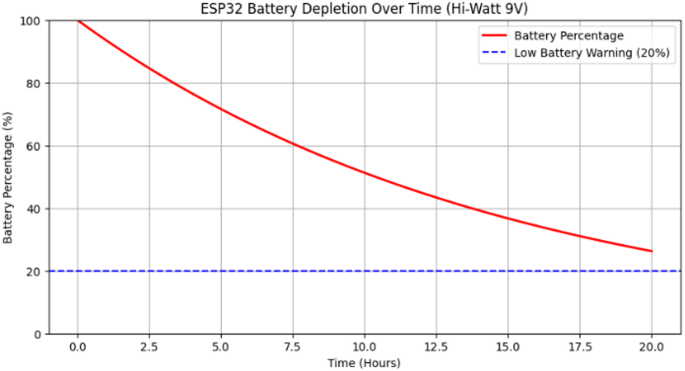
The battery depletion curve for the ESP32 shown in Fig. 22is not linear due to several factors, including internal resistance, chemical reaction kinetics, and discharge rate effects.As seen in the graph, the depletion follows an exponential decay trend rather than a straight-line decline.Initially, energy drains more rapidly due to higher available charge, but as the battery nears depletion, the rate of voltage drop slows down.
The ESP32’s energy consumption varies depending on its operating mode.In active transmission states (Wi-Fi/Bluetooth operations), power draw is significantly higher, whereas in deep sleep modes, the current consumption is minimal.The graph reflects an estimated depletion time of around 17–18 h, assuming a mixed operation profile.Once the battery level reaches the low battery threshold (20%), the system may enter power-saving modes or shut down due to insufficient voltage supply.
Understanding throughput vs. delay
Throughput refers to the rate at which data is successfully transmitted and received over the network, typically measured in kilobits per second (Kbps) or megabits per second (Mbps).Delay, on the other hand, represents the latency or time taken for data to reach the destination, which includes processing, queuing, and transmission delays.
In an ideal scenario, high throughput and low delay are desirable for efficient data transmission.However, real-world environments introduce factors such as:
-
Network Congestion: High data traffic may lead to increased queuing delays.
-
Wi-Fi Signal Strength: Weak signal strength can reduce data rates and increase retransmissions.
-
Cloud Processing Time: The ThingsBoard platform introduces an additional delay due to server-side data processing and dashboard updates.
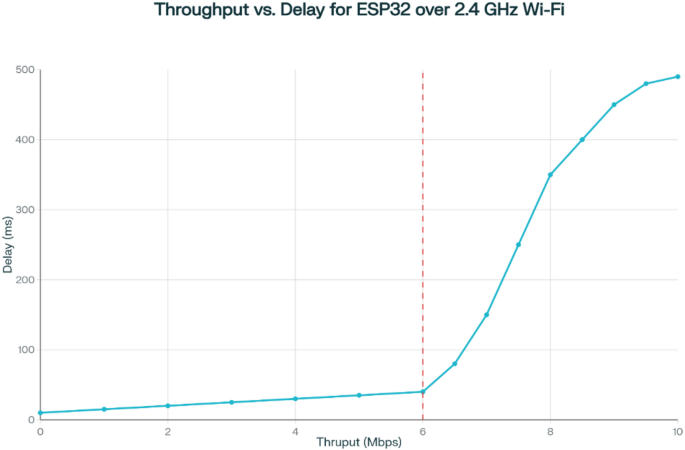
From the Throughput vs. Delay graph shown in Fig. 23, it is evident that as throughput increases, delays tend to rise beyond a certain threshold.This can be attributed to limited bandwidth and network contention, where a higher data rate results in increased packet queuing and retransmissions.The ESP32, operating on a typical 2.4 GHz Wi-Fi connection, experiences latencies ranging from a few milliseconds to several hundred milliseconds, depending on environmental interference and cloud response times.
Discussions and limitations
This smart platform offers a significant leap forward in greenhouse tomato crop monitoring.The integration of IoT and WSN technologies provides real-time data on critical environmental factors like temperature, humidity, and soil moisture.This empowers farmers to make informed decisions for optimized growth conditions, potentially leading to increased yields and improved crop quality.Furthermore, the incorporation of image processing and deep learning through the YOLOv8 model offers a valuable tool for monitoring tomato ripening stages.By accurately identifying ripening tomatoes, farmers can plan harvests more effectively, reducing the risk of overripe or underripe fruit reaching consumers.However, there are limitations to consider,
-
Model Performance in Greenhouse Environments: The YOLOv8n model achieved a classification accuracy of 52.8% on the tomato ripeness detection task, which is considered modest for deployment in real-world agricultural settings.This outcome is primarily due to the limited size and diversity of the dataset, which consisted of only 804 annotated images collected under varied lighting and occlusion conditions.Improving accuracy will require curating a significantly larger and more balanced dataset that represents all ripeness classes across different environmental scenarios.Additionally, the model can benefit from fine-tuning through advanced training techniques such as data augmentation, transfer learning with deeper architectures, and hyperparameter optimization.These measures will help improve generalization and robustness, ultimately enhancing performance in operational conditions.
-
Scalability and Adoptability - The proposed smart IoT agriculture system is scalable and easy to adopt for real-world use.Its modular design with ESP32 and Raspberry Pi allows adding more sensors and edge devices to support farms of different sizes.MQTT and cloud platforms like ThingsBoard enable efficient data management and smooth scaling.The system adapts to various crops through customizable sensors and retrainable deep learning models.Edge computing supports real-time processing, reducing cloud reliance and saving energy.Low-cost components, user-friendly dashboards, and remote monitoring make deployment simple for farmers.Its flexibility allows localization to different farming needs, promoting practical and sustainable precision agriculture.
-
Reliance on Internet Connectivity: The platform depends on a reliable internet connection for seamless data transmission to the cloud platform.Disruptions or outages could hinder real-time monitoring and potentially delay responses to critical changes in the greenhouse environment.Future work will explore edge processing techniques to reduce cloud dependency and ensure local decision-making during network downtimes.
-
Energy Consumption and IoT Protocol Selection: The ESP32’s continuous Wi-Fi transmission contributes to high power usage, reducing operational efficiency for battery-powered setups.Future optimizations include duty-cycled operation, alternative communication protocols such as LoRa and ZigBee, and power management techniques like dynamic frequency scaling to reduce energy consumption.
-
Future enhancements can explore the integration of hardware accelerators such as the Edge TPU, TensorRT, or NVIDIA Jetson Nano to support local decision-making during internet outages.These devices are designed to run deep learning models efficiently on the edge, enabling faster and more reliable inference without relying on continuous cloud access.Incorporating such accelerators would improve the system’s ability to process image data in real-time, maintain autonomous operations like ripeness detection and actuator control, and ensure uninterrupted performance in remote or connectivity-constrained environments.
-
Limited Deployment Scope: The study tested only one prototype node, limiting the ability to validate system scalability.Future work will involve multi-node deployment to improve spatial coverage and ensure a more comprehensive monitoring system.
-
Real-Time Processing Constraints: The YOLOv8 model runs on a Raspberry Pi, but inference speed is limited, leading to potential delays in processing image data.Optimizations such as model pruning, quantization, and integration with specialized accelerators (e.g., Edge TPU, NVIDIA Jetson Nano) will be explored.
-
Actuator Control Logic: The current system lacks full automation for controlling actuators such as irrigation and ventilation.Future improvements should ensure that sensor-based actuations (e.g., heating, irrigation) are triggered based on multiple sensor inputs rather than isolated measurements, preventing incorrect responses to environmental changes.
结论
This article presents a novel smart platform for monitoring tomato crops in greenhouses.The platform capitalizes on the strengths of Internet of Things (IoT) and Wireless Sensor Networks (WSNs) to establish a real-time data collection system for crucial environmental factors impacting tomato growth.By integrating image processing and a YOLOv8 deep learning model, the platform offers the ability to automatically detect tomato ripening stages.This empowers farmers with real-time insights for informed decision-making, potentially leading to optimized crop growth, improved yield, and minimized harvest losses.但是,存在局限性。The accuracy of the YOLOv8 model is contingent upon the quality of training data, and its performance might be susceptible to variations in lighting conditions, camera angles, and occlusions within the greenhouse environment.
The YOLOv8 model demonstrated promising performance in detecting and classifying the ripening stages of tomatoes.Quantitatively, the model achieved a mean Average Precision (mAP) of 52.8% at an average recall of 0.478, based on nano model of YOLOv8 for such less number of images in the dataset and an epoch of 25, this is a significant number for initial training and can be improved in future working.The YOLOv8 model demonstrated high accuracy in detecting and classifying the ripeness stages of tomatoes.The instance distribution and bounding box analysis provided insights into the dataset’s characteristics.The training and validation loss curves indicated effective learning, with decreasing loss values over epochs.The confusion matrix further validated the model’s performance, showing high accuracy for most classes.
Additionally, the platform’s effectiveness relies on a dependable internet connection for seamless data transmission to the cloud platform.Future research will explore integrating edge computing solutions to enhance offline processing capabilities.Despite these limitations, the proposed platform presents a significant advancement in greenhouse tomato crop monitoring.Future work can focus on enhancing the robustness of the YOLOv8 model for diverse environmental conditions and incorporating additional sensors (e.g., CO₂, pH, and nutrient monitoring) to create a more comprehensive data set.This will pave the way for the development of even more sophisticated models capable of not only identifying ripe tomatoes but also predicting potential issues and optimizing greenhouse conditions for superior crop management and yield.Machine learning-based predictive models for disease detection and climate forecasting will also be explored.Overall, this smart platform offers a promising approach for sustainable, data-driven, and automated tomato production in greenhouses.
数据可用性
根据合理的要求,可以从通讯作者获得支持本研究发现的数据。
参考
Food and Agriculture Organization of the United Nations.How to feed the world in 2050. (2009).
Mac, T. T. et al.Intelligent agricultural robotic detection system for greenhouse tomato leaf diseases using soft computing techniques and deep learning.科学。代表。 14, 23887.https://doi.org/10.1038/s41598-024-75285-5(2024)。
文章一个 PubMed一个 PubMed Central一个 Google Scholar一个
Dhanaraju, M., Chenniappan, P., Ramalingam, K., Pazhanivelan, S. & Kaliaperumal, R. Smart farming: internet of things (IoT)-Based sustainable agriculture.农业 12(10), 1745.https://doi.org/10.3390/agriculture12101745(2022)。
文章一个 Google Scholar一个
Farooq, M. S., Javid, R., Riaz, S. & Atal, Z. IoT Based Smart Greenhouse Framework and Control Strategies for Sustainable Agriculture, in IEEE Access, vol.10, pp. 99394–99420, (2022).https://doi.org/10.1109/ACCESS.2022.3204066
Hamza Benyezza, M., Bouhedda, R., Kara, S. & Rebouh Smart platform based on IoT and WSN for monitoring and control of a greenhouse in the context of precision agriculture.Internet Things。23, 2542–6605.https://doi.org/10.1016/j.iot.2023.100830(2023)。
文章一个 Google Scholar一个
Contreras-Castillo, J., Guerrero-Ibañez, J. A., Santana-Mancilla, P. C. & Anido-Rifón, L. SAgric-IoT: An IoT-Based Platform and Deep Learning for Greenhouse Monitoring.Applied Sciences, 13(3), 1961. (2023).https://doi.org/10.3390/app13031961
Trigubenko, R., Vinayan, K. & Dataset, L. T.Kaggle, [在线的]。(2024)。可用的:https://www.kaggle.com/datasets/nexuswho/laboro-tomato
Kone, C. T., Hafid, A. & Boushaba, M. Performance Management of IEEE 802.15.4 Wireless Sensor Network for Precision Agriculture, in IEEE Sensors Journal, vol.15,不。10, pp. 5734–5747, Oct. (2015).https://doi.org/10.1109/JSEN.2015.2442259
Service, A. C. E. Greenhouse tomato production,n.d.[在线的]。可用的:https://www.aces.edu/blog/topics/crop-production/greenhouse-tomato-production/
RaspberryPi & Foundation Datasheet of Raspberry Pi 3 Model B+,n.d.[在线的]。可用的:https://datasheets.raspberrypi.com/rpi3/raspberry-pi-3-b-plus-product-brief.pdf
ExpressIf & Systems Datasheet of ESP32 series,n.d.[在线的]。可用的:https://www.espressif.com/sites/default/files/documentation/esp32_datasheet_en.pdf
Patil, K. A. & Kale, N. R. A model for smart agriculture using IoT, 2016 International Conference on Global Trends in Signal Processing, Information Computing and Communication (ICGTSPICC), Jalgaon, India, 2016, pp. 543–545.https://doi.org/10.1109/ICGTSPICC.2016.7955360
Jawad, H. M., Nordin, R., Gharghan, S. K., Jawad, A. M. & Ismail, M. Energy-Efficient wireless sensor networks for precision agriculture.Rev. Sens. 17(8), 1781.https://doi.org/10.3390/s17081781(2017)。
文章一个 ADS一个 Google Scholar一个
Shinde, D. & Siddiqui, N. IOT Based Environment change Monitoring & Controlling in Greenhouse using WSN, International Conference on Information, Communication, Engineering and Technology (ICICET), Pune, India, 2018, pp. 1–5, (2018).https://doi.org/10.1109/ICICET.2018.8533808
Sa, I. et al.Jan., weedNet: Dense Semantic Weed Classification Using Multispectral Images and MAV for Smart Farming, in IEEE Robotics and Automation Letters, vol.3,不。1, pp. 588–595, (2018).https://doi.org/10.1109/LRA.2017.2774979
Mostafa Mehdipour Ghazi, Yanikoglu, B. & Aptoula, E. Plant identification using deep neural networks via optimization of transfer learning parameters, Neurocomputing.
Volume Pages 228–235, ISSN 0925–2312, (2017).https://doi.org/10.1016/j.neucom.2017.01.018
Ramcharan, A. et al.Deep learning for Image-Based cassava disease detection.正面。植物。科学。 8, 1852.https://doi.org/10.3389/fpls.2017.01852(2017)。
文章一个 Google Scholar一个
Kamilaris, A., Kartakoullis, A., Francesc, X. & Prenafeta-Boldú A review on the practice of big data analysis in agriculture, Computers and Electronics in Agriculture, Volume 143, Pages 23–37, ISSN 0168–1699, (2017).https://doi.org/10.1016/j.compag.2017.09.037
Pallavi, S., Mallapur, J. D. & Bendigeri, K. Y. Remote sensing and controlling of greenhouse agriculture parameters based on IoT, inInternational Conference on Big Data, IoT and Data Science (BID), Pune, India, 2017, pp. 44–48, Pune, India, 2017, pp. 44–48, (2017).https://doi.org/10.1109/BID.2017.8336571
Cheng-Jun, Z. Research and Implementation of Agricultural Environment Monitoring Based on Internet of Things, inFifth International Conference on Intelligent Systems Design and Engineering申请(ISDEA), Hunan, China, 2014, pp. 748–752, Hunan, China, 2014, pp. 748–752, (2014).https://doi.org/10.1109/ISDEA.2014.170
Shyam, G. K. & Chandrakar, I. A Novel Approach to Edge-Fog-Cloud Based Smart Agriculture, inInternational Conference on New Frontiers in Communication, Automation, Management and Security (ICCAMS), Bangalore, India, 2023, pp. 1–5, Bangalore, India, 2023, pp. 1–5, (2023).https://doi.org/10.1109/ICCAMS60113.2023.10526104
Mohammad, A., Eleyan, D., Eleyan, A. & Bejaoui, T. IoT-Based Plant Disease Detection using Machine Learning: A Systematic Literature Review, inInternational Conference on Smart Applications, Communications and Networking (SmartNets), Harrisonburg, VA, USA, 2024, pp. 1–7, Harrisonburg, VA, USA, 2024, pp. 1–7, (2024).https://doi.org/10.1109/SmartNets61466.2024.10577751
Shirsath, D., Kamble, P., Mane, R., Kolap, A. & More, R. IoT based smart greenhouse automation using arduino.int。J. Innovative Res.计算。科学。技术。 5(2), 234–238 (2017).
Nath, S. D. et al.Design and implementation of an IoT based greenhouse monitoring and controlling system.J. Comput。科学。技术。螺柱。 3(1), 01–06.https://doi.org/10.32996/jcsts.2021.3.1.1(2021)。
文章一个 MathScinet一个 Google Scholar一个
资金
Open access funding provided by Vellore Institute of Technology.
竞争利益
作者没有宣称没有竞争利益。
附加信息
Publisher’s note
关于已发表的地图和机构隶属关系中的管辖权主张,Springer自然仍然是中立的。
权利和权限
开放访问
本文允许以任何媒介或格式的使用,共享,适应,分发和复制允许使用,分享,适应,分发和复制的国际许可,只要您适当地归功于原始作者和来源,就可以提供与创意共享许可证的链接,并指出是否进行了更改。The images or other third party material in this article are included in the article’s Creative Commons licence, unless indicated otherwise in a credit line to the material.If material is not included in the article’s Creative Commons licence and your intended use is not permitted by statutory regulation or exceeds the permitted use, you will need to obtain permission directly from the copyright holder.要查看此许可证的副本,请访问http://creativecommons.org/licenses/by/4.0/。重印和权限
引用本文
Saxena, A., Agarwal, A., Nagrath, B.
等。Deep learning-driven IoT solution for smart tomato farming.Sci代表15 , 31092 (2025).https://doi.org/10.1038/s41598-025-15615-3
已收到:
公认:
出版:
doi:https://doi.org/10.1038/s41598-025-15615-3


