
AI增强大规模粘菌病筛查的快速诊断测试平台
作者:Intharah, Thanapong
介绍
在泰国东北地区和位于湄公河沿岸的其他国家,胆管癌(CCA)仍然是极为普遍的恶性肿瘤。该疾病与发病率和死亡率的重大负担有关。Opisthorchis viverrini的慢性或复发感染是发展CCA的重要危险因素1,,,,2。在这些地区,人们食用原始或部分烹饪的淡水塞普林鱼是早期阶段的O. viverrini感染的主要途径,CCA大多表现出非特异性或无症状症状,仅在临床上出现在疾病晚期的临床意义上3。
Khuntikeo等。4提出了一种筛查方法,可早期诊断CCA。为此,Khon Kaen大学与国家卫生安全办公室(NHSO)和泰国公共卫生部合作建立了胆管癌筛查和护理计划(CASCAP)。这些组织已经实施了一项政策,以增强泰国东北地区CCA患者的系统诊断和治疗。泰国东北地区的经历尤其严重的粘菌病患病率,感染率在某些省份的20%至70%不等,使其成为全球受影响最大的地区之一,因此是筛查干预措施的关键目标。
目前,超声检查5,,,,6是筛查胆道系统疾病的标准方法。Chamadol等。7建立了一种称为CASCAP MD KKU解决方案的远程文化系统,旨在评估大量的放射学图像。在线咨询有助于缺乏经验的医学工作者分析超声检查结果。尽管超声检查很容易访问,但全科医生(GPS)或超声检查员通常需要经验丰富的放射科医生的第二意见来分析。Intharah等。7最近,开发了一种名为Bilariy Tract网络(BITNET)的混合深神经网络模型,用于分析超声图像中胆道异常。Bitnet是第一个可以用于筛选和有助于从超声图像诊断人类胆道的超声图像分析模型。该模型旨在通过两种方式帮助。首先,将超声图像作为正常或异常有助于减少放射学家的工作量。其次,使用辅助工具,GPS和放射科医生可以从人类胆道的超声图像中诊断出异常。
除了超声检查外,对感染OV感染的个体的检测证明了在感染普遍存在的地方迅速筛查处于风险的人的潜力。Worasith等。8使用免疫色谱法开发了一种基于尿液抗原的快速诊断测试(RDT),以简化诊断和现场应用,以监视和控制粘菌病。OV-RDT测试具有较高的潜力,是筛查和评估粘菌病的治疗结果的新工具。OV-RDT的使用易用性和成本效益可能有助于大规模筛查Opisthorchiasis。但是,对感染强度的解释依赖于测试线(t频段)上颜色变化的视觉评估,这可能导致不同评估者之间的不一致,尤其是在大规模或护理点测试期间。为了解决这种可变性,利用可以帮助结果解释的人工智能(AI)等技术将是非常有益的。这项工作的主要目的是创建一个AI-OVRDT系统,该系统可以帮助阅读和解释OV-RDT的结果以及有关Opisthorchiasis的大规模筛查的结果。
在这项工作中,我们介绍了OV-RDT平台,这是一种结合人工智能,云计算和移动技术的综合解决方案,以彻底改变大规模的Opisthorchiasis筛选活动。我们的贡献包括基于有效网络B5体系结构的强大深度学习模型的开发,用于对OV-RDT结果的标准化解释,在检测OV感染状态时达到了95%的准确性。此外,我们实施了一种基于AI的质量控制算法,以确保最佳的快速诊断测试带图像捕获和标准化。我们实施了可扩展的基于云的基础架构,该基础架构可以从多个筛选地点进行有效的数据收集,存储和处理,从而为泰国东北部的100,000多名参与者提供支持。该平台为Android和iOS平台提供了用户友好的移动应用程序,可确保医疗保健工人的广泛可访问性,用户满意度超过5.00的4.40,我们还集成了一个智能仪表板,该智能仪表板整合了实时分析和可视化数据的可视化数据,从而实现了基于循证数据的公共健康介入的决策。通过在泰国东北部的地方性地区进行广泛的现场测试以及对医疗保健专业人员的验证,我们证明了平台在标准化结果解释和促进大规模的Opisthorchiasis筛查活动方面的有效性。
本文的其余部分如下组织。相关的工作探索了使用医学图像诊断疾病的AI技术,并审查了使用信息和通信技术(ICT)进行大规模筛查运动的当前状态。“大规模粘菌病筛查运动”部分介绍了大规模的Opisthorchiasis筛查活动及其实施。AI部分详细介绍了我们平台的AI组件,包括数据集准备,两个关键子系统(图像质量控制和OV-RDT分级)及其评估指标和结果。“具有基于云的处理的AI模型实施”部分描述了移动应用程序开发和可用性测试结果。“数据管道处理”部分描述了数据处理服务器体系结构和实现,包括数据库基础架构和数据处理机制。数据处理服务器在“数据管道处理”部分中描述。仪表板``仪表板''详细介绍了仪表板开发的三个主要组成部分:概述指标,地理空间可视化和OV-RDT应用程序Insight。“ OV-RDT平台”部分介绍了OV-RDT平台体系结构,并讨论了在泰国东北部进行的五项主要筛选活动,并证明了该系统在现实世界应用中的有效性。最后,我们总结了我们的贡献,并讨论了自动化的Opisthorchiasis筛查中未来的研究方向。相关作品
与当前工作相关的大量相关工作可以主题为两个主要主题。
1。
-
AI诊断疾病的技术。
2。
-
使用信息通信技术(ICT)来扩展质量筛查。
使用医学图像诊断疾病的AI技术
基于AI的疾病诊断的最新进展主要由深度学习,尤其是卷积神经网络(CNN)驱动。
值得注意的应用包括Bellemo等。9在赞比亚的研究,利用VGGNET和残留神经网络体系结构集合来检测具有临床可接受性能的糖尿病性视网膜病变。同样,Cai等。10使用标准的内窥镜成像,使用8层CNN开发了一种计算机辅助检测系统,以准确地鉴定出早期食管鳞状细胞癌,从而显着提高诊断精度从81.70%提高到91.10%,并从74.20%到89.20%的敏感性。几项研究表明,转移学习和预训练的CNN模型在医学图像分析中的有效性。例如,Chowdhury等人。11使用预先训练的CNN模型从胸部X射线射线检测COVID-19肺炎,达到超过97.00%的精度。同样,Mei等人。12基于CNN的胸部CT分析具有临床症状和实验室数据,可快速诊断CoVID-19患者,在92.00%的曲线下达到了一个区域。
除了基于图像的诊断外,AI还通过语音和语音分析显示了疾病检测的希望。研究人员开发了深度学习模型,可以通过语音生物标志物检测各种条件。例如,Kaufman等人。13证明机器学习模型可以根据语音样本鉴定具有70.00%精度的2型糖尿病,分析诸如音高强度和节奏之类的功能。他们使用智能手机录制的语音段,发现糖尿病和非糖尿病个体之间的声音差异明显,诸如女性的音调变化以及男性的语音强度等特征是关键指标。同样,Almaghrabi等。14回顾了生物声学特征如何检测抑郁症,研究通过分析语音特征(如音高,响度和声音扰动)来实现80.00-87.00%的精确率。
在更广泛的计算机视觉领域,CNN彻底改变了对象检测和图像质量评估。例如,他等人。15引入了Resnet,通过引入可培训更深层次的网络的残留连接,可以在对象检测任务上实现突破性的性能。在这项工作的基础上,Lin等人。16开发的特征金字塔网络(FPN)可显着改善不同尺度的对象的检测。在图像质量评估中,预先训练的CNN模型在评估图像降解和伪影方面表现出显着的功能。Madhusudana等。17证明,使用对比度学习训练的深度学习模型可以在评估图像质量方面的最先进方法,即使不需要大型标签数据集,就可以实现竞争性能。他们的基础框架在使用自学的学习方法检测图像质量状态方面达到了95.00%的准确性。相比之下,我们提出的OV-RDT平台采用更具针对性的方法来图像质量评估,使用Yolov5M模型来检测和验证预定义相机模板中OV-Rapid测试套件的精确定位。该方法通过专门针对适当的测试套件放置和捕获条件,而不是评估一般图像质量特征,从而达到了98.00%的图像质量估计。我们的质量控制算法通过验证检测到的测试套件边界框的位置,可确保图像符合所需的标准,以确定预定的坐标,并且可接受的误差余量为3.00%。
在COVID-19的背景下,计算机视觉方法的重点是有效,准确的条带检测和解释。Mendels等。18开发了一种基于CNN的轻巧系统,可在11种不同的RDT模型中达到99.30%的精度,表明相对简单的卷积体系结构可以有效地处理横向流程测试的结构化性质。同样,Lee等人。19引入了Smartai-LFA,这是一种基于智能手机的深度学习辅助横向流量测定法(LFA),用于诊断Covid-19,利用来自LFA测试套件的图像来解决由人类解释错误引起的自我测试的低准确性。他们评估了七个框架:Densenet-121,Densenet-161,Resnet-18,Resnet-34,Resnet-50,MobilenetV2和Squeezenet。RMSE值显示Resnet-18和Resnet-50是最有效的模型,Resnet-50显示出卓越的性能。但是,由于使用更深层模型的计算时间较长,因此选择了RESNET-18。CNN两步模型集成了Yolov3以进行对象检测和RESNET-18进行分类,在各种智能手机中达到了98%的精度,表现优于未经培训的用户和人类专家,尤其是在低效率的情况下,在低端案例中,准确性保持在99%以上。如Arumugam等人所证明的。20,有效的CNN体系结构很少,可以在保持低计算开销的同时实现稳健的性能,使其非常适合诸如护理点测试之类的资源受限设置。这符合需要快速,可靠和可访问的测试解决方案,这些解决方案可以在标准移动设备上运行而无需专门的硬件。在Bermejo-Pelâez等人的工作中,这一原理被举例说明了。21开发了一个基于智能手机的AI平台来解释和报告SARS-COV-2快速诊断测试(RDTS)。该系统使用Mobilenetv2分析了通过移动应用程序捕获的侧向流免疫测定的标准化图像。该模型在疗养院和医院急诊室中得到了验证,具有高精度,具有100%的敏感性和94.4%的IGG检测性,并正确识别了所有抗原测试。通过将AI驱动的分析与基于云的监测整合在一起,该解决方案可以增强诊断可靠性和流行病学监视,尤其是在低资源环境中。
对于胆管癌(CCA)筛查,Intharah等。7开发的Bitnet是一种混合深卷积神经网络模型,专为分析人类胆道的超声图像而设计。该模型具有双重目的:作为一种自动筛选工具,可以通过将图像准确地将图像分类为正常或异常来减少放射科医生的工作量,并作为一种辅助工具,可以增强经验水平不同的医疗保健专业人员的诊断性能。比特网的结构结合了EfficityNet和Densenet的优势,结合了残留的连接和致密的块,以有效捕获复杂的胆道特征。在验证研究中,BitNet通过将放射科医生的工作量减少35.00%,同时保持出色的较低的假阴性率仅为455张图像中的1个。更重要的是,当用作辅助工具时,它显着提高了医疗保健专业人员的诊断准确性和精度,平均准确性从50.00%提高到74.00%。在泰国东北部等地区,CCA提出了重大的公共卫生挑战和通过超声检查的早期发现是改善患者结果的关键策略,诊断能力的这种提高尤为重要。
在我们的工作中,我们通过提出OV-RDT平台来扩展医学AI的这些进展,这是大规模粘菌病筛查的全面解决方案,将有效的CNN体系结构与云计算基础结构相结合。类似于比特丝7在CCA检测中,我们的系统既用作自动筛选工具,又是临床决策支持系统。但是,虽然Bitnet专注于复杂的超声图像分析,但我们采用了类似于Covid-19 RDT系统的更简化的方法18,,,,19,,,,20,利用有效网络b5体系结构进行RDT解释的相对结构化任务。我们的系统在检测OV感染状态时达到了95.00%的精度,与Covid-19 RDT系统中的高精度相当,同时保持移动部署的计算效率。像Mendels等人一样。18,我们强调图像捕获中的质量控制,并包含一个单独的图像质量评估模块,以确保可靠的结果。该平台的基于云的基础架构可以跨多个筛选地点进行实时数据收集和分析,从而支持泰国东北部的100,000多名参与者 - 类似于Bellemo等人的成功筛查计划的量表。9糖尿病性视网膜病检测系统。具有可扩展基础架构的有效AI模型的这种整合代表了寄生感染筛查能力的重大进步,尤其是对粘菌病和随后的CCA带来重大公共健康挑战的地区至关重要。
大规模筛查活动的ICT解决方案
Beede等。22提出了用于检测糖尿病眼病的诊所中使用的深度学习系统。在公共卫生部下面运营的拉贾维蒂医院(Rajavithi Hospital)合作,在泰国众多诊所中正在实施一个深度学习系统。这种部署是一项涉及7,600名患者的重要前瞻性研究的一部分。深度学习系统首先在位于Pathum Thani省的三个诊所(即Klong Luang,Nongsue和Lamlukka)中用作研究的一部分。这三个原始地点从2018年12月到2019年5月进行了患者筛查。此后,网站筛查季节结束,新的季节从2019年10月开始。每个诊所在筛查日内看到30至200位患者,他们每月提供两到八天的筛查。AIDR深度学习系统正在泰国的众多诊所与Rajavithi医院合作,Rajavithi医院是泰国公共卫生部的一部分。一种基于深度学习算法的DR评估方法可能会减少护士实时评分,并消除他们将底面照片发送给眼科医生进行评估的必要性。通过清除这种瓶颈,护士可以更快地推荐患者,更快地治疗患者,并筛查和审查更多病例。此外,患者将立即获得结果,使护士可以花更多的时间在糖尿病教育和管理上,最终改善患者的结果。该项目采用AI模型来提高效率并减少等待时间,通过为患者和医护人员提供测试结果。我们的系统还利用AI来缩短进行测试和在相关数据库中的结果和利益相关者中的结果之间的间隔。
Lauritzen等。23引入了筛查过程,重点是在女性中检测乳腺癌。筛查方案涉及使用人工智能(AI)技术来分析乳房X线照片并确定乳腺癌的潜在迹象。这种基于AI的方法旨在帮助放射科医生更有效,准确地解释乳房X线照片。该研究涉及参加竞选活动的丹麦首都地区114,421名69岁的无症状妇女。该技术有可能将放射科医生的工作量减少62.60%。(仅通过AI系统读取114,421次筛选中71,585的乳房X线照片),25.10%(基于AI的筛选,避免了2,107个假阳性筛选中的529个)。在诊所中实施基于AI的阅读方案可以通过减少需要放射科医生解释的乳房X线照片的数量来改善筛查结果,从而提高AI驱动诊断的准确性,加快乳房X线照片的处理以及减少误报和误报。该研究还评估了筛查运动对与乳腺癌检测和医疗保健提供有关的各种因素的更广泛影响。这包括对早期检测率,改善患者结果,成本效益,放射科医生的生产率以及基于筛查结果的医疗资源分配的潜在增强的见解。
Pantanowitz等。24提出了通过开发一种基于AI的高质量AI算法来评估数字化前列腺核心针头活检(CNB)幻灯片并成功将其成功整合到标准临床程序中,提出了用于检测患者前列腺癌的筛查过程。提出的系统在检测CNB中的周围性侵袭,诊断和量化前列腺癌以及有效区分低级和高级肿瘤方面表现出显着的准确性。这项研究报告了Maccabi Healthcare Services的成功开发,外部临床验证以及在以色列的大型医疗保健提供者Maccabi Healthcare Services在临床使用中的部署。这些CNB中约有40.00%被诊断出患有癌症。自2018年3月以来,Maccabi病理研究所使用了基于前列腺算法的工具Galen Prostate(IBEX Medical Analytics)。
Khuntikeo等。25提出了一种旨在早期诊断胆管癌(CCA)的筛查方法。为了促进这一点,Khon Kaen大学与国家卫生保障办公室(NHSO)和泰国公共卫生部合作建立了“胆管癌筛查和护理计划(CASCAP)”。这些组织已经实施了一项旨在增强泰国东北部地区CCA个人的系统诊断和治疗的政策。这项研究的重点是那些对肝氟呈阳性并有患有CCA的风险以及已经被诊断出患有该疾病的人。目的是确保这些小组获得公共卫生专家的适当治疗。这项研究的重点是那些对肝氟呈阳性并有患有CCA的风险以及已经被诊断为CCA的人。目的是确保所有这些小组都从公共卫生专家那里获得适当的治疗。目前,超声检查是筛查胆道系统疾病的标准方法。超声评估基于疾病病理学和粪便样品中的OV卵的密度5,,,,6。该战略旨在为处于危险中的15万个人提供长期筛查和随访,在泰国数量约为2000万。截至2023年9月5日,CASCAP数据库记录了3,604,546个受试者。尽管CASCAP的数字基础架构积累并存储了有价值的数据,但检测过程在很大程度上依赖于手动测试,这是资源密集型的,对可伸缩性提出了挑战。为了应对这些挑战,OVRDT系统从CASCAP中汲取灵感,通过基于云的基础架构数字化和管理数据,从而显着提高可扩展性和易进性。此外,我们的系统还将尖端的AI技术纳入检测层中,以解决CASCAP的疼痛点,该cascap目前限制了其有效扩展的能力。
大规模的Opisthorchiasis筛查活动
除了超声筛选外,还检测感染的个体Opisthorchis viverrini显示出在感染普遍的地区快速识别高危人群的巨大潜力。Worasith等。8开发了一种基于尿液的抗原快速诊断测试(RDT),以简化诊断型粘菌病的诊断,使其适合于疾病监测和控制的现场应用中的护理点测试(POCT)。总体样本人口由101,821个人组成,所有居民来自泰国东北部和北部21个省份的街区。开发了一个AI组件以帮助解释测试结果。OV-RDT平台包括Android/iOS移动应用程序,AI服务器,数据处理服务器和交互式仪表板。OV-RDT移动应用程序专为医疗保健专业人员而设计,以捕获OV-RDT的图像并收集相关数据。
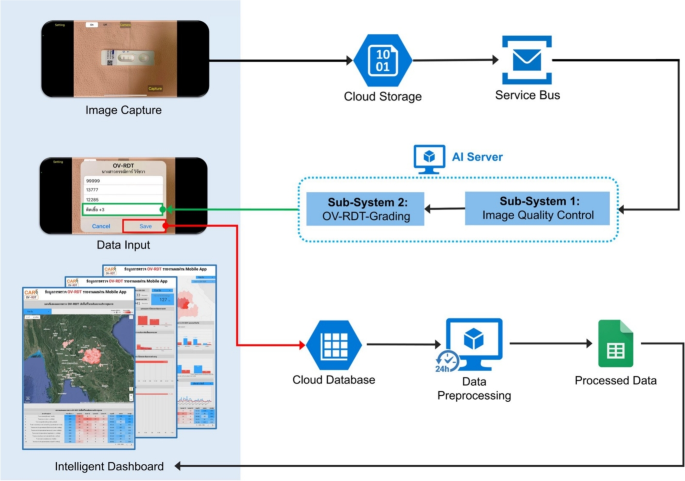
在筛选过程中,AI服务器从服务总线队列中检索任务,以评估输入图像的图像质量控制。一旦图像符合已建立的标准,它就会转发为OV-RDT分级。数据处理服务器生成的报告将筛选数据与患者信息联系起来,然后再将数据发送到云数据库。交互式仪表板处理数据以方便访问和提示使用,从而显示了OV-RDT分级报告和应用程序用法统计信息的汇总信息。OV-RDT移动应用程序可以显着增强结果的解释和在大规模筛查工作中对粘菌病的报告。这种方法允许实时数据处理,并消除了对纸张存储的需求。样品收集和处理的易度性使尿液OV-RDT成为有希望的护理测试(POCT)方法,可促进旨在消除Opisthorchorchiasis的大规模筛查和控制工作。这最终将减少东南亚和下湄公河盆地国家的胆管癌病例(CCA)病例的数量。OV-RDT平台的体系结构概述如图所示。 1。

OV-RDT平台的系统体系结构组成了三个主要组件:(1)用于图像捕获和数据输入的移动应用程序接口,以及具有图像质量控制和OV-RDT分级子系统的AI服务器,用于诊断分析,以及(3)数据处理基础结构,包括云数据库,数据预处理和智能DACRECTINGES,以及(3)数据处理。图中的所有地图最初都是由作者生成的https://cloud.google.com/looker-studio。卫星图像来自Google图像。
道德声明
这项研究是根据赫尔辛基宣布的准则进行的,并由泰国孔·康恩的孔恩·康大学人类伦理委员会批准,该委员会根据泰国国家研究委员会的人类标本实验的伦理学(HE664027; HE664027;批准的日期; 2023年8月30日)。伦理批准HE664027是从主要研究项目编号HE631572的快速审查中获得的。从所有受试者和/或其法定监护人那里获得知情同意。虽然我们仅利用图像数据进行本研究,但所有志愿者的知情同意过程都是通过主要研究项目HE631572进行的。This primary project had already established comprehensive ethical protocols including proper informed consent procedures, data privacy protection measures, and participant anonymity as required by the Human Ethics Committee of Khon Kaen University and in accordance with the Declaration of Helsinki.Confidentiality and data privacy were rigorously upheld throughout the research process to ensure the participant’s well-being and privacy.Furthermore, the survey was conducted anonymously and all data was analyzed anonymously.
AI components
This section delves into the artificial intelligence (AI) components integral to the OV-RDT platform.We describe the dataset used for training and evaluation, while describing two main AI subsystems—1) image quality control and 2) OV-RDT grading.We also explain the evaluation metrics and the experimental design employed to validate the performance of these AI subsystems.Finally, the results, discussion, and effectiveness of the AI implications in improving diagnostic accuracy are presented.
数据集
In this experiment, we utilized a dataset comprising 8,624 OV Rapid Test Kit images, all meticulously collected and annotated by experts to ensure high data quality.The dataset was divided based on a train-test split criterion: 6,900 images were allocated for training the model, while the remaining 1,724 images were reserved for testing.This approach ensured that the model’s performance could be evaluated on a separate, unseen set of images, providing a reliable measure of its generalization capability and accuracy in real-world scenarios.The dataset was collected during the Cholangiocarcinoma Research Institute (CARI) outreach between 18 February and 1 June, 2024. To ensure experimental integrity and prevent data leakage, this train-test split was performed once at the beginning of the study and maintained consistently across all experiments.The test set of 1,724 images was never exposed to any model during training or hyperparameter optimization phases.We named it the OV-RDT classification dataset which only contains good quality strip images.The demographic distribution of the dataset is summarized in Table 1。Additionally, we collected 100 images of OV Rapid Test Kits labelled as failed capture images during the application’s image capture process.These images were specifically used to evaluate the image quality control subsystem.
We also randomly selected 100 successful capture images from the existing OV-RDT Classification dataset.This combination created a balanced dataset, allowing us to thoroughly assess the model’s performance in estimating image quality across various capture conditions.In addition to the main classification dataset, we collected a separate dataset for training the image quality control system.This comprised 574 OV Rapid Test Kit images captured through dedicated data collection sessions designed to include various capture conditions, positioning errors, and lighting scenarios.These images were systematically annotated with bounding boxes for the YOLOv5m object detection model training, ensuring a well-balanced dataset for developing robust quality control capabilities.
AI sub-system 1: image quality control
This AI-based module’s advantage lies in its ability to locate the OV Rapid Test Kit within images collected from the OV-RDT mobile application.The YOLOv5m model was utilized as the baseline architecture for detecting the OV Rapid Test Kit in images.As a medium-sized model within the YOLOv5 family, YOLOv5m is well-regarded for real-time object detection tasks with a good balance of accuracy and speed.For model training, we utilized a dedicated dataset of 574 annotated OV Rapid Test Kit images collected through controlled data collection sessions using our OV-RDT mobile application (both Android and iOS versions) during the early development phase (January-February 2024).This dataset was specifically designed to be well-balanced for machine learning model development, separate from the main OV-RDT classification dataset, ensuring representation of various capture conditions and positioning scenarios.From these 574 images, 479 were used for training, while the remaining 95 images were allocated for validation.All experiments were conducted on a workstation equipped with two NVIDIA GeForce RTX 2080 Ti GPUs.It is important to note that the dataset used for training the YOLOv5m image quality control model (574 images) was completely separate from the OV-RDT grading dataset (8,624 images), ensuring no data leakage between these two subsystems.
The system integrates a verification step known as the quality module, which is described in Algorithm 1. This module verifies the correctness of the test kit’s positioning within the camera template by checking the location of the detected bounding box and comparing it with predefined spatial constraints.If the detected box deviates from the expected location by more than a specified margin, the system prompts the user to retake the image.
The YOLOv5m model was fine-tuned with a specific set of hyperparameters designed to optimize detection accuracy for the OV-RDT domain.The training configuration is detailed as follows:
-
学习率:We utilized an initial learning rate of 0.001 with OneCycleLR scheduling, decreasing to 0.0001 (\(lr0 \times lrf = 0.001 \times 0.1\)) over 400 epochs.A warmup period of 3 epochs was applied with a warmup bias learning rate of 0.1.
-
Batch Normalization:Applied across all layers with a momentum coefficient of 0.937.
-
优化器:The model was optimized using Stochastic Gradient Descent (SGD) with momentum = 0.937 and weight decay = 0.0005, including an initial warmup momentum of 0.8.
-
批量大小:Training was performed with a batch size of 16 using input images resized to 640\(\times\)640 pixels.
-
Augmentation:Various data augmentation techniques were used, including mosaic augmentation (probability = 1.0), random scale transformations (±0.5), translation adjustments (±0.1), and HSV color space modifications (hue ±0.015, saturation ±0.7, value ±0.4).
-
Loss Function:A composite loss function was employed, comprising box loss (gain = 0.05), classification loss (gain = 0.5), and objectness loss (gain = 1.0), with an IoU training threshold of 0.20 and anchor-multiple threshold of 4.0.
This training setup enabled robust and consistent detection of OV test kits across a wide variety of image capture conditions, laying the foundation for reliable downstream grading and classification tasks in the OV-RDT platform.
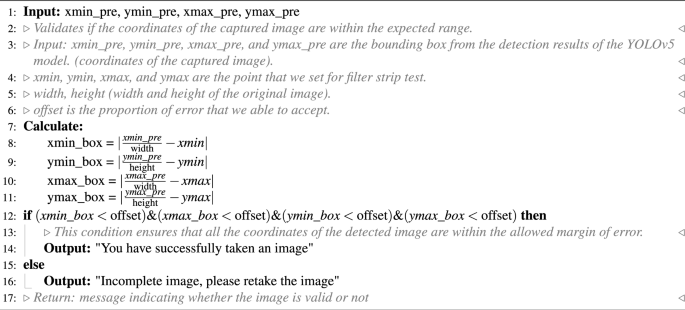
OV-RDT strip image quality control algorithm.
Algorithm 1 requires four parameters:\(xmin\_pre\),,,,\(ymin\_pre\),,,,\(xmax\_pre\)和\(ymax\_pre\)(bounding box).These four parameters represent the bounding box of the detected OV-Rapid test kit.The margin of the bounding box is compared to that of the predefined bounding box characterised by\(xmin = 0.271307\),,,,\(ymin = 0.389985\),,,,\(xmax = 0.780217\)和\(ymax = 0.589000\)。Then, we compute the margin error between the detected bounding box and the predefined one.Images are considered successfully capturedif the margin error is less than or equal to the offset value (\(offset = 0.03\));otherwise, it is classified as a failed capture.The combination of standardized image capture through the camera template and YOLOv5m-based detection creates a robust quality control system.Images with poor quality characteristics such as blur or inadequate lighting naturally fail the detection process, as the YOLO model’s confidence drops below the acceptance threshold in these cases.

The standard OV-RDT color chart for the score based on the band intensity from\(+1\)到\(+4\)was constructed usingOpisthorchis viverrinicrude antigen diluted in clean urine.The color intensity at T was expressed as\(+4\)for the highest intensity and\(+1\)for the lowest intensity, implying lover of infection.
AI sub-system 2: OV-RDT grading
We employed artificial intelligence to predict OV-RDT grading scores ranging from 0 to +4, as illustrated in Fig.2。The grading scores correspond to two diagnostic statuses: Negative (score 0) and Positive (scores +1, +2, +3, or +4).Our experimental dataset comprised 8,624 expert-annotated images of OV Rapid Test Kits, divided into 6,900 training images and 1,724 testing images.All images underwent quality control using YOLOv5m before model training.We evaluated multiple machine learning approaches for both multi-class grading (five levels: 0, +1, +2, +3, +4) and binary classification (Negative vs. Positive).EfficientNet-B5 was selected as the primary deep learning architecture due to its optimal balance between model size and accuracy, making it particularly suitable for mobile deployment.We benchmarked this against other proven architectures, including ResNet5015and MobileNetV226for both classification and regression tasks, providing insights into performance trade-offs across different neural network architectures for OV-RDT interpretation.
Additionally, we implemented traditional machine learning models—Random Forest27and Support Vector Machine (SVM)28for multi-class classification.These models utilised feature vectors derived from red (R), green (G), and blue (B) colour values extracted from the test result area, following the methodology of DentShadeAI29。We specifically focused on the green channel, which provided optimal contrast for T-band detection as shown in Fig.3。Both traditional models were trained using theScikit-Learn包裹30with five-fold cross-validation for hyperparameter optimisation.The five-fold cross-validation for Random Forest and SVM models was conducted exclusively within the training set of 6,900 images, with the test set of 1,724 images held out for final evaluation only.
The EfficientNet-B5 training was conducted using TensorFlow with pre-trained ImageNet weights and executed on a workstation equipped with dual NVIDIA GeForce RTX 2080 Ti GPUs.A two-phase transfer learning strategy was employed: in the first phase, all convolutional layers were frozen and only the classification head was trained for 200 epochs.In the second phase, layers from Block 5 onward were unfrozen and fine-tuned for an additional 200 epochs, allowing the model to adapt to OV-RDT-specific features.A batch size of 16 was used throughout, with RMSProp selected as the optimizer, an initial learning rate of\(2 \times 10^{-5}\), and categorical cross-entropy as the loss function (mean squared error was used in regression experiments).To enhance model generalization and mitigate overfitting, a variety of data augmentation techniques were applied, including random rotation (\(\pm 10^\circ\)), 飞涨 (\(\pm 10\%\)), brightness and contrast shifts (\(\pm 20\%\)), and random cropping and resizing.Horizontal flipping was excluded due to the direction-sensitive layout of the test kits.Regularization techniques included L2 weight decay (\(1\times 10^{-5}\)), dropout (rate = 0.3), early stopping (patience = 15 epochs), and adaptive learning rate reduction viaReduceLROnPlateau(factor = 0.5 after 5 stagnant epochs).On average, training required approximately 12 hours per model.The final model size was approximately 119Â MB, and inference time was around 60Â ms per image, supporting real-time performance on mobile devices.This training pipeline enabled EfficientNet-B5 to deliver high performance across both fine-grained multi-class grading and binary OV infection classification in real-world screening scenarios.While color normalization and stain standardization techniques have shown promise in medical image analysis, we opted to rely on the robustness of pre-trained models and our standardized image capture protocol for this initial implementation.Future work will investigate preprocessing methods specifically tailored to RDT strip analysis to potentially enhance grading accuracy, particularly for cases with subtle T-band intensity differences.
For model interpretability, we implemented GradCAM using the TensorFlow GradCAM library, extracting activation maps from the final convolutional layer (\(top\_conv\)) of our fine-tuned EfficientNet-B5 model.The gradients were computed with respect to the predicted class score, and the resulting heatmaps were resized to match the input image dimensions (224×224) using bilinear interpolation.

An example image when placing the OV-Rapid test kit within a camera template to ensure image quality on both positioning and distance between the strip and the camera.
Evaluation metrics and experimental design
We used a confusion matrix to evaluate the performance of the OV infection classification model.The evaluation was conducted on a test set comprising 1, 724 images, all of which had passed the image quality control step.The confusion matrix is a standard tool for analyzing classification models, providing a detailed breakdown of prediction outcomes by comparing predicted labels with ground-truth annotations.It reports results in terms of four key categories: true positives (TP), where positive cases are correctly identified;true negatives (TN), where negative cases are correctly classified;false positives (FP), where negative cases are incorrectly predicted as positive;and false negatives (FN), where positive cases are missed by the model.This categorization offers insight into not only overall model performance but also the types of errors that occur.
Based on the confusion matrix, we computed four performance metrics: accuracy, precision, recall, and F1-score.Accuracy represents the proportion of correct predictions among all predictions made.Precision measures the proportion of true positives among all predicted positives, reflecting the model’s ability to avoid false alarms.Recall (or sensitivity) indicates the model’s ability to detect actual positive cases, which is particularly critical in medical screening applications where missing a positive case can have serious consequences.The F1-score combines precision and recall into a single metric, providing a balanced measure of the model’s performance, especially in cases where the class distribution is imbalanced.Together, these metrics offer a comprehensive evaluation of the model’s reliability in real-world OV-RDT classification scenarios.
To evaluate the performance of the image quality control module, we used a dataset of 200 OV-RDT images, comprising 100 successful captures and 100 failed ones, as labeled by domain experts.The model’s performance was measured using accuracy, precision, and recall.To further analyze its behavior, we categorized the results into four outcome types.True positive cases refer to instances where the test kit was properly placed within the camera frame and was correctly detected.These images typically featured good lighting, centered alignment, and correct orientation.True negative cases occurred when the test kit was improperly positioned, for example skewed, off-center, or blurred, and the model correctly rejected them.False positives describe cases where the model accepted an image that was not properly positioned, often due to slight misalignment or uneven lighting.False negatives occurred when the test kit was placed correctly but the model failed to detect it, usually because of glare, background interference, or poor contrast.This classification provides insight into the model’s strengths and the types of errors that can arise under real-world image capture conditions.
To establish a robust statistical framework for classification evaluation, we systematically partitioned the test dataset into 30 non-overlapping subsets (n\(\approx\)60 samples per subset) using randomized sampling without replacement.Model performance was quantified across four complementary metrics: accuracy, precision, recall, and F1-score.For each metric, we calculated both the sample mean and standard deviation across all subsets.In accordance with the central limit theorem, we verified that the sampling distributions of performance metrics approximated normal distributions.Homogeneity of variance across the eight methods was confirmed via Levene’s test prior to conducting inferential analyses.We then employed one-way ANOVA to test the null hypothesis of equal mean performance across methods.Where the ANOVA null hypothesis was rejected (p < 0.05), we performed Tukey’s Honest Significant Difference (HSD) post-hoc analysis to identify statistically significant pairwise differences between methods while controlling the familywise error rate.Additionally, we utilized Cohen’s Kappa coefficient to quantify the reliability of our model’s predictions across the spectrum of infection intensity levels and grading status.This chance-corrected measure of agreement is particularly valuable when evaluating a graded classification system such as ours, where test line intensity directly corresponds to OV antigen concentration.Since the visual markers range from weak (1+) for low antigen levels to intense (4+) for high parasite loads, Cohen’s Kappa provides statistical validation of the model’s ability to discern these subtle gradations consistently.This metric offers more clinical relevance than standard accuracy measures alone, as it specifically evaluates the system’s reliability in distinguishing between different degrees of infection severity, which is critical for appropriate treatment planning and epidemiological monitoring.
To assess the clinical implications of model performance, we analyzed the confusion matrix to identify patterns in misclassification, particularly focusing on clinically significant errors (e.g., false negatives in binary classification or misclassification by more than one grade level in multi-class grading).The moderate Kappa score (0.55) for multi-class grading reflects the subjective nature of visual intensity assessment, a known challenge in immunochromatographic test interpretation that our platform addresses through human oversight and adaptive threshold management.
结果与讨论
The EfficientNet-B5 model for image quality control exhibited outstanding performance in assessing image quality.The model achieved accuracy, precision, and recall scores of 98.00%, 95.00%, and 100.00%, respectively, indicating high reliability.An accuracy of 98.00% reveals that the model accurately classified the vast majority of images, while a precision of 95.00% indicates that nearly all images predicted to be of high quality were indeed high quality.The perfect recall score of 100.00% also underscores that the model successfully identified all high-quality images, capturing all relevant cases.The high performance of our quality control approach (98% accuracy) validates that the YOLOv5m model, when combined with our fixed capture template and spatial verification algorithm, provides sufficient quality assurance for downstream classification tasks.This approach effectively filters out images with quality issues including blur, poor lighting, and improper positioning without requiring additional pre-processing steps.The effectiveness of the model is further illustrated in Fig. 4, where examples of true positive, true negative, and false positive images are presented.These examples highlight how the model distinguishes between correctly identified high-quality images (true positives), correctly identified low-quality images (true negatives), and cases where the model mistakenly classified low-quality images as high-quality (false positives).This high level of performance makes the EfficientNet-B5 model an excellent choice for practical applications in automated image quality assessment.

Examples of results from the OV-RDT strip image quality control algorithm: True Positive indicates the examples that the algorithm accurately classify as good quality images, True Negative indicates the examples that the algorithm accurately classify as poor quality images, and False Positive indicates the examples that the algorithm mis-classify as good quality images.

GradCAM visualization showing model attention patterns for OV-RDT grading.Representative heatmaps for each infection grade (0 to +4) demonstrate that the model correctly focuses on the T-band region, with activation intensity correlating with infection severity.Warmer colors (red/yellow) indicate regions of higher importance for the model’s decision.
2presents the experimental results for classification tasks.The sample mean plus/minus standard deviation across eight methods was computed for each performance metric.Since the null hypothesis of the ANOVA test was rejected, the Multiple Comparisons of Means - Tukey HSD analysis was conducted to differentiate the performance across eight state-of-the-art methods statistically.EffNet-B5-based model for regression demonstrated clear statistical superiority over most competing models (p<0.05) based on Tukey HSD analysis.It achieved the highest performance across all metrics (0.66 ± 0.06), significantly outperforming ResNet50 variants, MobileNetV2 variants, SVM, and RF.The significant performance gap between EffNet-B5 R and the other based line models, including ResNet50, MobileNetV2, SVM, and RF, highlight its effectiveness for this complex multi-class problem.The performance pattern changed notably for the simpler OV-RDT status task (binary classification).The proposed EffNet-B5-based models achieved identical top performance (0.95 ± 0.03) with no statistically significant difference (both marked with superscript *).They significantly outperformed all other models, with ResNet50 and MobileNetV2 variants and still delivered strong results.Furthermore, the Kappa scores reveal important insights about model reliability given in Table S1 in the supplementary material.For the more complex grading task (5-class classification), EffNet-B5 R achieves the highest Kappa score (0.55), indicating moderate agreement beyond chance.Despite high accuracy metrics, this moderate score suggests the multi-class task’s challenging nature.For the binary status classification, substantially higher Kappa scores are observed across all models, with EffNet-B5 R leading at 0.83, indicating strong agreement.The consistent pattern of lower Kappa values for traditional machine learning methods (SVM: 0.37/0.49, RF: 0.29/0.34) compared to deep learning approaches confirms that neural network architectures provide more reliable classification performance in both contexts, with EffNet models demonstrating the most consistent reliability across both classification tasks.The details of the ANOVA test and Tukey’s Honest Significant Difference (HSD) post-hoc analysis results can be found in Tables S2-S9 in the supplementary material.
Model interpretability analysis
To enhance the transparency and trustworthiness of our AI system, we implemented Gradient-weighted Class Activation Mapping (GradCAM) to visualize the regions of OV-RDT images that most influence the model’s grading decisions.GradCAM generates visual explanations by examining the gradients flowing into the final convolutional layer of our EfficientNet-B5 model, highlighting the discriminative regions used for classification.
We applied GradCAM analysis to a representative subset of 100 test images across all five grading levels.The resulting heatmaps were overlaid on the original OV-RDT images to identify which spatial regions contributed most significantly to the model’s predictions.As shown in Fig. 5, the GradCAM visualizations demonstrate that our model correctly focuses on the T-band (test line) region when determining infection grades.The intensity of activation in the T-band area progressively increases from grade 0 (negative) through grade +4, corresponding to the visual intensity of the test line itself.
This analysis provides important validation that our model has learned to identify clinically relevant features rather than relying on spurious correlations or image artifacts.The concentrated attention on the T-band region aligns with expert diagnostic practices, where the color intensity of this specific area directly indicates the level of OV antigen present in the urine sample.
AI models implementation with cloud-based processing
Implementing AI diagnostics through a mobile application interface with cloud-based processing offers significant advantages for OV-RDT interpretation in clinical settings.This architecture leverages widely available smartphone cameras for image acquisition while utilizing powerful cloud servers for computationally intensive model execution.Healthcare workers can capture standardized images of rapid diagnostic tests using the mobile application’s guided interface, transmit these securely to cloud infrastructure where the EffNet-B5 R model resides, and receive expert-level interpretations within seconds.This approach eliminates the subjective variability inherent in visual RDT interpretation while maintaining accessibility at the point of care.The mobile-to-cloud implementation creates a sustainable infrastructure for diagnostic AI that balances accessibility with computational power, making sophisticated OV-RDT grading available wherever basic connectivity exists while maintaining the high performance demonstrated by the EffNet-B5 R model in statistical evaluations.
Mobile application development process
The development of the OV-RDT mobile application followed a comprehensive, user-centered approach tailored specifically for diagnostic use in healthcare settings.The process began with thorough requirements gathering from domain experts, including parasitologists, medical technologists, and researchers from the Cholangiocarcinoma Research Institute (CARI) at Khon Kaen University in Thailand.The multidisciplinary collaboration ensured the application would address real clinical needs and align with existing liver fluke infection screening protocols.The development team structured the application around four core functional requirements:
-
Image Capture Aiding: Implementation of a camera template with an AI-based quality validation module to ensure consistent, high-quality images of OV-RDT test kits, critical for accurate analysis.
-
Rapid Data Input and Patient Information Retrieval: Integration of QR-code functionality to efficiently retrieve patient information from hospital databases, streamlining the workflow and reducing manual data entry errors.
-
AI-based Image Grading: Development of an advanced classification system capable of categorizing OV-RDT results into five severity levels, leveraging the cloud-based EffNet-B5 R model identified as optimal through statistical testing.The AI suggestions are presented as default values that healthcare workers can review and modify, ensuring human oversight for borderline cases where automated grading confidence is lower.
-
Epidemiological Analytical Features: Creating a real-time intelligent dashboard displaying both user inputs and AI-generated diagnostic results to support broader public health monitoring and intervention planning.
The application was developed cross-platform for Android and iOS to maximize accessibility and deployed through official channels (Google Play Store and App Store, as shown in Figure6)。Before release, the application underwent rigorous testing on current operating systems (Android 14.0 and iOS 17.4.1) to ensure compatibility and performance.This methodical development process resulted in a comprehensive diagnostic tool that serves individual patient needs and contributes to regional epidemiological surveillance for liver fluke infections.
For usability assessment, the proposed mobile application employed a rigorous cross-sectional methodology conducted during World Cholangiocarcinoma Day in February 2024 at Khon Kaen University, Thailand.The evaluation targeted 50 volunteer expert workers actively involved in liver fluke disease screening, using a structured online questionnaire that measured both satisfaction with the OV-Rapid test kit and the mobile application.The mobile application assessment specifically examined four key dimensions: user satisfaction, expectations for future use, obstacles encountered during application usage, and additional user suggestions.Data was collected using a standardized 5-point Likert scale31ranging from 1 (Dissatisfied) to 5 (Extremely Satisfied), with precisely defined interpretation intervals (e.g., 4.21-5.00 indicating â€Extremely Satisfiedâ€), ensuring consistent evaluation metrics across participants and facilitating quantitative analysis of the user experience among healthcare professionals directly involved in liver fluke screening.

The OV-RDT mobile application.((一个) Application for the Android operating system.((b) Application for the iOS operating system.
Data pipeline processing
AI-based diagnostics leverages Azure Cloud infrastructure to create a comprehensive end-to-end diagnostic pipeline optimized for liver fluke screening.As detailed in Fig.1, the workflow begins when healthcare professionals capture OV-RDT test images through Android and iOS mobile applications.These images are immediately transmitted to Azure Cloud Storage, the secure initial repository for raw diagnostic data.The architecture employs a Service Bus to manage asynchronous communication between system components, directing these images to the AI Server comprised of two critical subsystems: image quality control and the EffNet-B5 R-powered grading model, which classifies infection severity into five levels (0, +1, +2, +3, +4).The backend data integration process, illustrated in Fig.7, shows how the AI-processed results are structured within a sophisticated relational database schema.The system combines three primary data sources: OV screening results with patient information from the mobile application (stored in the OV_results table with a RowKey primary key), healthcare service center data (Health_centers table), and geographical coordinates (citizeninfo_health table).Through table-to-table transformations and joinings using Hospital_ID as a foreign key, the system enriches the diagnostic data with demographic information (patient titles, ages) and creates derived fields like age_intervals and OS_system.For data cleansing, four issues are concerned: data standardization, data range validation, duplicate removal, and data consolidation.The final integrated table is a comprehensive data warehouse that powers the Google Looker Studio-based intelligent dashboard (https://cloud.google.com/looker-studio), enabling epidemiological analysis with complete geographical context.

The data integration process combines data from three import tables into the final table.The final table is used as a data warehouse that feeds data to the interactive dashboard visualization in the next step.
Assessment results
The usability assessment of the OV-RDT mobile application revealed exceptional user satisfaction with an overall mean score of 4.41 (â€Extremely Satisfiedâ€), as shown in Table4, with particularly high ratings for interface design (4.82) and ease of use (4.76).This satisfaction level exceeds even that of the physical OV-Rapid test kit, which scored 4.36 overall in Table3, where users particularly valued the test’s result display duration (4.59) and user-friendly design (4.45) while finding the grading colour chart somewhat less intuitive (3.50) compared to other aspects.From the 39 respondents (78% response rate), 17 mobile application users demonstrated strong confidence in the AI-powered features, especially appreciating the system’s ability to expedite result processing (4.47).However, AI interpretation accuracy scored slightly lower (3.88).
The application’s potential for broader implementation is evidenced in Table5, which reveals overwhelming user confidence in the technology’s future utility—52.9% of respondents indicated they would â€Definitely†use the application in other campaigns and activities.In comparison, an additional 41.2% reported they would â€Most Likely†do so, resulting in a combined positive adoption intention of 94.1%.Notably, not a single respondent selected the â€Probably not†or â€Not†options, underscoring the perceived value and reliability of the AI-assisted diagnostic approach.Despite the overwhelmingly positive reception, respondents provided valuable suggestions for enhancement, including improved image stabilization through tripod support, implementation of familiar camera button functionality, enhanced application stability, and visual positioning guidance.
仪表板
The proposed dashboard was developed and designed to meet the stakeholders’ requirements through a systematic interviewing process.From this process, we identified the key information needed: the number of healthy individuals, infected individuals across levels\(1-4\), app users on iOS and Android platforms, and female and male participants.The preprocessed data is imported into the server using Google Spreadsheets via API to create a data warehouse encompassing relevant dimensions, fields, and tables, all utilized to generate various views.The data is then sliced using filters and parameters stored in the extracted data source and visualized through automated dashboards in Google Looker Studio.This structured approach enables clear, insightful visual representations of the screening campaign’s progress and outcomes.
An automated intelligent dashboard has been developed to support spatial strategic management by analyzing information obtained via the OV-RDT mobile application.We have developed three interactive dashboards: Overview Metrics, Geospatial Visualization, and the OV-RDT mobile application insight.Developing three distinct types of dashboards enables a more versatile and tailored data analysis and presentation approach.Each dashboard serves different purposes or target audiences, providing unique features and functionalities to meet specific needs.This diversity in dashboard options enhances the overall usability and effectiveness of the automated report generation, supporting a spatial strategic management system more efficiently.The data presented on the interactive dashboards in this work encompasses OV screening results from February 15, 2022, to March 20, 2024. The details of each type of dashboard are outlined as follows:
Overview metrics
The metrics analysis dashboard aims to show the overall statistical value of the mass opisthorchiasis screening campaign.The Overview Metrics Dashboard, illustrated in Fig. 8, is described by the following corresponding numbers:
-
Number 1: This represents a scorecard that displays statistical information related to the total OV-RDT data recorded via the OV-RDT mobile application, which is compatible with both Android and iOS operating systems.The scorecard includes (1.1) total participants, (1.2) the number of infected participants, and (1.3) the average age of participants.The health facilities’ code (hopital_ID) can be utilized to search for health services places.
-
Number 2: This section presents a Geo chart illustrating the percentage of liver fluke infection.The result is formatted as a percentage and displayed on a province-segmented map.The intensity of the colors on the map reflects the density of screening participants: darker colors indicate a higher number of infections in a given province, while lighter colors suggest a relatively lower number.This map provides a visual representation of the distribution of infection efforts across provinces, enabling an assessment of regional variations in infection rates for liver fluke screening.
-
Number 3: This refers to a drop-down menu that allows users to control and filter results based on specific provinces using the province field as a control field.
-
Number 4: This refers to a pie chart displaying the percentage distribution of gender among all participants, highlighting the relative proportions of males, females, and unknowns in the screening.
-
Number 5: This represents a bar chart illustrating the number of participants in the screening, categorized by age group.
-
Number 6: This represents a column chart comparing the number of screening participants to the number of individuals diagnosed with liver fluke.The chart is focused on the top five provinces with the highest participant numbers.
-
Number 7: This represents a column chart that compares the number of screening participants to the number of individuals diagnosed with liver fluke.The data is categorized by the top five health facilities with the most participants.
-
Number 8: This represents a line chart displaying the number of screening participants, and the number of individuals diagnosed with liver flukes over time, starting from the commencement of OV-RDT data recording via the OV-RDT mobile application to the present.Additionally, data range control properties are added to allow users to set the date range, enabling the display of data specific to the period of interest.
-
Number 9: This section displays a table providing information on health service centres, sorted in descending order based on the number of participants in the screening.It includes the percentage of people who tested positive for liver flukes, the severity levels (from level 1 to level 4), the average age of participants, and the number of participants categorized by gender.
Geospatial visualization
The geospatial visualization dashboard is designed to display the screening locations of the mass opisthorchiasis screening campaign using interactive maps.The following numbers correspond to the features shown in Fig. 9:
-
Number 1: This geospatial visualization utilizes interactive maps to present the distribution of liver fluke infections across different health service centres at the sub-district level, with larger circles representing more participants at each health service centre and smaller circles indicating fewer participants.The map uses color intensity to represent infection rates, with darker colors indicating a higher percentage of infections and lighter colors suggesting a relatively lower rate of infections and (1.1) The map allows users to zoom in and enlarge the image within a specified area of interest, providing a more detailed view of the selected region.
-
Number 2: This refers to a drop-down menu that allows users to control and filter results based on specific provinces
-
Number 3: This is a tabular representation of OV screening at health service centres at the sub-district level.The table lists health service centres in descending order based on the number of individuals participating in the screening.Each row in the table includes the number of participants who tested positive for liver fluke, categorized into different severity levels (from level 1 to level 4).The table also provides the average age of the participants and the number of inspectors divided by gender.Additionally, users can search for specific health service centres within the table by entering the health service centre code.
OV-RDT application insight
The OV-RDT dashboard designed specifically for developers, also known as “App Insightâ€, focuses on providing detailed insights and analytics related to the performance and usage of the OV-RDT mobile application.图 10shows key components of this dashboard including:
-
Number 1: This is a scorecard that displays statistics on the number of OV-RDT mobile application users across Android and iOS operating systems: (1.1) the number of OV-RDT mobile application users on iOS operating systems and (1.2) the number of OV-RDT mobile application users on Android operating systems.
-
Number2: This is a scorecard showcasing statistics on the number of OV screening data entries recorded through the OV-RDT mobile application on both Android and iOS operating systems, (2.1) the number of collected records from iOS, and (2.2) the number of collected records from Android.
-
Number3: This refers to a drop-down menu that allows users to control and filter results based on specific provinces.
-
Number 4: The scorecard, presents statistics regarding the number of days taken to collect data on OV screenings.
-
Number 5: The statistical data presented on the scorecard, indicates the aggregate number of health service centres that have implemented the screening procedure.
-
Number 6: The scorecard illustrating statistical data on the aggregate quantity of OV-Rapid test kits utilized for screening and the total number of participants across all areas is compiled, (6.1) the total number of OV-Rapid test kits utilized for screening across all areas, and (6.2) the total number of participants across all areas.
-
Number 7: The column chart presents data on the number of negative screening results, stratified by gender.
-
Number 8: The bar chart illustrates the number of participants who tested positive, exhibiting infection levels 1-4, categorized by gender.The gender categories are arranged in descending order based on the number of participants at each infection level.
-
Number 9: The pie chart illustrates the distribution of the five most prevalent urine characteristics identified during the screening process.
-
Number 10: A bar chart depicting the number of participants who tested positive, comparing severity levels categorized by age range.The age ranges are arranged in descending order based on the number of participants who tested negative.
-
Number 11: A bar chart illustrating the number of participants infected with liver fluke, comparing severity levels categorized by age range.The age ranges are arranged in descending order based on the number of participants who tested positive.

Nine parts of the overview metrics page of the data analytic dashboard including of (1) statistical values of (1.1) number of the total participants, (1.2) number of infected participants, and (1.3) the average age of the total participants, (2) infection map with coloring based on the number of infected ones, (3) dropdown list of selected province and (3.1) specified infection status, (4) donut chart for portion of the specified and not specified sexes, (5) bar chart for age intervals of the total participants, (6) bar chart for total participants v.s.infected ones on the top five numbers of total participants, (7) bar chart for total participants v.s.infected ones on the top five number of total participants in healthcare service centres, (8) line chart for number of total v.s.infected participants on the specified time range and (9) statistical table of the total participants, portion of infection, infection level and the average age on each healthcare service centre.The map in the figure is originally generated by the authors throughhttps://cloud.google.com/looker-studio。图9

All maps in the figure are originally generated by the authors throughhttps://cloud.google.com/looker-studio。The satellite image is from Google Imagery.

The OV-RDT insight page of the data analytic dashboard for monitoring mobile application usage including of (1) the number of total mobile application users divided into (1.1) IOS users and (1.2) Android users, (2) the numbers of collected records from IOS and Android applications, (3) the selected province, (4) the number of days, (5) the number of healthcare service centre, (6.1) the number of OV Strip used tests, (6.2) number of participants, (7) the number of normal participants in specified and not specified sexes, (8) the number of strip test results, (9) the pie chart of the portion of five type of urine aspects, (10) the bar chart of the numbers of normal participants divided by five age intervals, and (11) the bar chart of the numbers of infected participants characterized by five age intervals and four levels of infection.
OV-RDT platform
This section provides an overview of the architectural framework of the platform, highlighting the workflow involved in capturing, processing, and analyzing data from the OV-Rapid test kit.Following this, we will present the current state of the screening campaigns, detailing their implementation in northeastern Thailand.
建筑学
The OV-RDT platform supports Android and iOS mobile applications through a system architecture comprising three components: AI server, data processing server, and intelligent dashboard.As shown in Fig. 1, the workflow begins when users capture OV-Rapid test kit images using the camera template in the OV-RDT mobile application.These test kit images are uploaded to the cloud storage, with processing tasks queued in the service bus.The AI server then processes tasks through two subsystems: Image Quality Control, which filters images to meet quality standards, and OV-RDT-Grading, which analyzes and grades filtered images.The system generates grading reports and collects patient information (patient_ID, hospital_ID, user_ID) for storage in the cloud database.Subsequently, the data processing server extracts information from the cloud database for presentation.The intelligent dashboard functions as a monitoring and analysis tool for healthcare professionals.This architecture facilitates mobile diagnostic testing while ensuring data quality, storage, and visualization for clinical decision-making.
Current state
This section delineates five principal campaigns, each characterized by substantial participation within Thailand’s northeastern region.The campaign chronology for 2022 encompasses a single campaign, while 2023 features three distinct campaigns.The year 2024 includes one campaign.This temporal distribution is visually represented in the line chart presented on our dashboard, as depicted in Fig. 11。In a mass screening campaign for OV in Thailand, a total of 101, 821 individuals participated, and 42, 423 (41.70%) tested positive for infection.The average age of participants was 53.60 years.The gender distribution was 60, 487 (59.40%) females, 36, 833 (36.20%) males, and 4, 874 (4.80%) of unknown gender.Most participants, totaling 60, 574 individuals (59.50%), were between 45 and 64 years old, as shown in Table 6。图11A timeline shows the number of input data submitted to the system each day.

Green boxes highlight four mass screening campaigns described in the opisthorchiasis screening section.

A timeline shows the number of input data on the day of mass screening for opisthorchiasis for campaign 1, which is four days.
Mass screening campaign
Use case 1: Mass screening campaign between April 26–29, 2022The event was conducted in Roi-Et Province over four consecutive days.图 12illustrates the temporal progression of participant attendance and infection rates throughout the event, with a total attendance of 3,409 participants.Among these attendees, 1,519 individuals (44.56%) were confirmed positive for infection, participants with a mean age of 55.30 years, as depicted in Fig. 13A. An analysis of the gender distribution among screened participants revealed that 58.40% were female, 40.90% were male, and 0.70% were unidentified, as illustrated in Fig. 13B. Most participants, comprising 2,022 individuals (59.30%), fell within the age range of 45 to 64 years, as demonstrated in Fig. 13C. Notably, this campaign exclusively involved citizens from Roi-Et province, as evidenced in Fig. 13D. The geospatial representation presented in Figure 13E indicates that Selaphum Hospital, located in Selaphum District, Roi Et Province, exhibited the highest level of participation in the screening process, as denoted by the largest circle size.Furthermore, Ban Nong Sim Subdistrict health-promoting hospital, situated in Kaset Wisai District, Roi-Et Province, recorded the highest proportion of infected individuals, with an infection rate of 95.83%, represented by the most intensely red-colored circle on the map.
Use case 2: Mass screening campaign on February 10, 2023This event represents the largest campaign, coinciding with World Cholangiocarcinoma Day (World CCA Day) 2023 at Khon Kaen University in Khon Kaen, Thailand.A total of 6,493 participated in the screening process.Among them, 3,303 individuals, accounting for 51.03%, tested positive for infection.The average age of the participants was 54.70 years, as shown in Fig. 14A. The participants were females 2,219 persons (34.20%), males 1,375 persons (21.20%), and 2,899 persons (44.60%) of unspecified genders, as depicted in Fig. 14B. Most participants were between the ages of 45 and 64, a total of 2,216 persons (34.10%), as illustrated in Fig. 14C. Participants came from five nearby provinces: Khon Kaen, Loei, Nong Khai, Bueng Kan, and Amnat Charoen, as in Fig. 14D. Figure 14E depicts the screening results conducted by health service centres on a geospatial map.The Student Health centre at Khon Kaen University in Mueang Khon Kaen District, Khon Kaen Province, exhibited the highest participation rate, represented by the largest circle size.Furthermore, Khok Samran Sub-district health-promoting hospital in Ban Haed District, Khon Kaen Province, demonstrated the highest proportion of infected individuals at 67.92%, represented by the most intense red color on the map.
Use case 3: Mass screening campaign on July 18, 2023In the Khon Kaen province, the number of participants was 1,604 persons.Among them, 348 persons (21.68%) tested positive for infection, with an average age of 53.60 years, as shown in Fig. 15A. The gender breakdown of those tested was 58.30% female, 40.70% male, and 1.00% unknown, as illustrated in Fig. 15B. The participants mainly consisted of people between 45 and 64 years of age, totaling 971 persons (60.50%), shown in Fig. 15C. Khon Kaen province had the highest number of participants, followed by Kalasin, Bueng Kan, Udon Thani, and Nong Bua Lamphu, respectively, as shown in Fig. 15D. In the geospatial map illustrated in Fig. 15E, Yang Kham Sub-district health-promoting hospital in Nong Ruea District, Khon Kaen Province, demonstrated the highest participation in the screening (largest circle size), and Ban Kho Sub-district health-promoting hospital in Ban Phue District, Udon Thani Province, exhibited the highest proportion of infected individuals at 70.97% (the circle is the reddest).
Use case 4: Mass screening campaign on August 30, 2023In Udon Thani province, out of the 1,207 persons screened, 371 persons (30.74%) tested positive for infection, with an average age of 53, as illustrated in Fig. 16A. The gender distribution revealed 51.50% female, 34.90% male, and 13.60% unknown, as shown in Fig. 16B. Most participants were between 45 and 64 years old, totaling 667 persons (55.30%), as illustrated in Fig. 16C. Udon Thani province recorded the highest participation, with neighboring provinces including Maha Sarakham, Bueng Kan, Nakhon Ratchasima, and Roi Et, respectively, as shown in Fig. 16D. In the geospatial map presented in Fig. 16E, Ban Wiang Kham Sub-district health-promoting hospital in Kumphawapi District, Udon Thani Province, exhibited the highest screening participation (largest circle size).Ban Na Kham Khaen Sub-district health-promoting hospital in Si Wilai District, Bueng Kan Province, demonstrated the highest proportion of infected individuals at 66.40% (the circle is the reddest).
Use case 5: Mass screening campaign on February 18, 2024This event was held in Maha Sarakham Province, where 1,148 participated in the screening.Among them, 326 persons (28.40%) tested positive for infection, with an average age of 52.50 years, as shown in Fig. 17A. The gender ratio of those screened indicated that 81.20% were female, 18.60% were male, and 0.20% could not be identified, as shown in Fig. 17B. Most participants, totaling 841 persons (73.30%), were between 45 and 64, as shown in Fig. 17C. This campaign has participants from citizens only in Maha Sarakham province, as illustrated in Fig. 17D. The geospatial map shown in Fig. 17E, Ban Nong Waeng Sub-district health-promoting hospital in Mueang Maha Sarakham District exhibited the highest participation in the screening (largest circle size).Uthai Thani Community Medical centre in Mueang Maha Sarakham District displayed the highest proportion of infected individuals, at 50.00% (the circle is the reddest).
Thus, the Opisthorchiasis screening campaign is a national initiative aimed at raising awareness about Cholangiocarcinoma (CCA), a severe cancer affecting the bile ducts both inside and outside the liver.This poorly understood disease is increasing in incidence globally.CCA causes several vague symptoms, making it very difficult to diagnose.In some cases, misdiagnosis with other less serious conditions leads to misdiagnosis before receiving the correct diagnosis.After a lengthy and challenging diagnostic process, patients often encounter a disease they are unfamiliar with, which typically has a poor prognosis and limited treatment options.This campaign aims to facilitate a more straightforward diagnostic journey for individuals affected by cholangiocarcinoma, ensuring the process is timely, decisive, and well-supported.

Analysis of mass screening for opisthorchiasis for campaign between April 26-29, 2022. The map in the figure is originally generated by the authors throughhttps://cloud.google.com/looker-studio。The satellite image is from Google Imagery.

Analysis of mass screening for opisthorchiasis for campaign on February 10, 2023. The map in the figure is originally generated by the authors throughhttps://cloud.google.com/looker-studio。The satellite image is from Google Imagery.

Analysis of mass screening for opisthorchiasis for campaign on July 18, 2023. The map in the figure is originally generated by the authors throughhttps://cloud.google.com/looker-studio。The satellite image is from Google Imagery.

Analysis of mass screening for opisthorchiasis for campaign 4 on August 30, 2023. The map in the figure is originally generated by the authors throughhttps://cloud.google.com/looker-studio。The satellite image is from Google Imagery.

Analysis of mass screening for opisthorchiasis for campaign 5 on February 18, 2024. The map in the figure is originally generated by the authors throughhttps://cloud.google.com/looker-studio。The satellite image is from Google Imagery.
讨论和结论
We introduced the OV-RDT platform, a novel system integrating deep learning, cloud computing, and mobile technology for mass opisthorchiasis screening specifically designed for northeastern Thailand, where the disease burden is most severe.The platform’s core EfficientNet-B5-based deep learning architecture achieved 95.00% accuracy in OV infection detection and 98.00% accuracy in image quality assessment within this endemic region.This robust performance enabled large-scale deployment, successfully processing over 100,000 samples across northeastern Thailand.
The distributed architecture effectively addresses scalability challenges through a cloud-based infrastructure supporting real-time data processing and cross-platform mobile applications.The system’s intelligent dashboard provides comprehensive analytics and geospatial visualization capabilities, facilitating evidence-based public health decision-making.Field validation demonstrated significant clinical utility, with healthcare professionals reporting high satisfaction rates (4.41/5.00) in real-world deployments.It is important to note that our platform was developed and validated exclusively in northeastern Thailand, where opisthorchiasis prevalence is exceptionally high and represents a major public health challenge.The unique epidemiological characteristics of this region, including dietary habits and environmental factors, may limit the direct generalizability of our findings to other geographical areas.External validation studies in different endemic regions would be essential before broader deployment of the platform.
While the binary classification task (negative vs. positive) achieved excellent performance (95% accuracy), the multi-class grading task presented greater challenges, achieving 66% accuracy with a Cohen’s Kappa of 0.55, indicating moderate agreement.This performance gap reflects the inherent subjectivity in visual assessment of T-band color intensity, where even expert raters may disagree on borderline cases between adjacent grades (e.g., Level 2 vs. Level 3).
To address these limitations in clinical practice, our platform incorporates two key mitigation strategies:
First, the AI grading suggestions are implemented as default values that healthcare workers can review and modify based on their clinical expertise.This human-in-the-loop design ensures that the AI serves as a decision support tool rather than an autonomous diagnostic system, particularly important for borderline cases where grading uncertainty is highest.
Second, the platform implements server-side threshold adjustment capabilities that allow for dynamic calibration based on batch-specific characteristics or epidemiological requirements.For example, if a particular batch of test strips exhibits systematic variations in color development, thresholds can be adjusted centrally to maintain diagnostic accuracy.This flexibility is particularly valuable in resource-limited settings where test strip quality may vary due to storage conditions or manufacturing differences.
Future research directions should focus on enhancing the system’s distributed computing capabilities, particularly offline functionality for remote areas and integration with existing healthcare information systems.Long-term clinical validation studies are essential to quantify the platform’s impact on early detection rates and treatment outcomes.The expansion of the system throughout Southeast Asia and the Lower Mekong Basin countries presents opportunities for standardizing cross-border screening protocols and implementing advanced security measures through blockchain technology.
Additionally, while the current dashboard visualization provides valuable insights, future iterations should better highlight regional epidemiological trends to support more targeted interventions.Incorporating spatiotemporal analysis that examines infection trends over time and potential seasonal variation effects would make findings more actionable for public health authorities.Furthermore, developing predictive analytics capabilities using AI to forecast future outbreaks based on environmental, demographic, and behavioral data represents a promising direction that could transform the platform from a diagnostic tool to a preventive one.Such forecasting models could leverage the extensive dataset being accumulated to identify high-risk areas before outbreaks occur.Future technical enhancements should also explore image preprocessing techniques such as color normalization and stain standardization, which could reduce the impact of lighting variations and device-specific color rendition on model performance.Such preprocessing methods, successfully applied in digital pathology and other medical imaging domains, may improve the system’s ability to consistently grade T-band intensities across diverse field conditions.Sourcing additional image datasets that are representative of other endemic regions beyond northeastern Thailand, training and validating the generalization performance of the EfficientNet-B5-based model is essential during this expansion.Given that our current validation is limited to northeastern Thailand—the region with the most severe disease burden—comprehensive external validation studies in diverse populations and geographical settings are crucial for establishing the platform’s broader applicability.
The OV-RDT platform demonstrates the potential of AI-driven solutions in public health screening, particularly in standardizing diagnostic processes and eliminating subjective interpretation in immunochromatographic tests.This standardization, combined with automated data collection and analysis, represents a significant advancement in opisthorchiasis screening methodology.The platform’s success in reducing diagnostic variability while maintaining high accuracy could serve as a model for applying machine learning to other neglected tropical diseases.
Continued advancement requires interdisciplinary collaboration between medical professionals, computer scientists, and public health researchers.This cooperation will be crucial in evolving the platform’s capabilities while ensuring its practical application in resource-limited settings, ultimately working toward more effective disease control in endemic regions.The GradCAM analysis presented in this study addresses a critical need for interpretability in medical AI systems.By demonstrating that our model focuses on clinically relevant regions (the T-band), we provide healthcare workers with visual explanations that can enhance trust and facilitate adoption of the technology.This interpretability is particularly important in resource-limited settings where AI systems must be transparent to gain acceptance from medical professionals.The incorporation of GradCAM visualization confirms that our deep learning model makes decisions based on clinically relevant features, providing the transparency necessary for deployment in real-world healthcare settings.
Limitations and clinical implementation considerations
The moderate performance in multi-class grading (66% accuracy) compared to binary classification (95% accuracy) represents a key limitation that must be considered in clinical deployment.This performance gap primarily stems from the subjective nature of visual intensity grading, where inter-rater variability exists even among experts.However, our platform’s design specifically addresses this limitation through:
-
1. Human-in-the-loop verification, where AI suggestions serve as initial assessments that healthcare workers can validate or adjust based on clinical context
-
2. Adaptive threshold management at the server level, enabling real-time calibration based on batch-specific variations or changing epidemiological requirements
-
3. Continuous model improvement through accumulation of expert-verified labels from field deployments
Future work should focus on collecting larger datasets with multiple expert annotations to better capture the inherent variability in visual grading, potentially implementing ensemble methods or uncertainty quantification to flag cases requiring additional human review.Additionally, investigating alternative biomarkers or test formats that provide more objective quantification could further enhance the reliability of infection intensity assessment.