
基于AI的预测模型为接受结直肠癌手术的患者的决策支持模型
作者:Gögenur, Ismail
主要的
尽管在过去的几十年中,手术技术和围手术期护理方面的进步,术后发病率和死亡率代表了全球手术中常见的治疗挑战1。几项研究表明,在手术周围的时期有针对性的干预措施降低了术后发病率2,,,,3,,,,4。但是,由于医疗保健人员之间的资源限制以及缺乏可靠的风险评估工具,可以识别有可能从干预措施中受益的患者,因此在临床实践中选择患者是临床实践中的普遍挑战。为了进一步提高精度医学,想要为患者的不良结果风险进行个性化评估的决策工具,这可以使能够为每个患者独特的表型量身定制的有针对性治疗,并可能导致更有效的医疗保健资源分配。近年来,已经开发了几种使用人工智能(AI)技术的预测工具5。这些模型旨在处理大量数据并分析复杂模式,具有对患者风险进行以患者为中心和整体评估的潜力。它还为医疗保健数据访问,数据隐私,有关跨注册机构的数据共享的监管问题,预先存在电子健康记录(EHRS)的整合(EHRS)以及最重要的是临床利益的证明。最后,在开发AI解决方案时,可扩展性对于确保可以在临床环境中有效扩展和实施解决方案至关重要。尽管存在许多针对围手术期和术后死亡率的预测模型,但仍需要整合到现实世界中的临床工作流程中,以便在护理点上实现个性化的围手术治疗决策。在国家注册表数据上验证并在现实世界中进行了测试的模型的逐步实施将有助于临床可用性和可扩展性。因此,在这项研究中,我们设计,开发,实施和评估了AI支持的决策支持工具以及个性化的围手术期治疗捆绑包,建立了实施个性化治疗策略的逐步方法。第一步,我们使用注册表数据来研究与术后不良结果相关的各种风险因素之间的关系,并定义了临床上相关的预测结果。在第二步中,我们开发了并验证了基于AI的预测模型。在第三步中,我们使用预测模型作为治疗患者治疗的外科医生的决策支持工具,对计划进行选择性治疗预期手术的患者实施了个性化的临床护理。最后,在第四步中,我们评估了临床结果,并建立了实施拟议的个性化围手术治疗的成本效益。
结果
研究队列的基线特征
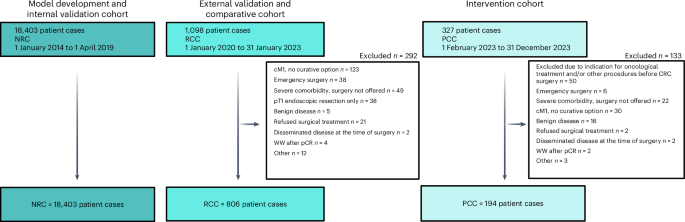
基于国家注册表的同类队列(NRC)在2014年1月1日至2019年4月1日之间的选择性环境中,来自四个国家注册表数据库中的数据库中的数据库中的18,403例患者进行了治疗性手术。这些数据用于确定有关临床临床疲劳,模型开发和内部验证的主要挑战。回顾性临床队列(RCC)由806例患者组成,他们在2020年1月1日至2022年12月31日在一个中心接受了手术,并作为该模型外部验证的数据源,并作为临床结果的比较队列。在临床实践中实施了AI预测模型后,前瞻性临床队列(PCC)由2023年2月1日至2023年12月31日接受手术的194例患者组成,并代表接受了个性化围手术治疗治疗的患者。数字1代表研究流程图。数字2说明研究设计。

全国性DCCG数据库包括2014年1月1日至2019年4月1日在2014年1月1日至4月1日之间诊断为CRC的所有患者的信息,它充当了NRC的数据源,并充满了DNPR,DPR和RLRR的数据。RCC包括在2020年1月1日至2023年1月31日之间在西兰大学医院接受CRC手术的患者。在2023年2月1日至2023年12月1日之间,PCC包括在西里兰大学医院接受治疗的患者。CM1,临床M1类别;PT1,病理T1类别;PCR,病理完全反应;WW,观看并等待。使用biorender.com,,,,https://biorender.com/7dmw4xt。图2:研究设计概述。

,DCCG数据库用于基于问题的学习,其中探索了几种危险因素与死亡率之间的关系,并定义了预测模型的结果。b,全国注册表数据被协调到OMOP CDM中,并用于模型开发和内部验证。c,在接受预测模型的医院接受治愈性手术的患者的回顾性临床队列被用于外部验证模型性能。同时,定义了基于预测的1年死亡率的临床风险群体(a,1%; b,> 1%至1%至5%; c,> 5%至15%至15%; d; d,> 15%),随后是针对每个风险群体的风险群,以增加风险群体的风险群体,以增加风险群体的风险较高的风险群体,以增加互动的风险。d,2023年2月1日实施了一种新的局部治疗范式,该范例针对计划进行选择性治疗的CRC手术的患者,包括使用临床预测模型作为临床医生的决策支持工具,以使患者风险分层患者并将患者推荐适当的围手术期优化套件。使用biorender.com,,,,https://biorender.com/jttmuq3。基于问题的学习
To investigate the potential need for multidimensional risk assessment, the association between 1-year survival and the Charlson comorbidity index (CC-index—a marker for the burden of comorbidity), the WHO performance status (WHO PS—a marker for general health status and activities of daily living), the Union for International Cancer Control stage (UICC stage—a marker for the anatomically extend of the oncological disease) and age were investigated in the NRC.
较高的CC索引,PS,UICC阶段和年龄都与较短的生存有关。所有预后因素都通过包括术后并发症进行进一步分层,术后并发症与在PS,UICC阶段或年龄的CC-Index上较短的生存率相关联(图。3aâd)。尽管每个预后因素可以根据风险对患者进行分层,但风险组之间的相关性较差至中度,而Spearman的相关系数范围为0.03至0.29(图。3e)。发现存在几个不高度相关的预后因素,并且可以在术前已知或估计,这支持了以下想法:与单维风险评估工具相比,术前风险评估可以更好地捕获术后死亡率的可变性。

d,Kaplan Meier曲线术后为1年的术后死亡率针对接受选修治疗的手术的患者,通过患者在手术后的前30天中是否患有术后30天的术后并发症分层,以不同:年龄组(年龄组)(年龄组)(一个),cc-index(b),ps(c)和UICC阶段(d)。e,每个因素与术后并发症的发展之间的相关矩阵分级为2或更高的CD和Spearman的Rho在每个因素之间。开发和验证1年死亡率预测模型
在模型开发过程中,最初将8,694个协变量确定为潜在的协变量。
通过混合数据驱动的临床监督选择,包括68个候选协变量进行模型训练,其中58个包括在最终模型中。协变量和回归系数总结在补充表中1和2。系数为0的协变量不影响模型输出,并从最终模型中删除。可以使用逻辑功能估算给定患者的1年死亡率的预测概率:\(\ frac {1} {1+{{e}}}^{ - {x}}}}} \)\), 在哪里x是随附的协变量和回归系数的成对产物和截距的总和。该模型作为二进制分类器的性能总结了。4a。歧视指标显示,模型开发集中的接收器操作特征(ROC)(ROC)(ROC)(AUROC)为0.82(95%置信区间(CI),0.81 0.84),与AUROC相比,AUROC(95%CI,0.74 -0.80)的内部验证设置为0.79(95%CI,0.74â0.80)。4b)。所选阈值的灵敏度分别为0.40(95%CI,0.36 - 0.44),0.32(0.27 -0.38)和0.50(0.34°0.65),分别用于模型开发,内部验证和外部验证集。模型校准被评估为观察到的与预期事件的数量,显示了开发集和内部验证集的接近理想点估计值。数字4C显示了模型开发集和内部验证集的校准曲线,说明了使用本地估计的散点图平滑的观察到的(滚动平均)与预测(滚动平均)风险。两条曲线都表明,该模型在较低的预测风险下进行了很好的校准。但是,在观察到的风险更高的情况下,该模型倾向于预测过度预测,即预测的概率高于观察到的事件比例。基于开发集,在预测风险超过40%之后,该模型开始预测过度预测,而基于内部验证集,该模型在预测风险超过10%之后开始过度预测。由于结果不足,未研究外部验证集的校准曲线。为了进行研究,模型校准是令人满意的,因为预测模型仅用于支持患者的临床医生分层为围手术期优化束,而过度治疗被认为是安全的。对于预测的风险在10%到15%之间的患者来说,略有预测可能会导致某些患者被建议向更高的风险组建议,即更密集的围手术期优化,这在临床上是可以接受的,而预测超过15%的过度预测不会影响建议的风险组。使用Brier得分研究了整体模型拟合,该分数为0.043(95%CI,0.040 0.046),0.046(95%CI,0.041,0.041(0.041)和0.044(95%CI,0.034 -0.034â0056),用于模型开发集,内部验证集,内部验证集,内部验证集和外部验证,以及外部验证。

,整个开发,内部验证和外部验证的拟合度,歧视和校准的指标与95%CIS共同设置。对于负预测值(NPV),正预测值(PPV),灵敏度和特异性,使用0.15的阈值将预测分类为事件。b,用于开发,内部验证和外部验证集的ROC曲线。数据表示为估计曲线,具有代表95%CI的误差频段。c,用于开发和内部验证集的校准曲线。数据表示为估计曲线,具有代表95%CI的误差频段。d,在整个开发中的发病率比例和术后事件的总数n= 13,803),内部验证(n= 4,600)和外部验证(Nâ=â806)集,由风险组A(预测的1年死亡率的预测风险)分层,B(预测1年死亡率> 1至1至1至5%),C(预测的1年死亡率> 1年的死亡率> 5至5至15%的DISPIDERS DIST(预测)和1年的风险为1年。术后事件包括1年死亡率,手术后30天内按CD 2或更高的医疗并发症以及手术并发症在手术后30天内分级为CD 3A或以上。数据表示为每个风险组的事件比例,误差线代表95%CI。
风险组的临床相关性
根据预测的1年死亡率为1%,> 1%至1%至5%,> 5%,> 5%至15%或> 15%,定义了四个临床风险组(A,B,C和D)。数字4d显示了以Clavien-Dindo(CD)为单位的30天内的医疗并发症的发生率比例为2日元,在手术后的30天内将手术并发症在手术后的30天内和死亡率内分级,并在模型开发,内部验证和外部验证集后的1年内按预测的风险组进行了分层。该图显示了在所有评估集中观察到的所有结果的发生率的单调增加,除了外部验证集中的手术并发症外,在组B组中观察到的并发症的比例较少。对于所有评估集和风险组,观察到的1年死亡率事件率在风险组设定的边界内。但是,在外部验证集中,组之间经常重叠95%的顺式,医疗并发症的事件率较高,表明与基于注册表的数据注册实践相比,图表审查中事件的系统性更高,这与寄存器的验证一致6。
实施个性化围手术治疗之前和之后的临床结果
对于RCC和PCC,1年死亡率的平均预测风险为3.24%和3.68%(W统计w)= 77,836;p= 0.924),而风险组分层的平均预测风险为0.66%,A组为0.68%(w= 1,986;p= 0.316),组为2.41%,为2.56%(w= 19,924;p= 0.294),组为8.17%vy 8.78%(Cw= 6,130;p= 0.652)和22.5%的d(组为18.6%)w= 356;p= 0.196)。尽管发现临床队列与预测的风险之间没有统计学上的显着关联,但临床群体在统计上与分配风险组相关,其中131(16.3%),373(46.3%),207(25.7%),95(11.8%)和95(11.8%)(11.8%)患者分配了RCC,而RCC则为100(13%),而分配为13(13(13),13(13(13),13(13(13)(13(13)(13),13(13)(13)。PCC中的57(29.4%)和10(5.2%)(5.2%)( -2= 8.818;d.f. = 3;p= 0.032)。尽管该模型建议的风险组与临床医生选择的风险群体之间的总体一致很高(κ= 0.926),根据决策支持工具提出的建议调整了9例(4.6%)病例:一名被视为A组的患者被视为B组,预测为B组的四名患者被视为C组为C组,一组被视为A组,两名患者被视为C组为B组B,并且被视为B组B,并且被治疗为组。除PCC外,所有研究队列的一年死亡率均为5.2%,在PCC仍在进行后续行动,因此未报告。患者人口统计总结在表中1。
全面的并发症指数
PCC中综合并发症指数(CCI)的发病率比例为19.1%,而RCC为28%;发病率比例如图2所示。5a(左边)。单变量的逻辑回归表明,个性化的围手术期治疗与CCI> 20的几率明显低于护理标准(优势比(OR)= 0.60; 95%CI,0.40 0.88;p= 0.011)。此外,与风险组相比,CCI> 20的风险组的几率明显更高(或1.76; 95%CI,1.12 2.81;p= 0.015和OR = 2.53;95%CI,1.47 4.38;p分别<0.001)。在多变量逻辑回归中调整了风险组后,发现与护理标准相比,个性化围手术期治疗的关联相似(OR = 0.63; 95%CI,0.42 0.92;p= 0.02)。结果总结在图2中。5a(正确的)。

d,发病率比例(左)和单变量和多元回归分析的结果使用逻辑回归或CCI> 20(右)的逻辑回归或负二项式回归的结果(20)一个),医疗并发症的发病率比例(b),术后并发症数量的IR(c)和术后再入院次数的IR(d)用于PPC(实施个性化围手术治疗后)和RCC(对照),由风险组A,B,C和D分层,整体整体。回归模型包括治疗,风险组或两者都是自变量与结果。模型系数表示为逻辑回归的ORS或负二项式回归的IRS,以及95%CI和相关的双面p基于WALD的测试的值,而无需调整多次比较。PPT,个性化的围手术期治疗。
术后医学并发症
PCC的发病率比例为23.7%,而RCC的发病率为37.3%。如图。5b(左)显示了医疗并发症的发病率比例。在单变量的逻辑回归中,与个性化的围手术期治疗相比,标准护理的医疗并发症的几率明显更高(OR = 0.52; 95%CI,0.36 0.74;p<<0.001)。此外,与风险组A相比,风险组C和D的治疗并发症的几率更高(OR = 2.36; 95%CI,1.53 3.70;p<0.001和or = 3.34;95%CI,1.98 5.71;p分别<0.001)。调整了风险组后,在多变量逻辑回归中发现了个性化的围手术期治疗与护理标准之间的相似关联(OR = 0.53; 95%CI,0.36 0.76;p<<0.001)。结果总结在图2中。5b(正确的)。
术后并发症的计数
术后并发症的发病率(IR)为90天的0.48,而在RCC中为90天的0.76;如图。5C(左)显示了前90天的术后并发症的平均数量。在单变量负二项式回归模型中,与对照相比(IR比(IRR)0.63; 95%CI,0.48 0.83相比,个性化的围手术治疗与IR较低有关;p= 0.001)。与风险组A相比,这两个风险组C和D都与IR较高(IRRA = 1.97; 95%CI,1.42 2.75相比;p<0.001和Irrâ= 2.63;95%CI,1.80 3.88;p分别<0.001)。当调整多变量负二项式回归中的风险组时,在个性化的围手术治疗和护理标准之间发现了类似的关联(IRRâ= 0.66; 95%CI,0.50 0.50; 0.87;p= 0.003),结果总结在图2中。5C(正确的)。
再入院的计数
平均而言,PCC中的患者在手术后的头90天内有0.2次入院,而RCC的患者在同一时期有0.31个再入院。如图。5d(左)显示了手术后的前90天的平均再入院次数。个性化的围手术期治疗在统计学上与单变量负二项式回归模型中的再入院数量显着相关(IRRâ= 0.64; 95%CI,0.43 0.95;p= 0.028)。在多变量负二项式回归中控制风险组,产生了类似的IRR和p个性化围手术期治疗与护理标准的价值(IRRâ= 0.66; 95%CI,0.44 0.98;p= 0.041)。结果总结在图2中。5d(正确的)。
成本效益分析
与标准的护理标准相比,使用了一个1年时间范围的混合决策树和马尔可夫州状态过渡模型对AI靶向治疗进行了成本效益分析。在手术后的第一年,每名患者的费用估计为28,006.94美元的护理标准组,而个性化围手术期治疗组的成本估计为25,159.36美元,在手术后的第一年,成本可节省2,847.59美元(2,810.32至2,884.00)。质量调整后的寿命(QALYS)的增量增益估计为每位患者0.020(0.020 0.020)。敏感性分析表明,个性化的围手术期治疗在短期内主导了标准护理,成本降低和96.56%的仿真中的健康增长阳性(补充图。1a)表明,鉴于应用模型假设,个性化的围手术期处理是具有成本效益的(补充图。1B)。
讨论
在这项研究中,我们将所需的步骤从临床问题框架到基于AI的决策支持工具的临床实施所需的步骤,并使用AI技术务实地利用来自全国医疗保健注册的现实世界数据的AI技术。
我们观察到术后不良事件在部署基于AI的决策支持工具以进行个人风险评估和计划进行CRC手术的患者的个性化围手术治疗后更少。
到目前为止,基于AI的决策工具通常仅限于研究设置。以前试图将AI技术引入医疗保健系统的常见挑战是它们缺乏临床可用性和过度复杂性7。为了克服这些挑战,我们建立了临床医生与数据科学家之间的多学科合作,他们确定了临床问题,定义了预期的结果,并开发了一种在当前基础架构中可扩展的解决方案。在这项研究中开发和验证的预测模型成功地实现了预期的结果,证明了满足拟议目标的令人满意的表现。因此,我们研究的主要贡献之一是弥合基于AI的预测模型与其现实世界临床实施之间的差距。将AI预测转换为可行的治疗修饰,这代表了从传统的预测分析到真正介入的AI在手术中的转变。
以前已经开发了采用更先进方法的预测模型8。但是,临床信息技术基础架构可能是实施实际实施的限制因素,因为在临床上可行,具有更高级或大量的输入变量的模型将需要自动数据检索来填充决策支持工具9。可以想象实施临床预测模型的近乎无尽的策略。但是,手术决策提出了一种临床用例,过度治疗和治疗不足可能不利于患者。如前所述5。
在当前的研究中,做出了一些战略决策,以开发可实施的围手术期护理的可实施系统。预测模型是根据特征良好的国家质量保证数据库开发的,该数据库已经过验证6。该数据库包含大量前瞻性收集的患者病例,并广泛用于科学项目,并用于监测丹麦CRC患者的临床护理质量。熟悉丹麦的所有手术部门的数据源,并具有对数据有效性的经验主张,这有助于建立对使用该工具的临床医生对数据基础的信任。其次,选择了旨在促进最佳实践的标准数据格式和模型框架以确保方法论有效性10。第三,我们涉及结直肠外科医生在开发过程中,以确保该模型满足了真正的临床需求,促进了对该工具的信任,并确认用例从临床人员的角度来看,用例反映了现实世界中的临床问题。第四,验证了旨在使用的中心EHR收集的局部数据模型,有助于强调使用该工具对患者进行围手术期优化进行分层的合理性。最后,使用具有经验证明效果的治疗方法,例如术前高密集型间隔培训,具有良好的风险状况2和针对未充分利用的围手术治疗窗口11,被认为是一个直接的目标,具有安全的风险状况和临床益处的很高可能性,这有助于获得临床医生,当地领导和患者的支持。未来临床数据驱动的产品的开发可能会受益于研究的经验,该研究的经验与临床,技术和科学人员之间的早期多学科合作,以将临床问题置于数据问题中,并确定适当的数据和开发方法。
这项研究解决了一个重要的临床问题。术后死亡率是全球第三大死亡原因1。术后并发症不仅会极大地影响术后死亡率,而且还大大增加了医疗保健成本,进一步加剧了已经压力的医疗保健系统,并使这一问题成为全球关注12。术后并发症的风险是多因素的,脆弱的表型和合并症是主要贡献者13。这些因素之间的关系是非线性和多因素,我们的研究强调了与患者风险评估有关的挑战。基于AI的模型可以发现大型数据集中变量之间的复杂关系,使其非常适合医疗保健设置中的风险评估。但是,对于实际问题,使用具有太多灵活性的方法可能导致模型过高,而灵活性太少会导致潜在性能的丧失。因此,选择适当的模型体系结构是机器学习工程师的主要挑战之一。在当前的研究中,主要目标是该模型的临床实施。在开发过程中,当模型令人满意地执行时,选择了最简单的模型。使用最简单的模型也使部署变得容易,因为可以使用简单的应用程序将模型参数作为输入来实现,从而使用与模型培训相同的规则归纳丢失变量,并根据逻辑函数计算风险。By incorporating a range of patient data domains (for example, demographics, frailty measures, comorbidities, health behavior measures, biomarkers), the model was able to learn from a somewhat broad data representation of patients to generate personalized predictions about postoperative risk.This can help tailor preoperative optimization strategies for patients, as being guided by only single risk measures can lead to contradictory information.Interventions aimed at preventing or mitigating postoperative complications have been shown to be particularly beneficial for subgroups of patients at higher risk of adverse outcomes, which is consistent with the present finding where the absolute difference in incidence proportions or IRs were greater in the subgroups with a higher predicted risk of 1-year mortality14。Further, the decrease in postoperative complications in our study clearly highlights these findings and is consistent with a recent randomized clinical trial in a similar setting2。
Given the high cost and logistical challenges of conducting randomized controlled trials in clinical settings, more pragmatic studies can effectively inform initial evaluations and guide the design of future large-scale trials15。Furthermore, we modeled the cost-effectiveness of the targeted treatment against the standard of care and estimated the incremental costs and health effects, measured in terms of quality of life, for the first year after surgery.We demonstrated a notable cost savings potential from deploying the AI prediction model, which was followed by individualized treatment trajectories.Despite the limitations associated with simulated data, our findings demonstrate that AI-based decision support tools for individual risk assessment could offer opportunities for targeted interventions that aim at improving health outcomes among high risks and save costs, allowing for more cost-effective resource allocation.Furthermore, the current health economic model investigated only the short-term effects of AI-supported personalized perioperative treatment, warranting further research into the long-term consequences of the treatment paradigm.
The study’s limitations include the fact that it cannot establish any causal relationship between the implementation of personalized perioperative treatment and improved postoperative outcomes.The assignment of interventions to risk groups was guided by existing clinical guidelines, expert consensus and retrospective observational data.Although our approach enables stratified perioperative optimization, refining the interventions in treatment bundles and improving treatment bundle allocation could be an objective of future studies, where the risk of a given outcome can be modeled using patients’ characteristics under different treatment strategies using a causal prediction framework16,,,,17。Integrating such findings into the personalized perioperative treatment paradigm may enhance patient outcomes further by identifying individualized treatment effects, further supporting clinical decision-making.Future studies may benefit from using more data-efficient methods to estimate model performance than split-sample validation, such as crossvalidation or bootstrapping, more sophisticated methods for imputation, including multiple imputation, and estimating confidence intervals analytically rather than using bootstrapping18,,,,19。Moreover, the relatively small sample size of the prospective cohort, although sufficient for demonstrating feasibility and implementation insights, limits the ability to draw definitive conclusions on clinical benefit.Further, the study did not investigate whether standardized treatment bundles or introducing a decision support tool to identify patients with a high risk of poor postoperative outcomes could drive the observed decrease in complication rates.To address this knowledge gap, a multicenter randomized controlled trial (NCT06645015) is being planned in Denmark to evaluate the effect of the decision support tool at centers with standardized perioperative optimization bundles.Despite these limitations, as well as the inherent problems with comparing patients from different time periods, the relatively low number of patients and the single center origin, our study still supports the potential benefit of using AI to identify patients who might benefit from targeted interventions, showed a notable reduction in severe postoperative outcomes and serves as a proof-of-concept of the paradigm, offering pioneering insights into the practical application of AI technologies.
In conclusion, we believe that our study addresses the current challenges associated with the deployment of AI in the field of surgery.We demonstrate the clinical utility of AI technologies and offer an adaptable framework for further scalability to other healthcare fields.Moreover, we believe that findings from this study may accelerate the ongoing paradigm shift in perioperative care towards personalized medicine.
方法
道德声明
The study complies with all relevant ethical and regulatory standards, including the EU General Data Protection Regulation (GDPR) and the Medical Device Regulation (MDR, EU 2017/745).The model development was based on registry data, did not require ethical approval or informed consent, and was registered in Region Zealand’s research inventory (REG-102–2020).The collection of EHR data for model validation, as well as data collection for the prospective clinical cohort, and the prospective implementation of the algorithm was approved as a clinical quality improvement initiative by Zealand University Hospital’s institutional leadership (Approval ID: 10736955 and 11329111).Informed consent was formally waived, as permitted under Danish law for quality improvement projects.The AI decision support tool was developed and implemented in accordance with MDR Article 5(5), which governs inhouse medical device use in healthcare institutions, and fulfilled requirements for clinical performance, risk management and institutional oversight.
Cohorts
This was a nonrandomized comparative cohort study consisting of three cohorts: an NRC, an RCC and a PCC.
The NRC consisted of data from the Danish Colorectal Cancer Group (DCCG), enriched with data from The Danish National Patient Register (DNPR), The Danish Prescription Registry (DPR) and the Register of Laboratory Results for Research (RLRR).These data were used for model development and internal validation.Data on all patients undergoing a curative intended surgery in an elective setting for adenocarcinoma of the colon and/or rectum in the period 1 January 2014 to 1 April 2019, was collected from the DCCG database20。DCCG is a nationwide clinical quality register, which covers more than 99% of patients operated for CRC in Denmark since 2001. The dataset was enriched with data on a patient level with nationwide prescription data since 1995 from DPR21, with nationwide data on biochemical and immunological biomarkers from RLRR since 2013–201522, and with trajectory data from public Danish hospitals from DNPR since 197723。The data sources were harmonized into the Observational Medical Outcomes Partnership (OMOP) common data model (CDM)24。A multidisciplinary team (MDT) of data scientists and medical doctors was responsible for transforming the registry data to the OMOP format, where source data were mapped to representative concepts in the OHDSI Standardized Vocabularies25and tables, following a process of one medical doctor mapping the concept, another reviewing the mapping and suggesting updates to the initial mapper.Cases where the initial mapper and the reviewer doubted the solution or did not agree were flagged for plenary team discussion, where a decision was made.Clinicians and data scientists worked together to define an extract, transform and load logic to create a database, where an automated tool developed by the OHDSI community was used to identify potential data quality errors26。
The RCC was used for external validation of the model and as a comparative cohort against the PCC.Data were retrieved locally from EHR at the Department of Surgery at Zealand University Hospital in Denmark for all patients undergoing elective, curative-intent surgery for CRC from 1 January 2020 to 31 January 2023. To ensure accuracy and reliability, all collected data underwent monitoring, querying and validation by the senior investigator.Assessors who reviewed medical records received a structured introduction to the database before data entry.The primary investigator validated the first 20 records for each assessor.Any inconsistencies in data capture were discussed with the assessors and corrected accordingly.Thereafter one out of every ten records was checked randomly for ongoing validation.Assessors had regular opportunities to discuss cases with the primary investigators, and consensus was reached during panel discussions when needed.The PCC cohort was represented by all patients referred to the MDT meeting at Zealand University Hospital, Denmark, with suspected CRC who were deemed eligible for curative-intent surgery during the period from 1 February 2023 through 31 December.Patients scheduled for emergency surgery, defined as surgery within 72 h of the initial outpatient clinic visit and/or a preceding emergency department visit, as well as those patients requiring additional evaluation or procedures before elective CRC surgery were excluded.An AI-based risk prediction model for 1-year mortality, followed by personalized treatment pathways for perioperative optimization according to the predicted mortality risk, was implemented as standard treatment at Zealand University Hospital for all eligible patients on 1 February 2023. Thereby, the PCC cohort was used as an intervention cohort for a clinical trial.A prospectively maintained database, managed using an EHR form in REDCap27, was established to serve as the data source for the PCC cohort.Accuracy, reliability and validity were ensured in the same manner as for the RCC database.
Reporting on sex followed The Sex and Gender Equity in Research—SAGER guidelines28。In all three study cohorts, an adequate representation of both male and female patients was expected, as all patients diagnosed with CRC and eligible for elective, curative-intent surgery were included, representing the CRC population.No exclusions were made based on sex.Sex was recorded as biological sex based on registry or EHR data.Information on gender was not available and was not collected.
Problem-based learning
A local panel consisting of colorectal surgeons, epidemiologists and data scientists was established to investigate drivers of poor postoperative trajectories and potential risk-reducing initiatives.Data from the DCCG on the NRC was used as the data foundation for the study due to its availability, validity and broad inclusion of valuable data for patients operated on for CRC.The panel agreed that identifying high-risk patients and introducing targeted interventions would be a high probability of success strategy.We used 1-year mortality as a surrogate for poor postoperative outcomes due to the high reliability of vital status available through the Danish Civil Registration System29and the previous studies showing substantial differences in 1-year mortality after elective CRC surgery according to generic frailty indicators and correlation with postoperative morbidity30,,,,31。The association between four prognostic factors, representing different aspects of health domains, age at time of surgery (<50 years, 50–59 years, 60–69 years, 70–79 years, ≥80 years), CC-Index groups (0, 1–2, 3–4, ≥5), WHO PS and UICC stage, and overall survival time was investigated using unweighted Kaplan–Meier curves and inspected visually.For each prognostic factor level, data were stratified further by whether at least one postoperative complication graded CD 2 or higher32发生。The correlations between prognostic factors were investigated using Spearman’s rank correlation coefficient for all complete pairs of variables.
Framework of the 1-year mortality prediction model
The development of a prediction model to support decision-making in perioperative planning has been discussed and supported by representatives from the Danish Colorectal Cancer Patient Association, as part of the Enhanced Perioperative Oncology Consortium.The NRC cohort was used to develop the prediction model, using the standardized framework for developing clinical prediction models, PatientLevelPrediction33, which is interoperable with the OMOP format.The study used death within 1 year following surgery, defined as death from any cause between day 0 and day 365 from the date of surgery, as the outcome variable.In addition, risk groups were created based on a clinical request to guide perioperative optimization pathways.Patients were grouped by their predicted risk of 1-year mortality following surgery: ≤1%, >1 to ≤5%, >5 to ≤15%, or >15%, styled as group A, B, C and D. For each group the proportion of patients dying within 1 year after surgery was calculated for the model development, internal validation and external validation sets by risk group.Further, surgical complications graded as CD ≥3a and medical complications graded as CD ≥2 within 30 days were also reported for each risk group to support the clinical value of the risk groups.
Selecting covariates for the 1-year mortality prediction model
The selection of candidate covariates was developed iteratively.Initially, a data-driven model was trained using age, sex and all conditions occurrences, drug exposures, procedure occurrences, observations and measurement values, with any event occurring within 30 days, 365 days, 1,825 days or any time before the index date.Variables were ranked based on their standardized mean difference and presented for clinicians, who identified thematic variables as a base to construct new input variables or keep them as is for the training of the clinical model (for example, combining codes that represent ischemic heart disease or diabetes mellitus, or keeping a measurement as it is).For laboratory measures, the candidate covariates were chosen based on routinely available blood tests performed preoperatively before elective cancer surgery at the center where the model would be implemented.The final candidate covariates were all designed to be feasible for clinicians to retrieve during the preoperative planning, either through the EHR system or during the preoperative outpatient clinic visit.The list of candidate covariates was reviewed by clinical personnel, who could request covariates not included through the initial process.
Sample size for the 1-year mortality prediction model
A post hoc calculation of the minimum sample size of patients needed to develop a clinical prediction model was performed using the method described by Riley et al.34The calculation assumed 68 candidate covariates, that the model would explain 10% of the variability and the prevalence of the outcome would be 5.2%.The minimum number of patients needed to develop the model was 6,941 to develop a clinical prediction model with an acceptable difference in apparent and adjustedr-squared and margin of error in the estimation of the intercept of 0.05.
Missing data
Missing data were handled in three ways: for body mass index, clinical T category, clinical M category, alcohol consumption and smoking status, a specific code for missing values was used.For diagnosis, drug exposures and procedures, an absence of a positive code was considered as negative, having no option for missing.For continuous variables, missing values were imputed by the median value of the register data.
Development and validation of the 1-year mortality prediction model
A standardized framework for developing prediction models was used for model training and internal validation33。The registry data were stratified by outcome and split into a model development set containing 75% of the patients used for model development and an internal validation set containing 25% of the patients.The RCC was used for external validation, representing the population where the prediction model was to be implemented.The model was validated externally using the predicted and observed 1-year mortality and further investigated for clinical usefulness by investigating the incidence proportion of 1-year mortality, medical complications and surgical complications in predefined risk groups incrementally increasing the predicted risk of 1-year mortality.The RCC timeperiod did not overlap the NRC (development and internal validation), with the RCC (external validation) being more recent.Model development was done using the least absolute shrinkage and selection operator (LASSO) logistic regression as a statistical learner with fivefold crossvalidation in the model development set, implemented with cyclic coordinate descent algorithm to optimize the likelihood function35。The method allows for estimating an optimal hyperparameter based on the crossvalidation.For all covariates, the model used simple linear relationships.Feature selection was based on the property of the LASSO regression to shrink covariate coefficients to 0, thereby having no effect on the prediction36。Model performance was evaluated in the model development, internal validation and external validation sets.Calibration was evaluated using calibration-in-the-large and moderate calibration from a previously published framework37。Calibration-in-the-large was assessed using the ratio of observed events versus the expected number of predicted events, whereas moderate calibration was assessed visually using flexible calibration curves created with locally estimated scatterplot smoothing.Calibration curves were investigated only for evaluation sets containing at least 200 events and nonevents37。Discrimination was evaluated using the AUROC and sensitivity with a threshold value of 0.15.CIs for the calibration-in-the-large and calibration intercept were estimated based on 10,000 bootstrapped resamples.Reporting was done in accordance with the TRIPOD+AI guideline38(checklist available in supplementary information).
Clinical implementation of the 1-year prediction model
To accommodate the need for data storage, computational power and high-level security, the IT infrastructure was developed in a secure private cloud and hosted by the Danish National Life Science Supercomputing Center39。Consultant surgeons received secure cloud environment access through multifactor authentication.Data were extracted from patient EHR manually, and model output data were extracted and registered in the EHR.
The AI-based clinical decision support tool was developed and deployed as an inhouse software solution within Zealand University Hospital, adhering to the Medical Device Regulation (MDR, EU 2017/745, Article 5(5))40, which governs the development and use of medical software within healthcare institutions.Compliance with MDR 5(5) ensures that the system meets state-of-the-art validation, risk management and clinical governance requirements, supporting its safe and effective implementation in clinical practice.
All patients referred to the MDT meeting at Zealand University Hospital, Denmark, with suspected CRC during the period from 1 February 2023 through 31 December 2023, were risk stratified by a consultant surgeon before the MDT meeting.During the first outpatient visit, input data were modified, if necessary, according to eventual discrepancies in information used for initial risk assessment, and updated output data were imported into the patient’s EHR.
Individual treatment pathways according to risk profile
The individual treatment pathways were tailored according to the risk group of the patient.The risk group was allocated according to the prediction model risk profile A, B, C and D and used as a decision-making tool, enabling the possibility of adjusting the risk group based on clinical judgment when deemed necessary by colorectal surgeons.Individual treatment pathways were predefined based on the assigned risk group and consisted of interventions designed based on existing evidence within perioperative optimization in addition to standard postoperative protocol based on enhanced recovery after surgery protocols41。The individual interventions in a bundle class A, B, C or D were not picked by the clinicians at their discretion but were administered as a standardized bundle, including all the elements for the particular bundle.The intensity and frequency of interventions increased with the predicted 1-year mortality risk group.Due to the study’s complexity and the several interventions, a detailed description of interventions following CERT42and TIDieR43guidelines is provided in theSupplementary Information。Briefly, the main interventions in the preoperative period included interventions directed towards correcting iron deficiency anemia (intravenous iron supplementation), nutritional deficit (consultation by a dietician with use of specific protein supplementations), functional deficit (nonsupervised and supervised training according to risk profile), geriatric assessment and respiratory physiotherapy according to risk profile.The intraoperative interventions constituted goal-directed therapy protocols.For hemodynamic monitoring, lithium dilution cardiac output was utilized.Stroke volume and stroke volume variation were used to assess fluid responsiveness.Perfusion index and central venous oxygen saturation were used for decision support.Fluid therapy was administered according to the Danish Society of Anesthesiology and Intensive Care Medicine44。In the postoperative period, the main interventions constituted standardized discharge criteria from the postoperative care unit (POCU) after consultation with both the consultant anesthesiologist and the consultant surgeon according to risk profile.Patients in group D were admitted to the POCU for the first 24 h after surgery.All patients in group D were consulted by the operating surgeon and anesthesiologist within the first 2 h after surgery.Goal-directed therapy was continued during their stay at the POCU.Patients in group D were assisted individually by a nurse who was educated in the enhanced recovery after surgery protocol.Opioid-sparing pain management was applied for all patients;a transversus abdominis plane block or transmuscular quadratus lumborum block was administered if necessary.According to the risk profile, the patients were offered postoperative physiotherapy, delirium screening and nutritional intervention.All patients were discharged according to standardized criteria, including assessment for sufficient bowel function, mobility and pain control.
Before/after implementation of personalized perioperative treatment
To assess the comparability of the RCC and the PCC, baseline characteristics were compared across key demographic and clinical variables.To further minimize selection bias, the same inclusion criteria and data sources were applied to both cohorts.A comparison of postoperative events between the PCC and RCC was used to investigate the association between the implementation of the personalized perioperative treatment supported by a clinical prediction model as a decision support tool.In the RCC cohort, perioperative optimization strategies were applied based on clinical judgment and MDT discussions with specific optimization efforts as reported previously2,,,,45,,,,46,,,,47。The main elements of the optimization bundle were consistent between the two cohorts.With the implementation of the prediction model, a standardized decision support tool was introduced, ensuring a structured risk stratification process guiding intervention intensity according to predefined risk categories.The main outcome was the incidence proportion of severely complicated postoperative courses, defined as CCI > 20 within 90 days after CRC surgery.This specific cutoff value of CCI > 20 as a measure of clinical relevance for severely complicated postoperative courses was determined based on findings from a recent randomized clinical trial2。Further outcomes included the number of readmissions, defined as the count of all-cause unplanned admissions to a hospital lasting more than 24 h within 90 days after index surgery, the number of postoperative complications was defined as the count of adverse deviation from the expected postoperative course in the first 90 days postoperatively, and any medical complications, defined as any adverse deviation from the postoperative course associated, but not linked directly to the surgical procedure during the first 90 days postoperatively.
Statistical analysis of the clinical outcomes in the before/after comparison
Continuous variables are presented as medians with the first and third quartiles.Categorical variables are presented as counts and fraction percentages.Hypothesis testing was performed using regression models and chi-squared and Wilcoxon rank-sum tests.The agreement between the risk group suggested by the decision support tool and the risk group chosen by the clinicians in the PCC was reported using an unweighted Cohen’s kappa coefficient.Relationships between outcomes and variables were modeled using either a univariate model containing only treatment with the treatment paradigm as a binary variable, or a multivariable to account for the differences in risk group distribution, where both the treatment paradigm and the risk group were included as independent variables.The binary outcomes (CCI > 20 and any medical complications) were modeled using logistic regression, whereas count data (number of readmissions and number of complications) were modeled using a negative binomial regression.Two-tailedp values ≤ 0.05 were considered statistically significant.Cost-effectiveness analysis
Hybrid decision tree and Markov model structure
The hybrid decision tree Markov (HDTM) model was developed to evaluate the short-term cost-effectiveness of personalized perioperative treatment compared to standard care with a time horizon of 1 year after surgery.
The HDTM model simulated the expected costs and QALYs for a hypothetical cohort undergoing either the standard of care or the personalized perioperative treatment.Detailed information on the model cohort, transition probabilities, costs and utility scores for model states are available inSupplementary Information。The simulation was based on a hypothetical cohort of patients with a base case risk group distribution as the RCC.The HDTM assumed patients received postoperative bundle care according to risk group under the personalized perioperative treatment, while all patients’ standard of care was assumed in the standard-of-care arm to receive the same treatment.For the decision tree component of the model, the proportion of patients developing a complicated postoperative trajectory versus a noncomplicated postoperative trajectory was determined based on parameter estimates of the risk group and treatment effect.A complicated postoperative trajectory was defined as any patient with a complication graded 2 or above on the CD scale, as this corresponds to a CCI score of at least 20.9.For the Markov simulation, cycle length was set to 1 day (and repeated 365 times) with the health states (decision nodes) representing different levels of contact with the healthcare sector: ‘healthy (no contact),’ ‘inpatient visit,’ ‘outpatient visit,’ ‘general practitioner visit’ or ‘dead.’ The initial state was set to ‘inpatient’ for all patients on day 0.Transition probabilities were based on data from RCC and PCC with a relative increase in complicated trajectories of 5% in risk group A, 40% decrease in risk group B, 16% decrease in risk group C and 51% decrease in risk group D for the personalized perioperative treatment.Thus, the only difference between the personalized perioperative treatment and standard of care, aside from intervention costs, was the difference in distributions between uncomplicated versus complicated trajectories.A probabilistic sensitivity analysis was constructed to address the total parameter uncertainty, where the output was per risk strata complication combination for both the standard of care and the intervention strategy.Utilities were transformed into QALYs by adding the days alive during the study period.Based on the estimated costs and QALYs, the personalized perioperative treatment was evaluated against the standard of care, and the incremental cost-effectiveness ratio was calculated.
Costs and health effects
An extended healthcare sector perspective was applied, including costs of inhospital care, outpatient care, general practitioner visits and prescription medicine.Discounting was not applied.Detailed information on costs and health effects is described in theSupplementary Information, together with Supplementary Tables3–5。In summary, gross cost estimates for the model trajectories were based on the healthcare consumption of the NRC.All unit costs were valued using year 2023 prices.Danish Diagnose-Related Group tariffs were applied as unit costs for hospital care obtained from DNPR, whereas the unit cost of a general practitioner visit was set to the base tariff per visit based on the services and related tariffs between the Organization of General Practitioners and the Regional Board of Salaries and Fees for General practice.Costs of prescription medicine were estimated from the DPR using drug prices48。Costs associated with implementing the personalized perioperative treatment included costs associated with hosting the decision support tool, salary for system administrators, hourly wages for hospital staff and utensils used.Health effects were measured using QALYs and were based on utility scores derived from EQ-5D-5L questionnaires for 139 patients from the PCC.Relative decreases in utility were assumed for the inpatient state and all complicated trajectories.The health effects were assumed to be identical across the two treatment arms but with a different distribution of uncomplicated and complicated trajectories.
报告摘要
有关研究设计的更多信息可在Nature Portfolio Reporting Summarylinked to this article.
数据可用性
Due to Danish legislation protecting sensitive personal information, the source data cannot be shared.Currently, the Danish Data Protection Agency accepts no deidentification measures as fully anonymizing the data.As such, patient-level data cannot be shared.Applications for data access should be submitted to the Danish Health Data Authority (contact: servicedesk@sundhedsdata.dk).Researchers wishing to access and use the data for research purposes must meet the credentialing requirements detailed on the Authority’s website:https://sundhedsdatastyrelsen.dk/da/english/health_data_and_registers/research_services。To access data from DCCG, applications should be made as specified on the DCCG website (https://dccg.dk/om-databasen/) under the section ‘Om databasen.’
代码可用性
Analyses were performed with R (v.4.2.0) using packages: PatientLevelPrediction (v.6.3.6), CohortGenerator (v.0.8.1), DatabaseConnector (v.6.3.2), SqlRender (v.1.17.0), FeatureExtraction (v.3.4.0), Andromeda (v.0.6.6), reticulate (v.1.40.0), survival (v.3.4-0), stringr (v.1.5.1), tidyverse (v.2.0.0), tidymodels (v.1.0.0), table1 (v.1.4.2), boot (v.1.3-28), viridis (v.0.6.5), pROC (v.1.18.5), ggpubr (v.0.6.0), grid (v.4.2.0), gridExtra (v.2.3), ggsurvfit (v.0.3.1), data.table (v.1.16.4), cowplot (v.1.1.3), ggcorrplot (v.0.1.4), broom (v.1.0.6), purrr (v.1.0.2), scales (v.1.3.0), models (v.2.18.1.1), glue (v.1.8.0), fitdistrplus (v.1.2-1), MASS (v.7.3-58.1), lubridate (v.1.9.3), zoo (v.1.8-12), expm (v.0.999-6), rlang (v.1.1.4) and gtools (v.3.9.5).Covariate definitions and custom code are available via GitHub athttps://github.com/CenterForSurgicalScienceDenmark/aidSurg/。参考
Nepogodiev, D. et al.
Global burden of postoperative death.Lancet 393, 401 (2019).
文章一个 PubMed一个 Google Scholar一个
Molenaar, C. J. L. et al.Effect of multimodal prehabilitation on reducing postoperative complications and enhancing functional capacity following colorectal cancer surgery: the PREHAB randomized clinical trial.JAMA Surg. 158, 572–581 (2023).
文章一个 PubMed一个 PubMed Central一个 Google Scholar一个
Bausys, A. et al.Effect of home-based prehabilitation on postoperative complications after surgery for gastric cancer: randomized clinical trial.Br.J. Surg. 110, 1800–1807 (2023).
文章一个 PubMed一个 Google Scholar一个
Wang, B. et al.Prehabilitation program improves outcomes of patients undergoing elective liver resection.J. Surg.res。 251, 119–125 (2020).
文章一个 PubMed一个 Google Scholar一个
Loftus, T. J. et al.Artificial intelligence and surgical decision-making.JAMA Surg. 155, 148–158 (2020).
文章一个 PubMed一个 PubMed Central一个 Google Scholar一个
Klein, M. F. et al.Validation of the Danish Colorectal Cancer Group (DCCG.dk) database—on behalf of the Danish Colorectal Cancer Group.结直肠疾病。 22, 2057–2067 (2020).
文章一个 CAS一个 PubMed一个 Google Scholar一个
Varghese, C., Harrison, E. M., O’Grady, G. & Topol, E. J. Artificial intelligence in surgery.纳特。医学 30, 1257–1268 (2024).
文章一个 CAS一个 PubMed一个 Google Scholar一个
Ren, Y. et al.Performance of a machine learning algorithm using electronic health record data to predict postoperative complications and report on a mobile platform.JAMA NetW。打开 5, e2211973 (2022).
文章一个 PubMed一个 PubMed Central一个 Google Scholar一个
Agius, R. et al.Deployment and validation of the CLL treatment infection model adjoined to an EHR system.NPJ Digit.医学 7, 147 (2024).
文章一个 PubMed一个 PubMed Central一个 Google Scholar一个
Schuemie, M. et al.Health-analytics data to evidence suite (HADES): open-source software for observational research.螺柱。Health Technol.inf。 310, 966–970 (2024).
Van Der Bij, G. J. et al.The perioperative period is an underutilized window of therapeutic opportunity in patients with colorectal cancer.安。外科。 249, 727–734 (2009).
文章一个 PubMed一个 Google Scholar一个
Ludbrook, G. L. The hidden pandemic: the cost of postoperative complications.Curr。Anesthesiol.代表。 12, 1–9 (2022).
文章一个 PubMed一个 Google Scholar一个
George, E. L. et al.Association between patient frailty and postoperative mortality across multiple noncardiac surgical specialties.JAMA Surg. 156, e205152 (2021).
PubMed一个 Google Scholar一个
Cambriel, A. et al.Impact of preoperative uni- or multimodal prehabilitation on postoperative morbidity: meta-analysis.BJS Open 7, zrad129 (2023).
文章一个 PubMed一个 PubMed Central一个 Google Scholar一个
Fernainy, P. et al.Rethinking the pros and cons of randomized controlled trials and observational studies in the era of big data and advanced methods: a panel discussion.BMC Proc. 18, 1 (2024).
文章一个 PubMed一个 PubMed Central一个 Google Scholar一个
Sperrin, M. et al.Using marginal structural models to adjust for treatment drop-in when developing clinical prediction models.统计医学 37, 4142–4154 (2018).
文章一个 PubMed一个 PubMed Central一个 Google Scholar一个
van Geloven, N. et al.Prediction meets causal inference: the role of treatment in clinical prediction models.欧元。J. Epidemiol。 35, 619–630 (2020).
文章一个 PubMed一个 PubMed Central一个 Google Scholar一个
Collins, G. S. et al.Evaluation of clinical prediction models (part 1): from development to external validation.Br.医学J. 384, e074819 (2024).
文章一个 Google Scholar一个
Li, J. et al.Comparison of the effects of imputation methods for missing data in predictive modelling of cohort study datasets.BMC Med.res。Methodol. 24, 41 (2024).
文章一个 PubMed一个 PubMed Central一个 Google Scholar一个
Ingeholm, P., Gögenur, I. & Iversen, L. H. Danish colorectal cancer group database.Clin.流行病。 8, 465–468 (2016).
文章一个 PubMed一个 PubMed Central一个 Google Scholar一个
PottegÃ¥rd, A. et al.Data resource profile: the Danish national prescription registry.int。J. Epidemiol。 46, 798 (2017).
PubMed一个 Google Scholar一个
Arendt, J. F. H. et al.Existing data sources in clinical epidemiology: laboratory information system databases in Denmark.Clin.流行病。 12, 469–475 (2020).
文章一个 PubMed一个 PubMed Central一个 Google Scholar一个
Schmidt, M. et al.The Danish National patient registry: a review of content, data quality, and research potential.Clin.流行病。 7, 449–490 (2015).
文章一个 PubMed一个 PubMed Central一个 Google Scholar一个
Marc Overhage, J., Ryan, P. B., Reich, C. G., Hartzema, A. G. & Stang, P. E. Validation of a common data model for active safety surveillance research.JAMIA 19, 54–60 (2012).
PubMed一个 Google Scholar一个
Reich, C. et al.OHDSI standardized vocabularies—a large-scale centralized reference ontology for international data harmonization.JAMIA 31, 583–590 (2024).
Blacketer, C., Defalco, F. J., Ryan, P. B. & Rijnbeek, P. R. Increasing trust in real-world evidence through evaluation of observational data quality.J. Am。Med Inf.联合。 28, 2251–2257 (2021).
文章一个 Google Scholar一个
Harris, P. A. et al.Research electronic data capture (REDCap)—a metadata-driven methodology and workflow process for providing translational research informatics support.J. Biomed.inf。 42, 377–381 (2009).
文章一个 Google Scholar一个
Heidari, S., Babor, T. F., Castro, P., Tort, S. & Curno, M. Sex and gender equity in research: rationale for the SAGER guidelines and recommended use.res。集成。Peer Rev. 1, 2 (2016).
文章一个 PubMed一个 PubMed Central一个 Google Scholar一个
Pedersen, C. B., Gøtzsche, H., Møller, J. Ø.& Mortensen, P. B. The Danish civil registration system.Scand.J. Public Health 39, 22–25 (2011).
文章一个 PubMed一个 Google Scholar一个
Bojesen, R. D., Degett, T. H., Dalton, S. O. & Gögenur, I. High World Heath Organization performance status is associated with short- and long-term outcomes after colorectal cancer surgery: a nationwide population-based study.dis。Colon Rectum 64, 851–860 (2021).
文章一个 PubMed一个 Google Scholar一个
Ose, I. et al.The association of postoperative morbidity and age on 5-year survival after colorectal surgery in the elderly population: a nationwide cohort study.结直肠疾病。 26, 899–915 (2024).
文章一个 CAS一个 PubMed一个 Google Scholar一个
Clavien, P. A. et al.The Clavien–Dindo classification of surgical complications: five-year experience.安。外科。 250, 187–196 (2009).
文章一个 PubMed一个 Google Scholar一个
Reps, J. M., Schuemie, M. J., Suchard, M. A., Ryan, P. B. & Rijnbeek, P. R. Design and implementation of a standardized framework to generate and evaluate patient-level prediction models using observational healthcare data.JAMIA 25, 969–975 (2018).
Riley, R. D. et al.Calculating the sample size required for developing a clinical prediction model.Br.医学J. 368, m441 (2020).
文章一个 Google Scholar一个
Suchard, M. A., Simpson, S. E., Zorych, L., Ryan, P. & Madigan, D. Massive parallelization of serial inference algorithms for a complex generalized linear model.ACM Trans。模型。计算。Simul. 23, 1–17 (2013).
文章一个 Google Scholar一个
James, G., Witten, D., Hastie, T. & Tibshirani, R.An Introduction to Statistical Learning, Vol.44 (Springer US, 2021).
Van Calster, B. et al.A calibration hierarchy for risk models was defined: from utopia to empirical data.J. Clin。流行病。 74, 167–176 (2016).
文章一个 PubMed一个 Google Scholar一个
Collins, G. S. et al.TRIPOD+AI statement: updated guidance for reporting clinical prediction models that use regression or machine learning methods.Br.医学J. 385, e078378 (2024).
文章一个 Google Scholar一个
Computerome.www.computerome.dk/(2024)。
EUR-Lex Document 32017R0745.https://eur-lex.europa.eu/legal-content/EN/TXT/HTML/?uri=CELEX:02017R0745-20240709(2024)。
Gustafsson, U. O. et al.Guidelines for perioperative care in elective colorectal surgery: enhanced recovery after surgery (ERAS®) society recommendations: 2018.World J. Surg. 43, 659–695 (2019).
文章一个 CAS一个 PubMed一个 Google Scholar一个
Slade, S. C., Dionne, C. E., Underwood, M. & Buchbinder, R. Consensus on exercise reporting template (CERT): explanation and elaboration statement.Br.J. Sports Med. 50, 1428–1437 (2016).
文章一个 PubMed一个 Google Scholar一个
Hoffmann, T. C. et al.Better reporting of interventions: template for intervention description and replication (TIDieR) checklist and guide.Br.医学J. 348, g1687 (2014).
文章一个 Google Scholar一个
Vejledning til perioperativ væskebehandling.https://dasaim.dk/guides/vejledning-til-perioperativ-vaeskebehandling/(2024)。
Bojesen, R. D. et al.Effect of modifying high-risk factors and prehabilitation on the outcomes of colorectal cancer surgery: controlled before and after study.BJS Open 6, zrac029 (2022).
文章一个 PubMed一个 PubMed Central一个 Google Scholar一个
Bojesen, R. D. et al.The dynamic effects of preoperative intravenous iron in anaemic patients undergoing surgery for colorectal cancer.结直肠疾病。 23, 2550–2558 (2021).
文章一个 PubMed一个 Google Scholar一个
Bojesen, R. D. et al.Fit for Surgery—feasibility of short-course multimodal individualized prehabilitation in high-risk frail colon cancer patients prior to surgery.Pilot Feasibility Stud. 8, 11 (2022).
文章一个 CAS一个 PubMed一个 PubMed Central一个 Google Scholar一个
Danish Medicines Agency.www.medicinpriser.dk/(2024)。
致谢
We thank all clinical personnel at Zealand University Hospital who contributed to this study.We acknowledge the Danish Colorectal Cancer Group and the Danish Clinical Quality Program—National Clinical Registries (RKKP) for providing essential data for the project.This research was supported by Aage and Johanne Louis-Hansen’s Foundation (21-2B-8305/L276 and 23-2B-14410, I.G.), Novo Nordisk Foundation/Data Science Infrastructure grant (NNF21OC0069821, I.G.), Agency for Digital Government (2019–6159, I.G.) and Interreg ØKS (6.3.3-A 2022-4884, I.G.).
道德声明
竞争利益
I.G.and M.H.R.are shareholders in Nordic AI Medical ApS—a health technology company that has licensed a medical device incorporating a prediction algorithm to CE mark the algorithm.M.H.R.also serves as a consultant for Nordic AI Medical ApS.I.G., M.H.R., A.W.R.and J.R.E.are named as inventors (not patented) on a medical software developed to support MDT meetings incorporating a prediction model.The other authors declare no competing interests.
同行评审
Peer review information
Nature Medicinethanks Alberto Bardelli, Matthew Sperrin and the other, anonymous, reviewer(s) for their contribution to the peer review of this work.Primary Handling Editor: Lorenzo Righetto and Saheli Sadanand, in collaboration with theNature Medicine团队。
附加信息
Publisher’s note关于已发表的地图和机构隶属关系中的管辖权主张,Springer自然仍然是中立的。
补充信息
Supplementary Information
Supplementary Methods, TRIPOD+AI checklist and description of interventions.
补充表
Table 1. Initial model covariates.Summarizes initial model covariates used in the prediction model.Table 2. Prediction model coefficient.Summarizes the variables and regression coefficient of the final model.Candidate predictors with a regression coefficient of 0 were shrunk to 0 and not included in the final model.Table 3. Model parameter for probabilistic sensitivity analyses.Summarizes the model parameters used in the probabilistic sensitivity analysis.Spade symbol denotes the parameter that was modeled using a Dirichlet distribution.For transitions per risk group/trajectory combination, each state ‘From’ was modeled together using each transition probability as a parameter in the distribution function as α住院 + α门诊 + α全科医生 + αno contact to healthcare provider + α死的。For the proportion of patients in risk groups and with complicated trajectories were, the counts were used as input variables for the probability function: αrisk group A, uncomplicated trajectory + αrisk group A, complicated trajectory + αrisk group B, uncomplicated trajectory + αrisk group B, complicated trajectory + αrisk group C, uncomplicated trajectory + αrisk group C, complicated trajectory + αrisk group D, uncomplicated trajectory + αrisk group D, uncomplicated trajectory。Diamond symbols indicate that cost was modeled using gamma distributions, with a shape parameter (κ) of 25 and a scale parameter (θ) of 0.04× the value presented in the table.Costs were presented in 2024 US dollars.Club symbol denotes parameters models with a beta distribution, where shape (α) was 100 × value and shape (β) was 100 − value × 100.Table 4. Diagnoses for health economic evaluation.Overview of included diagnosis codes as base for cost estimations.Table 5. Anatomical therapeutic chemical codes for health economic evaluation.Overview of anatomical therapeutic chemical codes included in cost estimation for prescription medicine.
权利和权限
开放访问This article is licensed under a Creative Commons Attribution-NonCommercial-NoDerivatives 4.0 International License, which permits any non-commercial use, sharing, distribution and reproduction in any medium or format, as long as you give appropriate credit to the original author(s) and the source, provide a link to the Creative Commons licence, and indicate if you modified the licensed material.您没有根据本许可证的许可来共享本文或部分内容的改编材料。The images or other third party material in this article are included in the article’s Creative Commons licence, unless indicated otherwise in a credit line to the material.If material is not included in the article’s Creative Commons licence and your intended use is not permitted by statutory regulation or exceeds the permitted use, you will need to obtain permission directly from the copyright holder.To view a copy of this licence, visithttp://creativecommons.org/licenses/by-nc-nd/4.0/。重印和权限
引用本文

Rosen, A.W., Ose, I., Gögenur, M.
等。Clinical implementation of an AI-based prediction model for decision support for patients undergoing colorectal cancer surgery.Nat Med(2025)。https://doi.org/10.1038/s41591-025-03942-x
已收到:
公认:
出版:
doi:https://doi.org/10.1038/s41591-025-03942-x