
机器学习指导过程优化和椰子生物炭填充PLA生物复合材料的可持续价值
作者:Wali, Qamar
介绍
对环境污染和塑料废物的越来越关注,加速了寻求聚合物的可持续替代品1,,,,2。聚乳酸(PLA)是一种可生物降解的热塑性,源自可再生资源(例如玉米淀粉和甘蔗),由于其环境稳定性,堆肥和低碳足迹,已成为有希望的材料3,,,,4。由于其生物相容性和有利的机械性能,PLA在包装,生物医学设备和农产品中发现了广泛的应用。近年来,研究越来越集中于通过合并各种天然和有机填充剂来增强PLA的性能,从而扩大了其高性能,环保复合材料的潜力5,,,,6。以下文献综述总结了有关PLA复合材料的最新研究的关键发现。
乔等人。7据报道,从香蕉和橙皮衍生的1届生物炭增强的聚(乳酸)PLA基质表现出抗拉力强度的30%,而Young S Modulus从194.33的MPA增加到388.31 mpa的倍增。但是,休息时的伸长率从14.18毫米降低到7.24毫米。SEM分析表明,在较高的填充载荷下,平滑裂缝表面具有较小的团聚。同样,Vengadesan等人。8掺入PLA中的5届10 wt%稻壳和二碳填充剂,达到61.2 -MPa的拉伸强度(+105.6%),弯曲强度为135.8 MPa(+104.8%),撞击强度为5.25 kJ/m2以10%的填充含量。硬度增加到80岸D,而延展性下降,填充水平较高。Papadopoulou等。9通过原位聚合,从软木颗粒中添加了1-5 wt%的生物炭到PLA中。1 wt%的添加使拉伸强度从〜30 mpa提高到〜32 MPa,但较高的含量为2.5英寸5 wt%,导致脆性和降低强度降低到〜〜15 16 mpa。杨等。10报道了用纸浆纤维增强的PLA形成生物复合材料。拉伸试验表明,纸浆纤维改善了拉伸模量,但与纯PLA相比,拉伸强度降低了。Gurusamy等。11钢筋土耳其大麻纤维复合材料,有5 wt%开心果壳生物炭。拉伸强度从约40 mpa提高到54 mpa,弯曲强度从〜50 mPa提高到70 mPa,并从〜4 kJ/m的撞击抗性从2到5 kJ/m2。吸水率也降低了约15%。Mahesh等。12开发的聚合物复合材料,含有0 -60 wt%蛋壳和大理石粉。基于大理石的复合材料比基于蛋壳的复合材料高17.21%。相反,60 wt%的蛋壳复合材料显示出43.56%的拉伸强度。杂化配方(50%蛋壳,10%大理石)的弯曲强度和影响强度分别提高了10.67%和10.9%,而仅60%的仅蛋壳复合材料,同时将比率提高了影响力的比率提高了52.45%。Uddin等。13回顾了AI/ML方法在预测和优化基于PLA和天然纤维聚合物复合材料的机械性能的应用。虽然未报告特定值,但该评论突出了AI/ML的潜力,可以解决下一代生物复合材料中的设计复杂性。Mallegni等。14掺入PBSA/PHB-HV生物塑料中的5â15wt%昆虫外骨骼生物量。在整个配方中,拉伸强度在20 MPa左右保持一致。SEM图像证实了散布良好的填充剂,并以最小的聚集体。莫西15优化的椰子纤维增强复合材料是通过融合丝制造制成的。在30 wt%的纤维含量下,拉伸强度从35英寸MPA增加到43.8 MPa,弯曲模量从2.1 GPA提高到2.7 GPA,抗击电阻上升了18%。Chawraba等。16向木材塑料复合材料增加了10英镑的稻壳。在20 wt%的情况下,拉伸强度从25英寸MPa上升到30 MPa,弯曲模量从2.0 GPA增加到2.5 GPA,撞击耐药性增加了15%。SEM确认了良好的填充物分散和粘结。Xia等。17加强PLA/PCL可生物降解复合材料,具有5 wt%BioChar。在15 wt%的情况下,拉伸强度从45英寸MPA增加到58 MPa,弯曲模量从1.8 GPA增加到2.3 GPa,而Break时的伸长率则增加了12%。SEM图像表明均匀的色散和强烈的界面粘附。Botta等。18从生物质热解衍生成可回收的PLA中,增加了1-5 wt%的生物炭,使模量增加了20%。MaliåSka等。19将5届15 wt%生物炭掺入用于园艺应用的生物塑料中,在10 wt%的情况下,拉伸强度从22英里MPa增加到28 MPa,而休息时的伸长率则从8%提高到12%。乔治等。20增强PLA/PBAT(80/20)与1 wt%Pinewood Biochar混合。在1 wt%时,拉伸强度增加了53%。SEM分析证实了良好的填充物分散和粘附。Zouari等。21调查了具有0英尺20 wt%Biochar的PLA和PLA 30%的大麻纤维复合材料。在PLA中,有5 wt%的生物炭将拉伸模量从2418的MPA升高至3334 MPa,而无需损害强度(〜37 mpa),而较高的含量降低了性能。在PLAâHF复合材料中,5英寸10%的生物炭从5158的MPA提高到5841 MPa,而拉伸强度则从44(MPA)到51 MPa。乔治等。22用椰子壳生物炭(CCB)为1 wt%和10 wt%的制造的PLA/PBAT(80/20)复合材料。在1 wt%时,拉伸强度从〜37 mpa上升到〜54 µMPa(+45%),模量从〜〜1.8 GPA增加到〜2.12 GPA(+18%)。
几项研究使用农业和植物性废物作为基于多乳酸(PLA)的复合材料的填充物进行了研究,以增强其机械性能,以实现环保和工程应用。已经探索了诸如稻壳,大麻纤维,开心果壳生物炭,椰子壳生物炭(CCB),蛋壳粉和其他生物char之类的材料,椰子壳的生物char(Coco Char)因其丰富的可用性而引起了椰子壳的生物char(Coco Char),因此具有较高的可用性,低成本,固定的碳含量低,固定碳含量高,并具有较高的碳含量,并具有较高的碳质量,并且具有较高的碳含量,并且具有强大的增强功能,并且具有较高的碳化力。除了选择填充剂之外,处理方法严重影响复合性能。注射成型由于其精确性和可扩展性而被广泛用于PLA,但诸如温度,速度,压力和填充物等参数强烈影响最终特性,需要系统优化。Taguchi的实验设计提供了一种资源有效的方法来识别重要因素,而机器学习捕获了复杂的非线性相互作用以进行准确的预测。它们的整合确保了效率和鲁棒性,而CCB通过将农业废物带入可生物降解的复合材料来进一步增强了环境可持续性。
材料和方法材料
密度范围为1.20至1.30 g/cc的颗粒酸(PLA)颗粒,以及以G/10分钟指定的熔体流量指数(MFI),来自印度Banka Bioloo Limited。
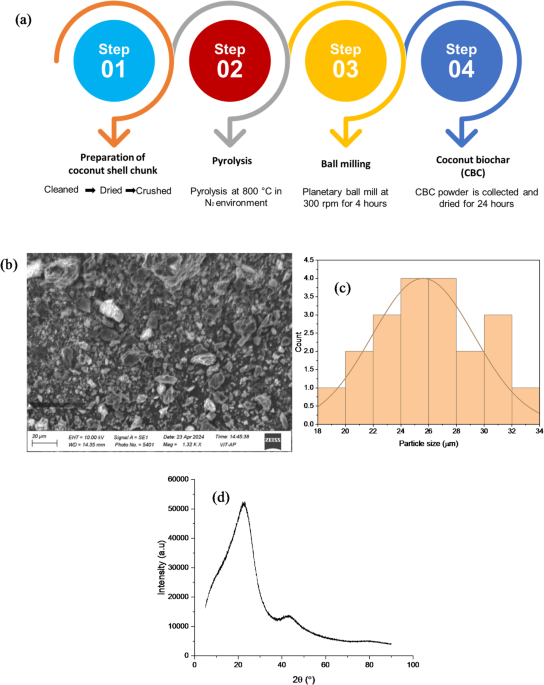
椰子壳生物炭(CCB)用作加固填充物,通过图中所示的过程制备了。 1。首先在氮(Nâ)气氛下在800°C下清洗,干燥和硫化椰子壳,该壳在壳中产生惰性环境,以防止壳壳在壳中的热分解过程中氧化和燃烧。所得的char被接地,随后以300 rpm的速度磨碎了4 h,球与粉的重量比为10:1。为了去除任何水分含量,将炭放在烤箱中24 h23。SEM分析,如图所示 1B在收集的炭上进行,以分析CCB粉末的形态,并注意到不规则的多孔颗粒。相反,粒度分析(图 1c)确认平均粒径为25英寸。图中显示的CCB粉末的XRD图案。 1d并注意到22°22°°(2区)的宽峰,归因于(002)碳的(002)平面,以及43°45°°(2î假)较弱的驼峰,对应于部分有序的碳结构。缺乏锋利的结晶峰证实了其主要无定形碳性质24。图1((

)合成过程;((b)SEM形态;((c)粒度分布直方图;((d)XRD分析CCB粉末。Taguchi实验设计在准备样品之前,采用了实验方法(DOE)方法来评估多个处理参数的影响,同时最大程度地减少实验试验的总数。
这项研究选择了四个关键的注入成型参数 - 组成,注入温度,注入速度和注入压力 - 每个级别都在三个级别上变化,如表中所述
125。l27正交阵列是使用Minitab 2021软件生成的,以系统地安排这些参数的组合,如表中所示 2和3。这种结构化的实验设计可确保对可变效应的平衡分析,同时优化时间,精力和物质资源26,,,,27。
样品制备
如图2所示,使用聚合物(PLA)作为基础聚合物(CCB)制造复合和纯PLA样品作为基础聚合物,如图所示。 2。制造过程始于使用高精度平衡(日本Shimadzu ATX-224)精确称重PLA和CCB。为了确保均匀的分散体,CCB首先悬浮在乙醇中并进行超声处理。然后将PLA颗粒逐渐引入CCB乙醇悬浮液中,同时连续搅拌磁热板以促进均匀混合。随后将混合混合物在70°C的真空烤箱(GR-58,纳米TEC,印度纳米TEC)中干燥24小时,以去除乙醇和残留水分。使用半自动水平注射机(Deesha ImpexPvt。Ltd.,India)处理干燥的材料。根据ASTM标准标准制备测试样品,PLA和纯PLA的填充负荷为5 wt%和10 wt%。在成型过程中,关键处理参数组成,注入温度,注入速度和注入压力是系统的变化,如表中所示 127,,,,28。图2

机械测试
拉伸测试
使用通用测试机(UTM,Model H10KL,Tinius Olsen IndiaPvt。Ltd.,India)根据ASTM D638标准评估注射型标本的拉伸性能。
根据L27正交阵列设计制备的样品以2 mm/min的恒定应变速率进行单轴拉伸载荷,以确定其拉伸强度和年轻的模量。为了确保结果的准确性和可重复性,每次测试一式三份进行,并报告了平均值。
扫描电子显微镜
在进行拉伸测试之后,使用扫描电子显微镜(德国Zeiss Evo 10,德国)分析了样品的断裂表面,以研究破坏机理和表面形态。在SEM检查之前,将断裂的表面用薄薄的金覆盖以提高表面电导率,并在适当的加速电压条件下成像29,,,,30。
硬度测试
Vickers硬度测试广泛用于评估材料对塑性变形的抗性,特别适用于聚合物及其复合材料。该技术利用面部角度为136°的钻石形的锥体凹痕,将其压入受控载荷下的材料表面。本研究使用Micro Vickers硬度测试仪(MC-AT,Fine Spavy Associates&EngineersPvt。Ltd.,India)测量了纯PLA及其复合材料硬度E384。将0.5 kg的微观识别负荷施加到每个样品的时间为10 s的时间为1031,,,,32,,,,33。去除载荷后,使用光学显微镜测量了结果压痕的对角线,并使用等式计算硬度值(HV)。1)34。所有测量均在室温下进行,并报告每个样品的三个压痕的平均值以确保准确性和一致性。
$$ \:\ text {h} \ text {v} \ hspace {0.17em} = \ hspace {0.17em} 2 \ frac {\ text {p \:sin} \ frac {\ text {136}} {\ text {2}}}}}} {{\ text {x}}}}^{\ text {2}}}} $$
(1)
在这里,HV是Vickers硬度,P是KGF中的施加载荷,而X是两个对角线的平均长度。
静态分析
Taguchi分析
在样品制备阶段应用Taguchi方法,以研究选定的加工参数对PLA和CCB增强复合材料的机械性能的影响,包括拉伸强度,Young的模量和硬度。根据Taguchi L中指定的组合制造标本27正交阵列,允许基于实验的预定义设计(DOE)对关键参数的系统变化。这种方法提供了一个有效且统计上可靠的实验框架,该框架减少了所需的试验,同时有效地捕获了影响机械性能的关键因素之间的相互作用。复制每个实验条件以确保结果的一致性和可靠性。随后使用信噪比(S/N)比率分析了测得的响应,采用了较大的IS-better标准,如表中所示 2和3并使用等式计算(2)35,确定改进机械性能的最佳处理条件。
$ \:\ frac {\ text {s}} {\ text {n}} \:\ text {r} \ text {a} \ text {a} \ text {t} \ text {t} \ text {i} \ text {i} \ text {o} = -10 {log text {log} {log}}}t [\ frac {1} {\ text {k}} \ sum \:_ {\ text {i} = 1}^{\ text {k}} \ frac {1} {1} {1} {{{\ text {c}}} _ {\ text _ {\ text {\ text {\ text {\ wext {\ i}}}}
(2)
方差分析(方差分析)
除了Taguchi信噪比(S/N)比分析外,还进行方差分析(ANOVA),以统计评估每个处理参数对PLA和CCB-Reinforced Composites的机械性能的显着性和贡献。ANOVA通过比较Minitab 2021进行比较,确定对输出响应的统计学意义影响的因素,包括拉伸强度,年轻的模量和硬度。P值小于0.05的参数在95%的置信度下被认为具有统计学意义。这种统计评估通过增强通过信噪比分析建立的最佳处理条件的可靠性来补充Taguchi方法36,,,,37。
机器学习
机器学习(ML)是一种越来越多地用于优化材料机械性能的现代技术,具有与传统试验和纠正方法相比的重要优势。ML模型预测并优化了从实验中得出的结果,同时大大减少了所需的工作。通过捕获复合物,处理参数与机械响应之间的非线性关系,ML为材料设计和过程优化提供了有效的指导。在这项研究中,采用ML方法来优化PLA和CCB增强复合材料的注射成型过程参数。使用Taguchi实验设计生成的数据集用于使用带有Python库的Google Colab开发和评估回归模型,例如Scikit-Learn,XG-Boost,Pandas和Numpy。在下一节中详细讨论了应用的特定ML算法38。使用标准评估指标评估模型性能,包括平均平方误差(MSE),均方根误差(RMSE),相对RMSE(RRMSE),平均绝对误差(MAE),平均绝对百分比误差(MAPE)和确定系数(R2)。这些指标是使用等式计算的(3) - (8)39,,,,40,,,,41。
$$ \:{\ text {r}}^{2} = 1- \ frac {\ sum \ \:_ {\ text {i} = 1} = 1}^{\ text {k}} {{(\ text {c}} _ {\ text {i}}} - {\ stackrel { - } {\ stackrel { - } {\ text {c}}}} _ {\ text {i}})}}^{2}}} {\ sum \ \:_ {\ text {i} = 1} = 1}^{\ text {k}}} {{{(\ text {c}} _ {\ text {i}} - \ stackrel { - } {\ text {c}})}}^{2}}} $$
(3)
$ \:\ text {m} \ text {s} \ text {e} = \ frac {1} {\ text {k}}} \ sum \ \:_ {\ text {i} = 1} = 1}^{\ text {k}} {{(\ text {c}} _ {\ text {i}}} - {\ stackrel { - } {\ text {c}}}} _ {\ text} _ {\ text {\ text {i}}}}}}}}}^{2}^{2} $$
(4)
$ \:\ text {r} \ text {m} \ text {s} \ text {e} = \ sqrt {\ text {\ text {m} \ text {s} \ text {s} \ text {e}}} = \ \ \:\:\:\:\:\:sqrt {{{(\ text {c}} _ {\ text {i}} - {\ stackrel { - } {\ text {c}}}} _ {\ text} _ {\ text {i}}}}}}^}}}} $ $
(5)
$ \:\ text {r} \ text {r} \ text {m} \ text {s} \ text {e} = \ frac {\ text {\ text {r} \ text {m} \ text {s} \ text {e}}} {\ stackrel { - } {\ text {o}}}} = \ frac{\ sqrt {{{(\ text {c}} _ {\ text {i}}} - {\ stackrel { - }\ text {i}})}}^{2}}}}} {\ stackrel { - } {\ text {c}}}}} \:\ times \:\:\:\:100 $$
(6)
$ \:\ text {m} \ text {a} \ text {e} = \:\ frac {1} {\ text {k}} \ sum \ \:_ {\ text {\ text {i} = 1} = 1} = 1}^{^{\ text{k}} \ left | {\ text {c}} _ {\ text {i}}} - {\ stackrel { - } {\ text {c}}} _ {\ text} _ {\ text {\ text {i}}}}}}}} \ right | $ $ $ $ $ $
(7)
$ \:\ text {m} \ text {a} \ text {p} \ text {e} = \:\ frac {1} {1} {\ text {k}}} \ sum \ \:_ {_ {\ text {text {c}} _ {\ text {i}} - {\ stackrel { - } {\ text {c}}} _ {\ text {i}}}}}} {{\ text} {{\ text {c}}}} _ {\ text _ {\ text}
(8)
在这里,k是试验的数量\(\:{\ Mathbf {C}} _ {\ Mathbf {i}}} \)和\(\:\ stackrel { - } {\ Mathbf {c}}} \)分别是实际值的实际值和平均值\(\:{\ Stackrel { - } {\ Mathbf {C}}}} _ {\ Mathbf {i}}} \)是预测的值。
线性回归
线性回归(LR)是一种基本的监督学习算法,用于通过将线性方程拟合到观察到的数据,用于模拟因变量与一个或多个自变量之间的关系,如等式中所示。9) 和 (10)42。在这项研究中,使用LR根据选定的处理参数来预测PLA及其复合材料的机械性能。该算法是通过最大程度地减少实际值和预测值之间的剩余平方总和来起作用的,从而提供了一个直接但有效的基线模型,用于比较更先进的机器学习技术的性能。
$ \:\ stackrel { - } {\ text {c}} = {\ text {l}} _ {0}+{\ text {l text {l}} _ {1} {\ text {\ text {r}}}}} _ {2} {\ text {r}} _ {2}+{\ text {l}} _ {3} {3} {\ text {r}} _ {3} _ {3}+{\ \ {\ text {l}}} _ {4} _ {4} {4} {4} {4} {4}
(9)
这里\(\:{\ text {r}} _ {1},\:{\ text {r}} _ {2},\:{\ text {r}} _ {3} _ {3},\:分别是组成,温度,注入速度和注入压力。和\(\:{\ text {l}} _ {0},\:{\ text {l}} _ {1} \),,,,\(\:{\ text {l}} _ {2},\:{\ text {l}} _ {3},\:\:\ text {a} \ text {n} {n} \ text {d text {d}是模型系数。模型系数估计:
$ \:\ stackrel { - } {\ text {l}} = {\ left({\ text {q}}}^{\ text {t text {t}} \ text {q} {q} \ right)}
(10)
在这里,Q是缩放的输入参数矩阵,C是缩放的输出参数,例如拉伸强度,年轻的模量和硬度。
支持向量回归(SVR)
支持向量回归(SVR)是一种机器学习算法,该算法源自支持向量机(SVM)的原理,旨在预测连续结果。
它通过确定在指定的误差边距(无敏感区)中近似数据的函数,同时保持模型的复杂性尽可能低。在这项研究中,SVR用于预测PLA及其复合材料的机械性能,采用内核函数来捕获输入变量和输出响应之间的线性和非线性关系。其中,径向基函数(RBF)内核被广泛用于处理非线性数据的灵活性和有效性。基础概念和表述在式中介绍。(11),((12), 和 (13)43。
$ \:\ text {f} \ left(\ text {q} \ right)= {\ text {w}}}^{\ text {t}} \ text} \ text {q}+\ text+\ text {b} $$
(11)
这里,\(\:\ text {q} \:\ text {i} \ text {s} \:{\ left [\ text {c} \ text {c} \ text {o} \ text {m} \ text {p} \ text {o} \ text {s} \ text {i} \ text {t} \ text {i} \ text {i} \ text {o} \ text{n},\:\ text {t} \ text {e} \ text {m} \ text {p} \ text {e} \ text {e} \ text {r} \ text {a}\ text {t} \ text {u} \ text {r} \ text {e},\:\ text {i} \ text {n} \ text {n} \ text {j} \ text {e} \ text {c} \ text {t} \ text {i} \ text {o} \ text {n} \:\ text {s} {s} \ text {p text {p}\ text {e} \ text {e} \ text {d},\:\ text {i} \ text {n} \ text {j} \ text {j} \ text {e} \ text {c} \ text {t} \ text {i} \ text {o} \ text {n} \:\ text {p} \ text {p} \ text {r} \ text {e}\ text {s} \ text {s} \ text {u} \ text {r} \ text {e} \ right]}^{\ text {t text {t}}} \:\)是输入向量,\(\:\ text {w} \)是重量向量,b是偏差项,并且\(\:{\ text {w}}}^{\ text {t}} \ text {q} \)是点产品\(\:\ text {w} \)和\(\:\ text {q} \)。
不敏感的损失函数是:
$ \:\ text {l} \ left(\ text {C},\:\ text {f}\:\:\:\:\:\:\:\:\:\:\:\:\:\:\:\:\:\:\:\:\:\:\:\:\:\:\:\:\:if \:\:\:\ left | \ teXT {c} - \ text {f} \ left(\ text {q} \ right)\ right | <{\ text {\ euro。\:\:\:\:\:\:\:\:\:\:\:\:\:\:\:\:\:\:\:\:\:\:wise \:wise \:\ end end {arnay} \:\:\:\:\:\:\ right。$ $ $
(12)
在这里,y是实际的输出变量(拉伸强度,年轻的模量和硬度),\(\:\ text {f} \ left(\ text {q} \ right)\)\)是预测的输出功能,\({\ text {\ euro}} \)\)是对依氏丝肌不敏感的边缘(公差区)。
客观优化是:
$$ \ begin {收集} \ mathop {\ hbox {min}} \ limits _ {{{{\ text {w}},{\ text {〜b}},{\ text {〜d text {〜d}}}{\ frac {1} {2} {{{{\ text {w}}^2}+{\ text {c}} \ Mathop \ sum \ sum \ limits _ {{{{\ text {i}} = 1} = 1}}}}}}}}{{{\ text {d}} _ {\ text {i}}}}}}+{{{\ text {d}}}^{\ text {*}}}}} _ {{\ text {\ text {i}}}}}}}}}}}}}}}}}}} \ right){{{\ text {c}} _ {\ text {i}}}} - {{{\ text {w}}}^{\ text {t text {t}}}} {{\ text {q^}}}{\ text {\ euro}}}+{{\ text {d}} _ {\ text {i}}}} \ hfill \\ \\{{{\ text {w}}^{\ text {t {t}}}} {{\ text {q}} _ {\ text {\ text {i}}}}}}}}}}}+{\ text {b}}}} - {\text{\euro }}+{{\text{d}}^{\text{*}}}_{{\text{i}}} \hfill \\{{{\ text {d}} _ {\ text {i}}}},{{{\ text {d}} _ {\ text {i}}}}}}^{{\ text {\ text {*}}}}}}}} \ geqslant 0 \ hfill \ hfill \ hfill \ hfill \ hfill \ \ \ \ \ \ \ \\
(13)
这里\(\:{\ text {d}} _ {\ text {i}},{{{\ text {d}} _ {\ text {i}}}}}}–超出正面和负面偏差的松弛变量\({\ text {\ euro}} \)\),câ是控制错误惩罚的正规化参数,而kâ是数据点的总数。
随机森林回归(RFR)
随机森林回归(RFR)是一种用于回归任务的广泛使用的机器学习算法,其高精度,鲁棒性以及在输入特征和目标变量之间建模复杂关系的能力。它在处理非线性数据并降低过度拟合的风险方面特别有效。作为一种合奏学习技术,RFR通过结合多个决策树的输出来提高预测性能。每棵树在训练数据的自举子集上进行训练,并考虑每种拆分处的输入特征的随机选择,从而增强了模型的鲁棒性和泛化能力。基础方法由eq表示(14) 和 (15)44。
通过以下方式定义数据集
$ \:\ text {d} = \ left \ {\ right({\ text {q}}} _ {\ text {i}},{\ text {c}} _ {\ text {i}} \ left)\ right \} \ genfrac {} {} {} {0pt} {} {} {\ text {k}}} {\ text {i} = 1} $$
(14)
这里\(\:{\ text {q}} _ {\ text {i}} \)是[成分,温度,注入速度,注入压力],并且\(\:{\ text {c}} _ {\ text {i}} \)是[拉伸强度,年轻的模量,硬度]。
对于给定的输入因子P,随机森林回归由K回归树组成。
\(\:{\ text {f}} _ {1} \ left(\ text {q} \ right)\)\),,,,\(\:{\ text {f}} _ {2} \ left(\ text {q} \ right),\:{\ text {f}} _ {3} \ left(\ text {q},……。\(\:{\ text {f}} _ {\ text {n}} \ left(\ text {q} \ right)\)\)\)预测输出\(\:\ stackrel { - } {\ text {c}}} \)作为单个树预测的平均值
$ \:\ stackrel { - } {\ text {c}}} \ left(\ text {q} \ right)= \ frac {1} {\ text {k}} \ sum \ sum \ sum \ \ sum \ \ sum \:_ {\ text {n} = 1}^{\ text {n}} {\ text {f}} _ {\ text {n}} \ left(\ text {q} \ right)\:$ $
(15)
这里\(\:\ stackrel { - } {\ text {c}}} \ left(\ text {q} \ right)\)\)是输入P的预测值,n是森林中决策树的总数,并且\(\:{\ text {f}} _ {\ text {n}} \ left(\ text {q} \ right)\)\)\)是从\(\:{\ text {k}}}^{\ text {t} \ text {h}}} \)树。
梯度提升
梯度提升回归(GBR)是一种集成机器学习技术,专门针对涉及复杂和非线性关系的回归任务设计。它通过通过梯度下降来最大程度地构建纠正先前模型误差的预测模型来最大程度地减少所选损失函数。GBR将多个弱学习者(通常是浅决策树)结合在一起,成为一个强大的统一模型,从而提高了预测精度并降低了偏见。与随机森林依靠包装和训练决策树并行训练,GBR遵循了提升策略,在该策略中,模型是依次训练的,更加强调了最难预测的样本。这种方法使GBR特别适合建模受多处理参数影响的复合材料的机械性能。该方法的数学框架,包括加性模型和基于梯度的更新过程,在方程式中详细介绍了(16) 到 (19)45。
通过
$ \:\ text {d} = \ left \ {\ right({\ text {q}}} _ {\ text {i}},{\ text {c}} _ {\ text {i}} \ left)\ right \} \ genfrac {} {} {} {0pt} {} {} {\ text {m}}} {\ text {i} = 1} $$
(16)
这里\(\:{\ text {q}} _ {\ text {i}} \)是[成分,温度,注入速度,注入压力],并且\(\:{\ text {c}} _ {\ text {i}} \)是[拉伸力量,年轻的模量,硬度]
$ \:{\ text {f}} _ {\ text {m}} \ left(\ text {q} \ right)= \ sum \ \:_ {\ text {m} = 1} = 1}^{\ teXT {M}} {\ text {r}} _ {\ text {m}}} {\ text {h}} _ {\ text {m}}} \ left(\ text {q} {q} \ right)$$
(17)
对于梯度下降更新
$ \:{\ text {f}} _ {\ text {m}} \ left(\ text {q} \ right)= {\ text {f text {f}} _ {\ text {\ text {m} {m} -1} -1} -1} -1} -1} \ left(\ text {q} \ right)+{\ text {r}} _ {\ text {m}} {\ text {h}} _ {\ text {\ text {m}} \ left(\ text {q} {q} \ right)$$
(18)
这里\(\:{\ text {r}} _ {\ text {m}} \)是在每棵树上施加的学习率或权重,m是迭代的总数(树),并且\(\:{\ text {h}} _ {\ text {m}} \ left(\ text {q} \ right)\)\)\)是\(\:{\ text {m}}}^{\ text {t} \ text {h}}} \)\)学习者弱(决策树)。
hm经过训练以适合伪残基
$ \:{\ text {h}} _ {\ text {m}} \ ailt \:\:\:{\ text {r}} _ {\ text {\ text {i}}}= \ left [\ frac {\ partial \:\ text {l} \ left({\ text {c}} _ {\ text {i}},{\ text {f text {f}} _ {\ text {m} -1} \ left({\ text {q}} _ {\ text {i}}}} \ right)\ right)}}} {\ partial \ \:{{\ text {f}} _ {\ text {m} -1} \ left({\ text {q}}} _ {\ text {i}}} \ right)} \ right] \:$ $
(19)
这里\(\:{\ text {r}} _ {\ text {i}}}^{\ text {m}}} \)是促进迭代M时数据点I的伪淹没,\(\:{\ text {c}} _ {\ text {i}} \)是实际目标值,\(\:{\ text {f}} _ {\ text {m} -1} -1} \ left({\ text {q}} _ {\ text {\ text {i}}}} \ right)\)\)是从模型进行的预测,在M字迭代之后,\(\:\ partial \:\ text {l} \ left({\ text {c}}} _ {\ text {i}},{\ text {f}} _ {\ text {m} -1} \ left({\ text {q}}} _ {\ text {i}}} \ right)\ right)\)\)是损耗函数(例如,平均误差)。
极端梯度提升(XG-Boost)
在学术研究和工业应用中,极端梯度提升(XG-BOOST)是一种高效且广泛采用的机器学习算法,以其可伸缩性,正则化功能和强烈的过度拟合性而认可。与常规的梯度提升技术不同,XG-Boost通过将L1和L2正则化项纳入其损耗函数,改善概括并控制模型复杂性来增强模型性能。在这项研究中,将XG-Boost应用于模型并预测PLA/CCB复合材料的机械性能 - 抗拉力强度,幼小的模量和硬度,具有组成,温度,注入速度和注入压力,并用作输入变量。该算法通过最小化正规目标函数来建立回归树的集合,如等式所述20) 和 (21)46,,,,47。
$ \:\ text {l} \ left(\ text {t} \ right)= \ sum \ \:_ {\ text {i} = 1} = 1}^{\ text {n}} \ left(\ text {\ text {l}l { - } {\ text {c}}} _ {\ text {i}}}}}}^{\ text {t}})+\ sum \ \:_ {\ text {m text {m} = 1}^{\ text {t}}} {\ upphi \:} \ left({\ text {f}} _ {\ text {m}}} \ right)$$
(20)
$ \:{\ upphi \:} \ left(\ text {f} \ right)= {\ upbeta \:} \ text {t}+\ frac {1} {1} {2} {2} {\ updElta \ felta \:} {} {\:} {\ up}
(21)
这里\(\:\ text {l} \)是一个可区分的损失函数,\(\:{\ text {f}} _ {\ text {m}}} \:\)represents an individual regression tree at iteration\(\:\text{m}\),,,,\(\:\text{T}\)is the number of leaves in the tree,\(\:{\upomega\:}\)is the vector of scores on leaves, and\(\:{\upbeta\:},\:{\updelta\:}\:\)are regularization parameters that penalize model complexity.
结果与讨论
机械测试
Tensile strength and young’s modulus
The tensile strength and Young’s modulus of PLA/CCB composites were evaluated using an L27orthogonal array designed through the Design of Experiments (DOE) approach, as shown in Table 2。Figure 3presents the variations across experiments 1 to 27. The minimum tensile strength was observed at Experiments 7–9 with 1.27–2.5 MPa for pure PLA.Similarly, experiments 19–21 exhibit a maximum tensile strength of 54.6-60.99 MPa for 10 wt% PLA/CCB composites.A similar trend was observed for Young’s modulus;experiments 25–27 and 19–21 exhibit a minimal of 105–110 MPa and a maximum of 2652–3561, respectively.These findings demonstrate that both tensile strength and Young’s modulus of PLA/CCB composites are significantly enhanced by increasing the CCB filler content and optimizing the processing conditions, particularly temperature, injection speed, and pressure.

Tensile strength and Young’s modulus vs. experiment number.

Fractography of (一个) Pure PLA;((b) 10 wt% PLA/CCB composite.
Figure 4a and b illustrates the fractured surface morphology of pure PLA and PLA/CCB composites after tensile test, revealing differences in their failure behavior.Figure 4a shows the fracture surface of pure PLA, which appears smooth, continuous, and homogeneous, characteristic of a relatively ductile fracture48。In contrast, Fig. 4b displays the fractured surface of the PLA composite reinforced with 10 wt% CCB, exhibiting a rough, irregular texture with visible surface discontinuities.Incorporating rigid biochar particles disrupts the matrix continuity, creating localized stress concentrations that promote crack initiation and propagation, which is characterized by brittle fracture behaviour49。
Hardness testing
Figure 5illustrates the hardness of the PLA/CCB composites.Experiments 1–3 exhibit minimal hardness, ranging from 32.3 to 34 HV for pure PLA.However, the experiments 25–27 showed maximum hardness of 71.7 to 77 HV for composites with 10 wt% CCB.These findings clearly demonstrate that increasing the CCB content along with optimizing the processing conditions significantly enhances the hardness of the PLA/CCB composites.

Experimental hardness.
统计分析
Taguchi analysis
The experimentally obtained values of tensile strength, Young’s modulus, and hardness were used to calculate the corresponding signal-to-noise (S/N) ratios for the Taguchi analysis, as presented in Tables 2和3。The following sections discuss the optimization of the significant process parameters for each response variable based on the Taguchi method.
抗拉强度
Tables 4和5summarize the influence of varying process parameters on tensile strength, considering both the mean values and the larger-is-better signal-to-noise (S/N) ratio.The analysis reveals that composition is the most significant parameter, with the highest delta values of 16.47 and 31.02 for the mean and S/N ratio, respectively.Temperature follows as the second most influential parameter, with delta values of 13.32 and 30.821.In contrast, injection pressure with 3.72 and 6.245 and injection speed with 3.31 and 8.961 exhibit relatively lower delta values for both metrics, indicating a minimal effect on tensile strength.This analysis demonstrated that increasing filler content (composition) and processing temperature have a substantial positive impact on the tensile strength of the composites, while variation in injection pressure and speed has minimal effect.
Figures 6A和7a present the main effects plots for tensile strength based on the signal-to-noise (S/N) ratio and mean values, respectively.Both plots clearly demonstrate that composition and temperature are the most influential factors affecting tensile strength.From the graphs, it is evident that tensile strength significantly improves as the composition increases from neat PLA to 5% CCB.However, beyond this point, the improvement stabilizes.In the case of temperature, a decline in tensile strength is observed as the processing temperature increases from 135 °C to 155 °C.Additionally, injection pressure and injection speed exhibit moderate effects, displaying nonlinear behavior.In the S/N ratio plot, an increase in injection speed and a reduction in injection pressure lead to a decrease in tensile strength.In contrast, the mean response plot shows an opposite trend, where increasing both injection pressure and injection speed slightly enhances tensile strength.Overall, composition and temperature are confirmed as the most dominant parameters influencing tensile strength, while injection pressure and injection speed have comparatively lesser effects.

Mean of S/N ratio for (一个) 抗拉强度;((b) Young’s modulus;((c) hardness.

Mean of means for (一个) 抗拉强度;((b) Young’s modulus;((c) hardness.
Young’s modulus
Tables 6和7present the influence of process parameters on Young’s modulus, considering both the mean values and the larger-is-better signal-to-noise (S/N) ratio.The analysis indicates that temperature is the most significant factor affecting Young’s modulus, as reflected by its highest delta values of 12.57 for the S/N ratio and 1300 for the mean.Following this, injection speed, injection pressure, and composition show progressively lower influences, with delta values of 8.43 and 918.9, 8.26 and 894.9, and 1.72 and 885.0, respectively.These results suggest that increasing the processing temperature substantially enhances Young’s modulus, while the effects of injection speed, pressure, and composition are comparatively less pronounced.
The main effects plots for both the signal-to-noise (S/N) ratio and mean values of Young’s modulus are presented in Figs. 6乐队7b。These plots demonstrate that temperature is the most influential factor among all process parameters.Both the S/N ratio and mean response attain their highest values at 135 °C, indicating that this temperature level provides the most robust performance, reinforcing its dominant effect on Young’s modulus.Injection speed emerges as the second most significant factor, with both plots identifying 50 mm/s as the optimal level for achieving better robustness.However, the slightly lower mean response at this setting suggests a trade-off between performance consistency and modulus value.Composite content also contributes notably, where 5% CCB content offers better robustness, while 10% CCB yields the highest mean modulus.Injection pressure, on the other hand, shows the least influence, with minimal variation across different levels, although 40 MPa demonstrates a marginally better performance.
硬度
The hardness of PLA/CCB composites under different processing parameters was evaluated using the signal-to-noise (S/N) ratio and mean values, as summarized in Tables 8和9。The analysis indicates that composition is the most influential factor, with the highest delta values of 4.80 for the S/N ratio and 26.79 for the mean ranked as 1. Temperature is the second most significant factor, exhibiting delta values of 1.73 (S/N ratio) and 10.66 (mean).Injection pressure ranks third, with delta values of 0.95 (S/N ratio) and 6.89 (mean), while injection speed shows the least influence, with the lowest delta values of 0.54 (S/N ratio) and 5.19 (mean).Overall, this summary demonstrates that composition has the most dominant effect on enhancing the hardness of PLA/CCB composites, whereas injection speed contributes minimally, highlighting the dominant role of filler content and processing temperature in enhancing the mechanical performance of PLA/CCB composites.
Figures 6C和7c present the main effects plots for both the signal-to-noise (S/N) ratio and mean values, illustrating the influence of process parameters on the hardness of PLA/CCB composites.These plots show that an increase in composition has the most significant effect on hardness.Temperature and injection pressure show a moderate influence, while injection speed has the least effect.This trend indicates that composition is the dominant factor governing hardness, followed by temperature, injection pressure, and injection speed.The consistent patterns observed in both the S/N ratio and mean response plots further confirm the reliability and validity of this analysis.
Analysis of variance (ANOVA)
Tensile testing
The ANOVA results presented in Table 10indicate that the injection molding process parameters statistically affect the tensile strength of PLA/CCB composites, as evidenced by a P-value of 0.000 (p < 0.001).This confirms a highly significant influence of the selected process parameters and composition on tensile strength.Among these, composition and temperature were the most impactful factors, contributing 50.43% and 42.67%, respectively.In comparison, injection speed and injection pressure contributed relatively less, at 3.86% and 1.82%, respectively.The remaining 1.22% was attributed to experimental error, suggesting excellent process control and repeatability.Additionally, the regression analysis demonstrated a strong correlation between tensile strength and the process parameters.The model showed a high goodness of fit, with a coefficient of determination (R2) of 98.78% and an adjusted R2of 98.23%, indicating the model’s high accuracy, reliability, and suitability for predicting tensile strength outcomes based on the chosen parameters.Regression Eq. $$\begin{gathered} {\text{TS}}\,=\,{\text{27}}.{\text{664}}\, -
\,{\text{19}}.{\text{338}}{{\text{F}}_{\text{1}}}+{\text{11}}.{\text{686}}{{\text{F}}_{\text{2}}
}+{\text{7}}.{\text{652}}{{\text{F}}_{\text{3}}}+{\text{16}}.{\text{452}}{{\text{T}}_{\text{1}}} \hfill \\ - {\text{2}}.0{\text{83}}{{\text{T}}_{\text{2}}} - {\text{14}}.{\text{369}}{{\text{T}}_{\text{3}}} - {\text{3}}.{\text{731}}{{\text{S}}_{\text{1}}} - {\text{1}}.{\text{499}}{{\text{S}}_{\text{2}}} \hfill \\ +{\text{5}}.{\text{23}}0{{\text{S}}_{\text{3}}} - {\text{3}}.{\text{548}}{{\text{P}}_{\text{1}}}+0.{\text{85}}0{{\text{P}}_{\text{2}}}+{\text{2}}.{\text{697}}{{\text{P}}_{\text{3}}} \hfill \\ \end{gathered}$$
(22)
Here, F1,f2,,f3: Composite levels (0%, 5%, 10%), T1,t2,,t3: Temperature levels (135 °C, 145 °C, 155 °C), S1,s2,,s3: Injection speed levels (50, 60, 70 mm/s), P1,p2,,p3: Injection pressure levels (30, 40, 50 bar), and TS: Tensile Strength (MPa).

Tensile strength prediction accuracy based on ANOVA model.
Figure 8presents a comparison between the experimentally measured tensile strength values and those predicted using the ANOVA-based regression equation (Eq. 22)。The comparison reveals that most of the experimental values fall within a 10% error margin, indicating strong agreement between the experimental results and the model predictions.For instance, tensile strength values around 17.5 MPa show minimal deviations of approximately ± 0.57%, while values near 5.6 MPa and 22.1 MPa have percentage errors of ± 2.41% and ± 8.6%, respectively.Similarly, measurements close to 38.95 MPa and 57 MPa exhibit even smaller errors of around ± 0.13% and ± 1.5%, confirming the high accuracy of the model.
However, a few data points show larger deviations.Tensile strengths near 15.9 MPa and 32.2 MPa exhibit higher percentage errors of ± 11.95% and ± 20.19%, respectively, slightly exceeding the 10% threshold and suggesting the need for further investigation.The largest deviation is observed for a value near 1.9 MPa, with an error of approximately ± 32.63%.Despite these few outliers, the majority of the data points demonstrate excellent predictive accuracy, underscoring the robustness and reliability of the regression model in capturing the influence of processing parameters on tensile strength.

Contour plot analysis for tensile strength on (一个) composition and temperature;((b) composition and injection speed;((c) composition and injection pressure.The contour plots presented in Fig.Â
9illustrate the combined effects of two process parameters on the tensile strength of PLA/CCB composites, while keeping the other parameters constant.In Fig. 9a, the interaction between composition and temperature reveals that higher tensile strength values (above 60 MPa, shown in red) are achieved when the composition ranges between 4% and 8% and the processing temperature lies between 135 °C and 145 °C.Conversely, lower tensile strength values (below 30 MPa), represented by blue regions, occur at low filler content combined with higher temperatures.Figure 9b depicts the interaction between composition and injection speed, showing that maximum tensile strength is obtained when the composition is between 5% and 9% and the injection speed ranges from 60 to 65 mm/s.Regions of lower strength (less than 30 MPa) are observed at both the lower and higher ends of composition and injection speed, appearing as dark and light blue zones.In Fig. 9c, the combined effect of composition and injection pressure indicates that tensile strength exceeds 60 MPa (highlighted in red) when the composition is above 6% and the injection pressure is maintained between 35 and 45 bar.Low-strength areas are predominantly located in regions with lower composition and lower pressure values.The color gradients, ranging from dark blue (lowest strength) to red (highest strength), effectively demonstrate how optimizing these process parameters can enhance the mechanical performance of PLA/CCB composites.

Interaction plot for tensile strength.
Figure 10presents the interaction plots, illustrating how factors such as composition, temperature, injection speed, and injection pressure interactively influence the tensile strength of PLA/CCB composites.For example, in the plot comparing temperature and composition, the tensile strength increases from approximately 10 to over 50 MPa at 135 °C as the filler content rises from 0% to 10%.However, this trend reverses at higher temperatures;at 155 °C, increasing the composite content causes the tensile strength to drop from around 45 MPa to below 20 MPa, highlighting a significant interaction between these two parameters.Similarly, the subplot of injection speed versus injection pressure shows that tensile strength peaks at an injection speed of 60 mm/s and a pressure of 40 bar, while deviating from this combination results in a sharp decline, indicating the presence of non-linear interactions.The presence of non-parallel lines in most plots further confirms that the effect of one factor is heavily dependent on the level of another.These findings underscore the importance of considering parameter interactions collectively when optimizing processing conditions, rather than evaluating factors in isolation.
Young’s modulus
The ANOVA results summarized in Table 11indicate that the injection molding process parameters have a statistically significant effect on the Young’s modulus of PLA/CCB composites, as evidenced by a P-value of 0.000 (p < 0.001).This confirms a highly significant influence of both the process parameters and composition on the stiffness of the composites.Among these factors, temperature and composition were identified as the most influential, contributing 38.58% and 20.14%, respectively.Injection speed and injection pressure also had notable effects, with contributions of 19.17% and 18.41%, respectively.Only 3.72% of the variation was attributed to experimental error, indicating excellent process control and repeatability.In addition, the regression model demonstrated a strong relationship between Young’s modulus and the process parameters.The model showed a high degree of accuracy and reliability, with a coefficient of determination (R2) of 97.95% and an adjusted R2of 97.24%, confirming that the selected process parameters provided a good predictive fit for estimating the Young’s modulus of PLA/CCB composites.Table 11 Analysis of variance (ANOVA) for young’s modulus of PLA/CCB composites.Regression Eq.Â
{\text{349}}.0{{\text{F}}_{\text{2}}}\,+\,{\text{536}}.0{{\text{F
}}_{\text{3}}}\,+\,{\text{678}}.{\text{4}}{{\text{T}}_{\text{1}}} \hfill \\ - {\text{56}}.0{{\text{T}}_{\text{2}}}\, - \,{\text{622}}.{\text{4}}{{\text{T}}_{\text{3}}}\, - \,{\text{19}}.{\text{6}}{{\text{S}}_{\text{1}}} - {\text{449}}.{\text{6}}{{\text{S}}_{\text{2}}}\, \hfill \\ +\,{\text{469}}.{\text{2}}{{\text{S}}_{\text{3}}} - {\text{477}}.{\text{8}}{{\text{P}}_{\text{1}}}+{\text{417}}.{\text{1}}{{\text{P}}_{\text{2}}}+{\text{6}}0.{\text{7}}{{\text{P}}_{\text{3}}} \hfill \\ \end{gathered}$$
(23)
Here, F1,f2,,f3: Composite levels (0%, 5%, 10%), T1,t2,,t3: Temperature levels (135 °C, 145 °C, 155 °C), S1,s2,,s3: Injection speed levels (50, 60, 70 mm/s), P1,p2,,p3: Injection pressure levels (30, 40, 50 bar), and YM: Young’s modulus (MPa).
Figure 11compares the experimentally obtained Young’s modulus values with those predicted by the ANOVA-based regression Eq. (23)。The percentage errors between the predicted and actual values were calculated to assess the model’s accuracy.Overall, most deviations fell within an acceptable range, confirming the strong predictive capability of the regression model.For instance, predicted values around 1115.79 MPa exhibited percentage errors between ± 3.88% and ± 14.09%, while predictions near 846.26 MPa showed errors ranging from ± 3.04% to ± 8.14%.Similarly, for values around 1062.41 MPa and 708.21 MPa, the deviations remained within ± 10%.Even at higher modulus values such as 3222.63 MPa, the model maintained reasonable accuracy, with errors ranging from ± 7.18% to ± 17.71%.Notably, for the lowest predicted modulus value of 107.97 MPa, the percentage error was as low as ± 0.03%.These findings confirm the reliability and robustness of the ANOVA-based regression model in accurately estimating Young’s modulus across a broad range of processing conditions for PLA/CCB composites.

Young’s modulus prediction accuracy based on ANOVA model.

Contour plot analysis for Young’s modulus on (一个) composition and temperature;((b) composition and injection speed;((c) composition and injection pressure.The contour plots in Fig.Â
12illustrate the combined effects of two process parameters on the Young’s modulus of PLA composites reinforced with CCB, while keeping the other parameters constant.In Fig. 12a, the interaction between composition and temperature shows that Young’s modulus significantly improves at higher filler contents, particularly above 7%, and at lower processing temperatures between 135 °C and 140 °C, where modulus values exceed 3000 MPa (represented by the red zone).In contrast, most of the plot remains dark blue, indicating modulus values below 1500 MPa, especially at lower compositions and higher temperatures.Figure 12b displays the combined effect of composition and injection speed, where moderately high modulus values (ranging from 2000 to 3000 MPa, shown in light red to red shades) are observed at higher compositions (8–10%) and injection speeds around 65 mm/s.However, a large portion of the plot remains blue, representing modulus values below 2000 MPa.In Fig. 12c, the interaction between composition and injection pressure reveals that Young’s modulus exceeds 3000 MPa when the composition is above 8% and the injection pressure is maintained between 40 and 45 bar.Similar to the other plots, the majority of this contour remains in the lower blue regions, indicating values under 2000 MPa.The color gradient, ranging from dark blue (< 500 MPa) to dark red (> 3500 MPa), effectively highlights the positive influence of increased CCB content and optimized processing parameters on enhancing the stiffness of PLA/CCB composites.

Interaction plot for Young’s modulus.
Figure 13presents the interaction plots, demonstrating how factors such as composition, temperature, injection speed, and injection pressure collectively influence the Young’s modulus of PLA/CCB composites.For instance, in the plot comparing temperature and composition, the Young’s modulus increases sharply from approximately 1200 MPa to over 3000 MPa at 135 °C as the filler content rises from 0% to 10%.However, this trend reverses at 155 °C, where increasing the composite content results in a sharp decline in modulus, dropping from around 1200 MPa to nearly zero, which clearly indicating a strong interaction between these two parameters.Similarly, in the injection speed versus injection pressure subplot, the Young’s modulus reaches its peak at an injection speed of 60 mm/s and a pressure of 40 bar but decreases considerably at other parameter combinations, highlighting the presence of non-linear interactions.The appearance of non-parallel and intersecting lines across multiple plots further confirms that the effect of one process factor is highly dependent on the levels of the others.These findings emphasize the necessity of considering the combined interactions among processing parameters when optimizing for maximum stiffness, rather than evaluating each factor in isolation.
硬度
The ANOVA results presented in Table 12indicate that the injection molding process parameters have a statistically significant effect on the hardness of PLA/CCB composites, as confirmed by a P-value of 0.000 (p < 0.001).This highlights a strong influence of both the selected processing parameters and composition on the hardness performance of the composites.Among these factors, composition emerged as the most dominant, contributing 78.23% to the total variation, followed by temperature with a contribution of 10.87%.Injection speed and injection pressure also had measurable, though comparatively smaller, effects, contributing 2.81% and 4.55%, respectively.The remaining 3.55% was attributed to experimental error, indicating good process stability and repeatability.In addition, the regression analysis demonstrated a strong correlation between hardness and the processing parameters.The regression model, represented by Eq. (24), confirmed its robustness, achieving a coefficient of determination (R2) of 96.45% and an adjusted R2of 94.87%.These values indicate high predictive accuracy and reliability in estimating the hardness of PLA/CCB composites under various processing conditions.
Regression EquationÂ
$$\begin{gathered} {\text{Hardness }}\left( {\text{H}} \right)={\text{46}}.0{\text{52}}\, - \,{\text{1}}0.{\text{485}}{{\text{F}}_{\text{1}}}\, - \,{\text{5}}.{\text{819}}{{\text{F}}_{\text{2}}}\,+\,{\text{16}}.{\text{3}}0{\text{4}}{{\text{F}}_{\text{3}}}\, - \,{\text{5}}.{\text{185}}{{\text{T}}_{\text{1}}}\, - \,0.{\text{285}}{{\text{T}}_{\text{2}}}\, \hfill \\ +\,{\text{5}}.{\text{47}}0{{\text{T}}_{\text{3}}}\, - \,0.{\text{9}}0{\text{7}}{{\text{S}}_{\text{1}}}\,+\,{\text{3}}.0{\text{48}}{{\text{S}}_{\text{2}}}\, - \,{\text{2}}.{\text{141}}{{\text{S}}_{\text{3}}}\,+\,{\text{3}}.{\text{559}}{{\text{P}}_{\text{1}}}\, - \,{\text{3}}.{\text{33}}0{{\text{P}}_{\text{2}}}\, - \,0.{\text{23}}0{{\text{P}}_{\text{3}}}.\hfill \\ \end{gathered}$$
(24)
Here, F1,f2,,f3: Composite levels (0%, 5%, 10%), T1,t2,,t3: Temperature levels (135 °C, 145 °C, 155 °C), S1,s2,,s3: Injection speed levels (50, 60, 70 mm/s), P1,p2,,p3: Injection pressure levels (30, 40, 50 bar), and H: Hardness (HV).
Figure 14presents a comparison between the experimentally measured and ANOVA-predicted hardness values for the PLA/CCB composites.The experimental hardness values ranged from 32.3 to 77, while the predicted values varied between 33.03 and 74.43.The percentage deviations between experimental and predicted results were generally below 10%, indicating strong agreement and high predictive accuracy of the regression model.For instance, an experimental hardness of 34 exhibited a deviation of approximately 2.96% from the predicted value of 33.03, while hardness values around 35.9 showed deviations close to 2.57%.Although a few data points displayed slightly higher deviations—such as an experimental value of 46.8 compared to a predicted 41.47—the majority of values remained well within acceptable limits.These findings confirm that the ANOVA-based regression model effectively captures the influence of processing parameters on the hardness of PLA/CCB composites and provides reliable predictions.This demonstrates the model’s practical value for process optimization, property prediction, and quality control in composite manufacturing.

Hardness prediction accuracy based on ANOVA model.

Contour plot analysis for hardness on (一个) composition and injection speed;((b) Composition and injection pressure;((c) composition and temperature.The contour plots in Fig.Â
15a–c illustrate the combined effects of two process parameters on the hardness of PLA composites reinforced with CCB, while keeping the other parameters constant.In Fig. 15a, the interaction between composition and injection speed reveals that hardness steadily increases as the CCB content exceeds 6%, reaching maximum values above 70 HV (indicated by dark red regions) at around 9–10% composition, largely independent of injection speed.Most of the lower composition region remains in light pink shades, representing hardness values below 50 HV.Figure 15b shows the combined effect of composition and injection pressure, where hardness values greater than 70 HV are achieved when the composition exceeds 8% and the injection pressure is maintained between 40 and 50 bar.In contrast, areas with composition below 6% consistently record hardness values under 50 HV.Similarly, Fig. 15c illustrates the interaction between composition and temperature, indicating that hardness exceeds 70 HV when the CCB content is above 8% and the processing temperature ranges between 140 °C and 150 °C.The color gradient, shifting from light pink (< 40 HV) to dark red (> 70 HV), consistently demonstrates that increasing CCB content has a pronounced positive effect on hardness across all processing conditions.Additionally, optimized ranges of injection speed, pressure, and temperature further enhance the material’s hardness performance, reinforcing the role of composition as the most dominant influencing factor.

Interaction plot for hardness.
Figure 16presents the interaction plots, illustrating how composition, temperature, injection speed, and injection pressure collectively influence the hardness of PLA/CCB composites.In the plot comparing temperature and composition, hardness increases consistently with both parameters.At 155 °C, raising the composite content from 0% to 10% results in a sharp rise in hardness from approximately 40 HV to nearly 80 HV, indicating a strong synergistic interaction between these two factors.In contrast, the plot for injection speed versus injection pressure displays a more complex relationship.Peak hardness is achieved at an injection speed of 60 mm/s and an injection pressure of 40 MPa, while other combinations produce more varied and less predictable responses.The presence of intersecting and non-parallel lines across the interaction plots confirms that the effect of one process parameter is highly dependent on the levels of the others.These trends emphasize that maximizing the hardness of PLA/CCB composites requires a simultaneous and balanced optimization of all processing parameters, rather than adjusting them in isolation.
机器学习
抗拉强度
Figure 17a–e compares the experimentally measured tensile strength values of PLA/CCB composites with predictions from various machine learning models, including Linear Regression, Support Vector Regression (SVR), Random Forest Regression, Gradient Boosting, and Extreme Gradient Boosting (XG-Boost).In each plot, colored dots represent the model’s predicted values, while a 45° reference line indicates perfect prediction accuracy.In Fig. 17a, the Linear Regression model, represented by blue dots, shows considerable deviations from the ideal line, reflecting its limited ability to capture the non-linear relationships within the data.This is further supported by its low R2value of 0.7965 and high error metrics: MSE of 76.53, RMSE of 8.75, MAE of 7.79, and MAPE of 69.87%.Figure 17b depicts the performance of the SVR model, shown with green dots.Here, predictions align more closely with the diagonal line, although some dispersion remains at the data extremes.The model delivers a significantly improved R2of 0.9829, with reduced errors: MSE of 6.45, RMSE of 2.54, MAE of 1.98, and MAPE of 18.68%.In Fig. 17c, the Random Forest model, represented by purple dots, displays even tighter clustering along the reference line, indicating further enhancement in prediction accuracy.It achieves an R2of 0.9857, MSE of 5.38, RMSE of 2.32, MAE of 1.64, and MAPE of 13.92%.Figure 17d presents the Gradient Boosting model, shown with orange dots, where predictions are closely aligned with the ideal line, reflecting excellent accuracy and generalization.This model records an R2of 0.9878, MSE of 4.60, RMSE of 2.15, MAE of 1.19, and MAPE of 6.67%.Figure 17e illustrates the XG-Boost model’s performance, with red dots almost perfectly aligned along the 45° line.It matches the performance of Gradient Boosting with an R2of 0.9878, MSE of 4.60, RMSE of 2.15, MAE of 1.19, and MAPE of 6.67%, confirming its exceptional predictive capability.Overall, these results highlight that ensemble-based models, particularly Gradient Boosting and XG-Boost deliver superior prediction accuracy and reliability for estimating tensile strength, outperforming simpler models like Linear Regression and SVR.

Comparison of actual vs. predicted tensile strength using machine learning models (一个) linear regression;((b) support vector regression (SVR);((c) random forest;((d) gradient boosting;((e) XG-boost.FigureÂ
18a–e presents the classification performance of various machine learning models — namely Linear Regression, Support Vector Regression (SVR), Random Forest Regression, Gradient Boosting, and XG-Boost — in predicting the tensile strength category of PLA/CCB composites based on their material behavior: brittle, semi-brittle, elastic, and highly elastic.In Fig. 18a, the Linear Regression model achieves a classification accuracy of 60.7%, correctly identifying 6 brittle, 3 semi-brittle, 2 elastic, and 6 highly elastic samples.However, several misclassifications are observed, including 1 brittle sample incorrectly classified as elastic, 2 semi-brittle samples misclassified as brittle and elastic, 1 elastic sample classified as brittle, 3 elastic samples as highly elastic, and 1 elastic sample again as highly elastic.In comparison, Fig. 18b–e display the classification results of SVR, Random Forest, Gradient Boosting, and XG-Boost models.Each of these models achieved a notably higher classification accuracy of 85.7%, correctly categorizing 6 brittle, 7 semi-brittle, 5 elastic, and 6 highly elastic samples.The few misclassifications observed included 1 semi-brittle sample classified as brittle, another semi-brittle as elastic, and 1 elastic sample classified as highly elastic.Overall, these figures collectively provide a clear comparison of the classification accuracy and predictive reliability of the tested models.Ensemble learning techniques like Random Forest, Gradient Boosting, and XG-Boost outperformed Linear Regression and SVR, consistently delivering higher classification accuracy across different material behavior categories.

Confusion matrix for machine learning model predicting tensile strength by (一个) linear regression;((b) support vector regression (SVR);((c) random forest;((d) gradient boosting;((e) XG-Boost.Young’s modulus
FigureÂ
19a–e compares the experimentally measured values of Young’s modulus with the predictions obtained from various machine learning models, namely Linear Regression, Support Vector Regression (SVR), Random Forest Regression, Gradient Boosting, and Extreme Gradient Boosting (XG-Boost).In each plot, the predicted values are represented by colored dots plotted against a 45° reference line, which signifies perfect prediction accuracy.As shown in Fig. 19a, the Linear Regression model (blue dots) exhibits noticeable deviations from the reference line, indicating its inability to effectively capture the inherent non-linear relationships present in the dataset.This limitation is evident from its relatively poor performance indicators: an R2of 0.622, MSE of 277,846.6, RMSE of 527.11, MAE of 410.78, and MAPE of 79.60%.In comparison, the SVR model illustrated in Fig. 19b with green dots shows improved alignment with the diagonal, although some dispersion remains.It achieves a notably higher R2value of 0.9562, along with considerably lower error metrics: MSE of 32,194.02, RMSE of 179.43, MAE of 118.87, and MAPE of 17.50%.Further improvement is observed with the Random Forest model in Fig. 19c (purple dots), where the predicted values cluster more tightly around the 45° line.This enhanced performance is reflected by an R2of 0.9579, MSE of 30,921.54, RMSE of 175.85, MAE of 123.73, and MAPE of 15.15%.The Gradient Boosting model, shown in Fig. 19d with orange dots, demonstrates even stronger predictive accuracy, with predictions closely following the ideal line.This model records an R2of 0.9628, MSE of 27,313.71, RMSE of 165.27, MAE of 105.25, and MAPE of 7.72%, indicating excellent generalization and minimal prediction errors.A comparable level of performance is achieved by the XG-Boost model, depicted in Fig. 19e with red dots.Its predicted values almost perfectly overlap the 45° line, and it records identical performance metrics to those of Gradient Boosting.Overall, the results clearly indicate that tree-based ensemble models—particularly Gradient Boosting and XG-Boost—are highly effective in capturing complex non-linear patterns within the data.This is critically important for reliably predicting the mechanical behavior of materials, which can be adversely affected by factors such as thermal degradation and molecular reorientation during the cooling phase.Accurate modeling of these effects is therefore essential to ensure optimal material performance and structural integrity.

Comparison of actual vs. predicted young’s modulus using machine learning models: (一个) linear regression;((b) support vector regression (SVR);((c) random forest;((d) gradient boosting;((e) XG-Boost.数字
20a–e presents the classification performance of various machine learning models in predicting Young’s modulus categories for different material types, including brittle, semi-brittle, elastic, and highly elastic.The models evaluated include Linear Regression, Support Vector Regression (SVR), Random Forest Regression, Gradient Boosting, and Extreme Gradient Boosting (XG-Boost).As shown in Fig. 20a, the Linear Regression model correctly classified 6 as brittle, 3 as semi-brittle, and 6 as highly elastic samples, while failing to identify any elastic samples.This resulted in an overall classification accuracy of 53.6%.The remaining samples were misclassified as follows: 1 as a brittle sample incorrectly labelled as elastic;2 as semi-brittle samples misclassified as brittle and elastic, respectively;1 as an elastic sample labelled as brittle;2 as elastic samples as semi-brittle;3 as elastic samples as highly elastic;and 1 as an additional elastic sample also misclassified as highly elastic.In contrast, the other four models—SVR, Random Forest Regression, Gradient Boosting, and XG-Boost—demonstrated significantly higher classification accuracies, each achieving 85.7%, as depicted in Fig. 20b–e.These models successfully identified 6 as brittle, 7 as semi-brittle, 5 as elastic, and 6 as highly elastic samples correctly.A few misclassifications were noted: one semi-brittle sample was wrongly classified as brittle, another as elastic, and one elastic sample was incorrectly labelled as highly elastic.In summary, these classification results highlight the superior predictive capability of tree-based ensemble models and SVR over Linear Regression for categorizing material behavior based on Young’s modulus.Accurate classification is essential for evaluating the structural response of materials under mechanical loads, particularly considering variations in material composition and processing conditions.

Confusion matrix for the machine learning model predicting Young’s modulus via (一个) linear regression;((b) support vector regression (SVR);((c) random forest;((d) gradient boosting;e) XG-Boost.
硬度
数字21a–e compares the predictions of several machine learning models with the experimentally measured hardness values.The models evaluated include Linear Regression, Support Vector Regression (SVR), Random Forest Regression, Gradient Boosting, and Extreme Gradient Boosting (XG-Boost).In each plot, the predicted values are represented by colored dots plotted against a diagonal reference line, which represents perfect prediction accuracy.As shown in Fig. 21a, the Linear Regression model (blue dots) displays considerable deviation from the reference line, reflecting its limited ability to model the non-linear relationships inherent in the dataset.This limitation is evident from its moderate performance metrics, with an R2of 0.8088, MSE of 33.35, RMSE of 5.775, MAE of 4.5956, and MAPE of 10.3%.The SVR model, illustrated in Fig. 21b with green dots, shows a marked improvement, with predictions more closely aligned to the reference line, though some dispersion persists.It achieves a higher R2of 0.9598, with substantially reduced error values: MSE of 7.004, RMSE of 2.6466, MAE of 2.1462, and MAPE of 4.87%.Further enhancement is observed in the Random Forest model, shown in Fig. 21c with purple dots, where the predicted values cluster more tightly around the diagonal.This model records an R2of 0.9638, MSE of 6.3173, RMSE of 2.5134, MAE of 1.9873, and MAPE of 4.4988%, indicating strong predictive accuracy.The Gradient Boosting model, represented by orange dots in Fig. 21d, delivers even better performance, with predictions closely following the reference line.It achieves an R2of 0.9645, MSE of 6.1958, RMSE of 2.4891, MAE of 1.9383, and MAPE of 4.4061%, confirming excellent prediction consistency and generalization capability.Similarly, the XG-Boost model, shown by red dots in Fig. 21e, achieves nearly identical performance to Gradient Boosting, with its predictions almost perfectly overlapping the reference line.Its comparable R2and error metrics further affirm its accuracy.Overall, these results clearly demonstrate that tree-based ensemble models—particularly Gradient Boosting and XG-Boost—offer superior predictive performance, effectively capturing the complex non-linear patterns in the hardness data.This underlines their suitability for reliably forecasting mechanical properties in materials research.

Comparison of actual vs. predicted hardness using machine learning models: (一个) linear regression;((b) support vector regression (SVR);((c) random forest;((d) gradient boosting;((e) XG-Boost.数字
22a–e presents the classification performance of various machine learning models in categorizing material hardness into four categories: brittle, semi-brittle, elastic, and highly elastic.The models assessed include Linear Regression, Support Vector Regression (SVR), Random Forest Regression, Gradient Boosting, and Extreme Gradient Boosting (XG-Boost).As illustrated in Fig. 22a, the Linear Regression model achieved a classification accuracy of 53.6%, correctly identifying 6 as brittle, 2 as semi-brittle, 5 as elastic, and 6 as highly elastic samples.The model’s misclassifications comprised 1 as brittle sample incorrectly labelled as semi-brittle;2 as semi-brittle samples as brittle;3 as semi-brittle samples as elastic;1 as elastic sample as brittle;and 1 as highly elastic sample misclassified as elastic.In comparison, the SVR model shown in Fig. 22b demonstrated improved performance, attaining an accuracy of 85.7%.It accurately classified 5 as brittle, 3 as semi-brittle, 5 as elastic, and 6 as highly elastic samples.The remaining misclassifications included 2 as brittle samples as semi-brittle;1 as semi-brittle sample as brittle;3 as semi-brittle samples as elastic;1 as elastic sample as semi-brittle;and 1 as highly elastic sample as elastic.The Random Forest Regression, Gradient Boosting, and XG-Boost models, presented in Fig. 22c–e, each achieved a classification accuracy of 67.87%.These models correctly identified 5 as brittle, 6 as semi-brittle, 2 as elastic, and 6 as highly elastic samples.However, their misclassifications involved 2 as brittle samples as semi-brittle, 1 as semi-brittle sample as brittle, 4 as elastic samples misclassified as semi-brittle, and 1 as highly elastic sample as elastic.In summary, these figures highlight the comparative classification performance of the different machine learning models in predicting material hardness categories.Notably, the SVR model outperformed the others in terms of classification accuracy, while the tree-based ensemble models exhibited moderate yet consistent predictive capability, effectively capturing the trends in material hardness behavior across the defined categories.

Confusion matrix for machine learning model predicting hardness by (一个) linear regression;((b) support vector regression (SVR);((c) random forest;((d) gradient boosting;((e) XG-Boost.数字
23illustrates the influence of injection molding processing parameters on the mechanical properties—Tensile Strength, Young’s Modulus, and Hardness—through the analysis of Pearson correlation coefficients.The heatmap reveals a strong negative correlation between Composition and Hardness (− 0.83) and a moderate negative correlation with Tensile Strength (− 0.57).This suggests that increasing the proportion of certain compositional elements, such as fillers or additives, tends to produce softer materials with diminished tensile strength.Similarly, Temperature exhibits a notable negative correlation with both Tensile Strength (− 0.65) and Young’s Modulus (− 0.62), indicating that higher processing temperatures can adversely affect the mechanical performance of the material.This reduction in strength and stiffness may be attributed to thermal degradation or alterations in molecular alignment during the cooling phase.In contrast, a moderate positive correlation (0.58) is observed between Tensile Strength and Young’s Modulus, which is consistent with typical mechanical behavior where materials with higher tensile strength generally exhibit greater stiffness.Interestingly, both Injection Speed and Injection Pressure show only weak correlations with the mechanical properties, implying that their effects are either less significant or potentially nonlinear when compared to the dominant influences of Composition and Temperature.Overall, this analysis underscores the importance of carefully optimizing both the material composition and processing temperature to achieve desirable mechanical performance in injection-molded components.

Correlation map between process parameters and mechanical property.
Cross-validation of ML
To evaluate the robustness and generalization capability of the machine learning models, a k-fold cross-validation (CV) approach was adopted, where the dataset was divided into five subsets and each was used once as a test set while the remaining four served for training.The comparison between CV and train–test R2values showed strong consistency with limited deviation.For tensile strength, SVR, Gradient Boosting, and XGBoost attained CV R2values of 0.936–0.941, compared to train–test values near 0.988, resulting in an error margin of ~ 4.7–5.2%.Hardness predictions yielded CV R2values of 0.879–0.885, closely matching train–test values of 0.954–0.965, with an error of ~ 0.07–0.09.Young’s modulus displayed slightly higher variation, with CV R2of 0.791–0.827 against train–test values of 0.956–0.963, producing an error of ~ 0.13–0.14.Overall, Gradient Boosting and XGBoost provided the best performance, confirming reliable prediction approximately 5% for tensile strength, under 10% for hardness, and 13% for Young’s modulus, confirming their robustness for modelling PLA/CCB composites.

Comparison of experimental results with ML models (一个) 抗拉强度;((b) Young’s modulus;((c) hardness.
数字24a compares the experimentally measured and predicted values of tensile strength across 27 experimental runs (Exp. No. 1–27).Predictions were generated using Linear Regression, Support Vector Regression (SVR), Random Forest, Gradient Boosting, and Extreme Gradient Boosting (XG-Boost).Among these, Gradient Boosting and XG-Boost provided the closest match to the experimental data, particularly in Exp.No. 1–3, 10–12, and 22–24, where the predicted values nearly overlapped with the actual measurements.Figure 24b presents the results for Young’s modulus under the same modeling approaches.Similar to tensile strength, Gradient Boosting and XG-Boost achieved the highest accuracy, showing strong alignment with the experimental results in Exp.No. 1–3, 10–12, and 22–24.These models demonstrated minimal deviation, underscoring their capability to capture the underlying mechanical behavior with high reliability.
数字24c illustrates the comparison for hardness.While all models produced reasonable predictions, Gradient Boosting and XG-Boost again outperformed the others, especially in Exp.No. 18–27, where near-perfect agreement between predicted and measured values was observed.This consistent performance highlights the robustness of these models in capturing complex nonlinear patterns across different mechanical properties.
结论
This study demonstrates significant enhancement in the mechanical properties of polylactic acid (PLA) composites reinforced with coconut shell biochar (CCB), particularly in terms of tensile strength, Young’s modulus, and hardness.The experimental results were comprehensively analyzed using ANOVA and further predicted through advanced machine learning models.The key outcomes of the research are summarized below:
-
The implementation of a Design of Experiments (DOE) approach using a Taguchi L27 orthogonal array effectively reduced the number of experimental runs while accurately capturing the influence of critical processing parameters.
-
Tensile strength and Young’s modulus increased with higher CCB content and lower injection temperatures, while hardness improved with increasing CCB content and higher injection temperatures.
-
ANOVA results identified composition as the most influential factor, contributing 50.42% to tensile strength, 38.58% to Young’s modulus, and 78.3% to hardness.Injection temperature also emerged as a significant parameter affecting mechanical performance.
-
Among the machine learning models applied, Gradient Boosting and XG-Boost achieved the highest prediction accuracy, with R2values of 98.77% for tensile strength, 96.28% for Young’s modulus, and 96.45% for hardness, confirming their effectiveness in capturing complex material-property relationships.
-
Gradient Boosting and XGBoost demonstrated strong generalisation with cross-validation R2values close to train-test values, maintaining prediction errors within approximately 5% for tensile strength, under 10% for hardness, and around 13% for Young’s modulus, confirming their robustness for modelling PLA/CCB composites.
This study optimizes injection molding parameters and PLA/CCB bio-composites using hybrid methodologies to enhance mechanical properties.The work is limited to a narrow filler range and mechanical characterization, restricting a full understanding of multifunctional behavior.Future studies will explore higher filler loadings, thermal, tribological, and durability properties for a comprehensive assessment.The framework will also be extended to 3D printing with advanced hybrid optimization approaches such as GRA, GA–ANN, and DFA50,,,,51。Incorporating biofiber52,,,,53, biochar–fiber hybrids54,,,,55, and novel lignocellulosic fibers56,,,,57,,,,58can further improve thermal stability, structural integrity, and sustainability of PLA composites59,,,,60。These advancements position PLA/CCB composites as promising candidates for lightweight packaging, biomedical devices, consumer electronics, and automotive applications.
数据可用性
Data is provided within the manuscript.
缩写
- CCB:
-
Coconut shell biochar
- PLA:
-
聚乳酸
- wt%:
-
重量%
- ANOVA:
-
Analysis of variance
- ML:
-
机器学习
- LR:
-
Linear regression
- SVR:
-
Support vector regression
- RFR:
-
Random forest regression
- GBR:
-
Gradient boosting regression
- XGBoost:
-
Extreme gradient boosting
- SEM:
-
Scanning electron microscopy
- XRD:
-
X射线衍射
- DOE:
-
Design of experiments
- MSE:
-
Mean squared error
- RMSE:
-
Root mean squared error
- RRMSE:
-
Relative root mean squared error
- MAE:
-
Mean absolute error
- MAPE:
-
Mean absolute percentage error
- r2:
-
Coefficient of determination
- UTM:
-
Universal testing machine
- ASTM:
-
American society for testing and materials
- MFI:
-
Melt flow index
- PBSA:
-
Poly(butylene succinate-co-adipate)
- PHB-HV:
-
Polyhydroxybutyrate-co-valerate
- GRA:
-
Grey relational analysis
- ANN:
-
Artificial neural network
- GA:
-
Genetic algorithm
- DFA:
-
Desirability function analysis
- HV:
-
Vickers hardness
参考
Sahu, S. K. & Sreekanth, P. S. R. Artificial neural network for prediction of mechanical properties of HDPE based nanodiamond nanocomposite.多聚。(韩国)。46, 614–620 (2022).文章
一个 CAS一个 Google Scholar一个 Pooja, N., Chakraborty, I., Rahman, M. H. & Mazumder, N. An insight on sources and biodegradation of bioplastics: A review.3生物技术。
13(7), 220 (2023). 文章一个
PubMed一个 PubMed Central一个 Google Scholar一个 Bikiaris, N. D. et al.Recent advances in the investigation of poly(lactic acid) (PLA) nanocomposites: incorporation of various nanofillers and their properties and applications.
聚合物15 (5), 1196 (2023).文章
一个 CAS一个 PubMed一个 PubMed Central一个 Google Scholar一个 Sahu, S. K. & Sreekanth, P. S. R. Evaluation of tensile properties of spherical shaped SiC inclusions inside recycled HDPE matrix using FEM based representative volume element approach.Heliyon
9(3), e14034 (2023). 文章一个
CAS一个 PubMed一个 PubMed Central一个 Google Scholar一个 Ali, S., Deiab, I. & Pervaiz, S. State-of-the-art review on fused deposition modeling (FDM) for 3D printing of polymer blends and composites: innovations, challenges, and applications.int。
J. Adv.Manuf.技术。 135, 5085–5113 (2023).
文章一个 Google Scholar一个
Badgayan, N. D., Sahu, S. K., Samanta, S. & Sreekanth, P. S. R. Assessment of bulk mechanical properties of HDPE hybrid composite filled with 1D/2D nanofiller system.母校。科学。论坛。917, 12–16 (2018).文章
一个 Google Scholar一个 Joe, A. C. et al.Pyrolyzed biomass filler for PLA-based food packaging.
聚合物17 (10), 1327 (2025).文章
一个 CAS一个 PubMed一个 PubMed Central一个 Google Scholar一个 Vengadesan, E. et al.Enhancement of polylactic acid (PLA) with hybrid biomass-derived rice husk and biocarbon fillers: A comprehensive experimental study.
Discov Appl.科学。 7(3), 161 (2025).
文章一个 CAS一个 Google Scholar一个
Papadopoulou, K. et al.Synthesis and characterization of pla/biochar bio-composites containing different Biochar types and content.聚合物 17(3), 263 (2025).
文章一个 CAS一个 PubMed一个 PubMed Central一个 Google Scholar一个
Yang, Z. et al.Bleached extruder chemi-mechanical pulp fiberâ€PLA composites: comparison of mechanical, thermal, and rheological properties with those of wood flourâ€PLA bioâ€composites.J. Appl。多聚。科学。 133(48), 44241 (2016).
文章一个 Google Scholar一个
Gurusamy, M., Thirumalaisamy, R., Karuppusamy, M. & Sivanantham, G. Pistachio shell Biochar as a reinforcing filler in short Turkish hemp fiber composites: A path toward sustainable materials.J. Polym。res。 32(4), 1–26 (2025).
文章一个 Google Scholar一个
Mahesh, V. et al.Eco-friendly composites: Harnessing eggshell and marble waste in polymer innovation.伊朗。多聚。J.1–20.(2025)。
Uddin, M. H. et al.Advances in natural fiber polymer and PLA composites through artificial intelligence and machine learning integration.J. Polym。res。 32(3), 76 (2025).
文章一个 CAS一个 Google Scholar一个
Mallegni, N. et al.Valorising insect exoskeleton biomass filler in bioplastic-based eco-friendly rigid items for agriculture applications.聚合物 17(7), 943 (2025).
文章一个 CAS一个 PubMed一个 PubMed Central一个 Google Scholar一个
Mosi, G. O. Analysis and optimization of mechanical properties of coconut fiber-reinforced polymer composite fabricated using fused filament fabrication [Ph.D.论文]。COETEC-JKUAT;(2025)。
Chawraba, K. & El Mogy, S. A. Rice husk as reinforcement in wood plastic composites.在Rice Husk Biomass: Processing, Properties and Applications。施普林格;181–211.(2025)。
Xia, Y., Qian, S., Zhang, X., Zhang, Z. & Zhu, C. Biochar as an efficient reinforcing agent for Poly (lactic acid)/poly (ε-caprolactone) biodegradable composites with high robustness and thermo-resistance.Ind. Crops Prod. 219, 119049 (2024).
文章一个 CAS一个 Google Scholar一个
Botta, C., Grottola, C. M., Amato, D. & Acocella, M. R. Biochar as sustainable filler of recycled polylactic acid (PLA): A new generation of processable biocomposites.聚合物 16(23), 3347 (2024).
文章一个 CAS一个 PubMed一个 PubMed Central一个 Google Scholar一个
MaliÅ„ska, K., Dróżdż, D., Postawa, P. & Stachowiak, T. Biochar—A filler in ‘bioplastics’ for horticultural applications.材料 17(24), 6208 (2024).
文章一个 广告一个 PubMed一个 PubMed Central一个 Google Scholar一个
George, J., Gaidukovs, S. & Bhattacharyya, D. Pinewood Biochar antistatic polymer composites: an investigation of electrical, mechanical, rheological and thermal properties.int。J. Smart Nano Mater. 15(4), 767–785 (2024).
文章一个 广告一个 Google Scholar一个
Zouari, M., Devallance, D. B. & Marrot, L. Effect of Biochar addition on mechanical properties, thermal stability, and water resistance of hemp-polylactic acid (PLA) composites.材料 15(6), 2271 (2022).
文章一个 广告一个 CAS一个 PubMed一个 PubMed Central一个 Google Scholar一个
George, J., Jung, D. & Bhattacharyya, D. Improvement of electrical and mechanical properties of PLA/PBAT composites using coconut shell Biochar for antistatic applications.应用。科学。 13(2), 902 (2023).
文章一个 CAS一个 Google Scholar一个
Suman, S. Conversion of solid biomass into biochar: act as a green, Eco-Friendly energy source and a substitute of fossil fuel inputs.在The First World Energies Forum— Current and Future Energy Issues.mdpi;34。https://doi.org/10.3390/WEF-06916。(2020).
Salama, E. et al.Catalytic fabrication of graphene, carbon spheres, and carbon nanotubes from plastic waste.RSC Adv。 14(3), 1977–1983 (2024).
文章一个 广告一个 CAS一个 PubMed一个 PubMed Central一个 Google Scholar一个
Ali, S. et al.Integrated optimization scheme for 3D printing of PLA-APHA biodegradable blends.Prog Addit.Manuf. 10, 875–886 (2025).
文章一个 Google Scholar一个
Devadiga, U. & Fernandes, P. Taguchi analysis for sliding wear characteristics of carbon nanotube-flyash reinforced aluminium nanocomposites.Heliyon 7, e06170 (2021).
文章一个 CAS一个 PubMed一个 PubMed Central一个 Google Scholar一个
Kaharudin, K. E. et al.Optimization of perovskite solar cell with MoSâ‚‚-based HTM layer using hybrid L27 Taguchi-GRA based genetic algorithm.公牛。电子工程。inf。 14(1), 184–196 (2025).
文章一个 Google Scholar一个
Sundarasetty, H. & Sahu, S. K. Experimental and computational study on the tensile and flexural properties of polylactic acid filled with Boron nitride nanoplatelets.Frat Integr.结构。 19(72), 211–224 (2025).
Gdoutos, E. & Konsta-Gdoutos, M. Tensile testing.In: Mechanical Testing of Materials.Cham: Springer;1–34.(2024)。
章一个 Google Scholar一个
Milovanović, A., Sedmak, A., Paunić, M. & Mitrović, A. Tensile properties of pure PLA polymer dedicated for additive manufacturing.结构。集成。生活。24(3), 263–268 (2024).文章
一个 Google Scholar一个 Sritharan, R., Taklimi, S. R., Ghazinezami, A. & Askari, D. The chemical functionalization advantages of carbon nano heli-coil reinforcements for multifunctional polymeric nanocomposites.J. Compos.
母校。1–19.(2025)。
Khammassi, S. et al.Poly(lactic acid) (PLA)-based nanocomposites: impact of vermiculite, silver, and graphene oxide on thermal stability, isothermal crystallization, and local mechanical behavior.J. Compos.科学。 6(4), 112 (2022).
文章一个 CAS一个 Google Scholar一个
Sarangi, S. S., Lavakumar, A., Singh, P. K., Katiyar, P. K. & Ray, R. K. Indentation size effect in steels with different carbon contents and microstructures.母校。科学。技术。 39(3), 338–346 (2023).
文章一个 广告一个 CAS一个 Google Scholar一个
Ghorbal, G. B., Tricoteaux, A., Thuault, A., Louis, G. & Chicot, D. Comparison of conventional Knoop and Vickers hardness of ceramic materials.J. Eur。Ceram.Soc。 37(6), 2531–2535 (2017).
文章一个 Google Scholar一个
Rajiv, T., Reddy, T. S. & Chandrashekar, R. Experimental analysis using Taguchi optimization technique on wear properties of Al-356 alloy MMC reinforced with SiC.J. Inst.工程。India Ser.d1–10.(2024)。
Ali, S., Mehra, V., Eltaggaz, A., Deiab, I. & Pervaiz, S. Optimization and prediction of additively manufactured PLA-PHA biodegradable polymer blend using TOPSIS and GA-ANN.Manuf.Lett。 41, 795–802 (2025).
文章一个 Google Scholar一个
Stoll, A. & Benner, P. Machine learning for material characterization with an application for predicting mechanical properties.GAMM-Mitt 44(1), e202100003 (2021).
文章一个 MathSciNet一个 Google Scholar一个
Mafra, R. G.Pesquisa Em Engenharia: Ciência E Aplicação1st edn (Bookerfield Editora, 2022).
Zheng, M., Wen, Q., Xu, F. & Wu, D. Regional forest carbon stock Estimation based on multi-source data and machine learning algorithms.Forests 16(3), 420 (2025).
文章一个 Google Scholar一个
Khalfa, M. A., Manai, L. & Mchara, W. Advanced artificial intelligence model for solar irradiance forecasting for solar electric vehicles.int。J. Dyn.控制。13(3), 1–21 (2025).Google Scholar
一个 Sundarasetty, H. & Sahu, S. K. Tribological behavior of PLA reinforced with Boron nitride nanoparticles using Taguchi and machine learning approaches.
Results Eng.26 , 104772 (2025).文章
一个 CAS一个 Google Scholar一个 Yang, L. & Shen, D. Algebraic and statistical properties of the partially regularized ordinary least squares interpolator.ArXiv
ArXiv, 241106593 (2024). 广告一个
Google Scholar一个 Karal, Ö.Comparative performance analysis of epsilon-insensitive and pruning-based algorithms for sparse least squares support vector regression.
Sigma J. Eng.纳特。科学。 42(2), 578–589 (2024).
Liu, T. et al.Identification of the primary pollution sources and dominant influencing factors of soil heavy metals using a random forest model optimized by genetic algorithm coupled with geodetector.生态毒素。环境。SAF。 290, 117731 (2025).
文章一个 CAS一个 PubMed一个 Google Scholar一个
Qiuqian, W., GaoMin, KeZhu, Z. & Chenchen A light gradient boosting machine learning-based approach for predicting clinical data breast cancer.Multiscale Multidiscip Model.经验。des。 8(1), 75 (2025).
文章一个 Google Scholar一个
Gao, F., Xie, J., Xiong, X., Wang, L. & Chang, X. Prediction of peak particle vibration velocity based on intelligent optimization algorithm combined with XGBoost.专家系统。应用。 280, 127654 (2025).
文章一个 Google Scholar一个
Li, X. et al.A fusion XGBoost approach for large-scale monitoring of soil heavy metal in farmland using hyperspectral imagery.农艺学 15(3), 676 (2025).
文章一个 Google Scholar一个
Meinig, L., Boldt, R., Spoerer, Y., Kuehnert, I. & Stommel, M. Correlation between processing parameters, morphology, and properties of injection-molded polylactid acid (PLA) specimens at different length scales.聚合物 15(3), 721 (2023).
文章一个 CAS一个 PubMed一个 PubMed Central一个 Google Scholar一个
Gálvez, J. et al.Effect of extrusion screw speed and plasticizer proportions on the rheological, thermal, mechanical, morphological and superficial properties of PLA.聚合物 12(9), 2111 (2020).
文章一个 PubMed一个 PubMed Central一个 Google Scholar一个
Ali, S., Deiab, I. & Pervaiz, S. Optimizing the properties of PHBV/PBAT blend for additive manufacturing.Procedia CIRP。131, 7–12.https://doi.org/10.1016/j.procir.2024.09.004(2025)。
文章一个 Google Scholar一个
Ali, S., Deiab, I., Pervaiz, S. & Eltaggaz, A. Development of sustainable polymer composite with agro-industrial residue for biomedical applications.多聚。工程。科学。 65(4), 1922–1933.https://doi.org/10.1002/pen.27123(2025)。
文章一个 CAS一个 Google Scholar一个
Lekrine, A. et al.Fiber treatment impact on the thermal behavior of biomass/palm-fibers polylactic-acid hybrid biocomposites.母校。化学物理。 338, 130651.https://doi.org/10.1016/j.matchemphys.2025.130651(2025)。
文章一个 CAS一个 Google Scholar一个
Dembri, I. et al.Structural and thermal properties of Alkali-treated biomass fibers and W. robusta waste reinforced PLA hybrid biocomposites.案例螺柱。Therm.工程。 70, 106170.https://doi.org/10.1016/j.csite.2025.106170(2025)。
文章一个 Google Scholar一个
Dembri, I. et al.Effect of alkaline treatment on the thermo-physicochemical and mechanical properties of Biochar powder/washingtonia robusta fibers/pla hybrid biocomposites.J. Mater。res。技术。 33, 9735–9751.https://doi.org/10.1016/j.jmrt.2024.12.018(2024)。
文章一个 CAS一个 Google Scholar一个
Lekrine, A. et al.Thermomechanical and structural analysis of green hybrid composites based on polylactic acid/biochar/treated W. filifera palm fibers.J. Mater。res。技术。 30, 9656–9667.https://doi.org/10.1016/j.jmrt.2024.06.033(2024)。
文章一个 CAS一个 Google Scholar一个
Kir, M. et al.Extracting and characterizing of a new vegetable lignocellulosic fiber produced from C. humilis palm trunk for renewable and sustainable applications.int。J. Biol。大分子。 281, 136495.https://doi.org/10.1016/j.ijbiomac.2024.136495(2024)。
文章一个 CAS一个 PubMed一个 Google Scholar一个
Atoui, S. et al.Extracting and characterizing novel cellulose fibers from Chamaerops humilis rachis for textiles’ sustainable and cleaner production as reinforcement for potential applications.int。J. Biol。大分子。 276, 134029.https://doi.org/10.1016/j.ijbiomac.2024.134029(2024)。
文章一个 CAS一个 PubMed一个 Google Scholar一个
Meddour, A., Belaadi, A., Boumaaza, M., Bourchak, M. & Ghernaout, D. Enhancing Syagrus Romanzoffiana lignocellulosic fibers’ properties by ecological treatment with sodium bicarbonate for applications in sustainable lightweight biocomposites.int。J. Biol。大分子。 298, 140062.https://doi.org/10.1016/j.ijbiomac.2025.140062(2025)。
文章一个 CAS一个 PubMed一个 Google Scholar一个
Benarab, M., Belaadi, A., Bedjaoui, A., Boumaaza, M. & Ghernaout, D. Characterizing novel cellulosic fibers extracted from vicia Faba plant waste stems as a promising reinforcement for applications in sustainable textile and lightweight biocomposites.int。J. Biol。大分子。 307, 141940.https://doi.org/10.1016/j.ijbiomac.2025.141940(2025)。
文章一个 CAS一个 PubMed一个 Google Scholar一个
Hadou, A., Belaadi, A., Alshahrani, H. & Khan, M. K. A. Extraction and characterization of novel cellulose fibers from Dracaena Draco plant.母校。化学物理。 313, 128790.https://doi.org/10.1016/j.matchemphys.2023.128790(2024)。
文章一个 CAS一个 Google Scholar一个
致谢
The authors acknowledge and thank Mr. E Krishna Murty (Sr. Technical Assistant, VIT, Amaravati) and Mr. Loya Prasad (Technical Assistant, VIT, Amaravati) for their support during the sample preparation and testing process.
资金
This work was supported and funded by the Deanship of Scientific Research at Imam Mohammad Ibn Saud Islamic University (IMSIU) (grant number IMSIU-DDRSP2503).
道德声明
竞争利益
作者没有宣称没有竞争利益。
附加信息
Publisher’s note
关于已发表的地图和机构隶属关系中的管辖权主张,Springer自然仍然是中立的。
权利和权限
开放访问This article is licensed under a Creative Commons Attribution 4.0 International License, which permits use, sharing, adaptation, distribution and reproduction in any medium or format, as long as you give appropriate credit to the original author(s) and the source, provide a link to the Creative Commons licence, and indicate if changes were made.The images or other third party material in this article are included in the article’s Creative Commons licence, unless indicated otherwise in a credit line to the material.If material is not included in the article’s Creative Commons licence and your intended use is not permitted by statutory regulation or exceeds the permitted use, you will need to obtain permission directly from the copyright holder.To view a copy of this licence, visithttp://creativecommons.org/licenses/4.0/。重印和权限
引用本文

Sundarasetty, H., Louhichi, B., Alrasheedi, N.H.
等。Machine learning guided process optimization and sustainable valorization of coconut biochar filled PLA biocomposites.Sci代表15 , 34647 (2025).https://doi.org/10.1038/s41598-025-19791-0
已收到:
公认:
出版:
doi:https://doi.org/10.1038/s41598-025-19791-0