
Advancing e-waste classification with customizable YOLO based deep learning models
作者:Alrashoud, Mubarak
Introduction
E-waste, comprising discarded electrical or electronic devices, has seen an alarming increase due to rampant growth in adopting electronic devices1. This surge has resulted in grave environmental and health challenges, necessitating precise classification and separation for efficient recycling and management2.
Computer vision, particularly object detection models, has shown immense potential to address these challenges. Object detection, which involves identifying and localizing objects within an image, plays a pivotal role in several industrial applications, including e-waste management, as proposed by Rosebrock et al.3However, selecting an object detection model that harmoniously combines speed, accuracy, and computational efficiency remains a conundrum4.
YOLO, standing for ‘You Only Look Once,’ has been groundbreaking in real-time object detection and was recommended by Redmon et al.7. From its v5 iteration to v8, YOLO has consistently improved speed and performance metrics.
In this research, the researchers aim to evaluate three prominent object detection models, YOLOv5, YOLOv7, and YOLOv8 models, in terms of electronic waste classification. The crux of this research lies in discerning the performance of these models across different scenarios and input variations, enabling users to pinpoint the most suitable model for their specific e-waste management needs. In addendum, this research endeavors to present a comprehensive understanding of the strengths and weaknesses of these avant-garde object detection models in the context of e-waste classification. By doing so, we anticipate assisting a myriad of stakeholders, from researchers and developers to practitioners in computer vision and environmental management, in making judicious choices.
Related work
The escalating issue of e-waste disposal demands innovative techniques for its effective identification and classification. Central to this challenge is deploying advanced deep-learning models that can seamlessly detect and sort different types of electronic waste. In recent years, deep learning techniques, particularly those based on CNNs, have emerged as a potent solution to this growing problem. Table 1 summarizes the historical origins of prominent object detection models, highlighting their respective innovations and applications in fields such as real-time object detection and electronic waste detection.
Works by Zhou et al.12 were pioneers in this area, presenting one of the first CNN frameworks tailored for e-waste component type identification. Their study underscored the transformative potential of CNNs in discerning between various e-waste types, laying the groundwork for subsequent research in this domain. Jiang et al.4 supported this idea, demonstrating an automated e-waste sorting system based on deep learning. Their system exemplifies the accuracy and effectiveness of CNNs.
Amidst these advances in CNN-based methodologies, there’s been a parallel surge in the popularity and development of the YOLO (You Only Look Once) series of models. Originally introduced by Redmonet al.7, YOLO revolutionized real-time object detection. The ensuing versions, YOLOv5, v7, and v8, testified to the rapid advancements in this line of research. Bochkovskiy et al.8unveiled the YOLOv5, emphasizing architectural refinements for bolstered performance and scalability. The subsequent iterations, YOLOv7, and v8, as presented by13, incorporated technologies like Feature Pyramid Networks14, further propelling the YOLO architecture to the forefront of real-time object detection.
In parallel, the role of comprehensive frameworks like the TensorFlow Object Detection API, introduced by Huang et al.6, cannot be undermined. This open-source framework facilitates the end-to-end development of object detection models. However, its direct applicability to e-waste detection remains a relatively untapped area, even though preliminary investigations like that of Li et al.15 have hinted at its potential.
Recently, Zhang and Liu16enriched the e-waste literature by providing an exhaustive review of deep learning-driven e-waste detection techniques, offering a holistic understanding of the evolving methodologies. Several subsequent studies have highlighted the strengths of YOLOv5 and allied architectures in e-waste detection. For instance, systems leveraging YOLOv5 alongside transfer learning have been proposed by researchers such as9,17, and even combined with ensemble learning by18. Significant accuracy improvements were achieved by Chen et al.19 through the innovative integration of multi-scale feature fusion techniques with YOLOv5. The quest for improved detection methods has been supported by the integration of cascaded networks. Alsubaei et al.20 demonstrated this by introducing a specialized deep learning-infused cascaded object detection system designed specifically for electronic waste.
In sum, while CNN-based methodologies have set benchmarks in e-waste detection, the YOLO family’s continuous evolution and complementary frameworks, such as the TensorFlow Object Detection API, signify an expansive and promising frontier. This research combines these distinct threads, offering a comprehensive evaluation of the family of YOLO architectures in e-waste detection, focusing on accuracy and applicability.
This research work is articulated to deliberate on the novelty of YOLOv5 in Section “Novelty of YOLOv5”, YOLOv7 in Section “Novelty of YOLOv7”, and YOLOv8 in Section “Novelty of YOLOv8”. The architectural comparison of the improved and customizable YOLOv5, YOLOv7, and YOLOv8 is explained in detail for a lucid understanding and contemplation. The methodology, dataset used for this research work, and model descriptions are mentioned in Section “Methodology”. The prominence of the YOLO models and their respective validations are mentioned in Section “Results and discussion” under the results and discussions. Section “Conclusion” dispenses the concluding remarks of this research, with improved YOLOv8 being the champion for the objective of E-waste classification, which was greatly inspired by Lou et al.21
Novelty of YOLOv5
The originality of YOLOv5 principally stems from its architectural breakthroughs and enhanced performance. The system incorporates a distinctive blend of elements, comprising CSPDarknet53 as its core, PANet in the intermediate section, and a YOLO head for object detection.
-
1.
The CSPDarknet53 backbone is a customized iteration of the Darknet-53 architecture, a deep CNN structure. The main feature of this approach is the utilization of the “cross-stage partial” technique, which divides the network into many stages with interconnected paths. This methodology improves the transmission of information and the dissemination of gradients.
-
2.
The PANet architecture in the neck region integrates characteristics from several layers of the backbone network, forming a feature pyramid. The method employs spatial pyramid pooling and lateral connections to aggregate features, enhancing object recognition across various scales.
-
3.
The YOLO head of YOLOv5 predicts the coordinates of bounding boxes and the probabilities of distinct classes at various grid scales. The model’s effectiveness in identifying objects of varying sizes is enhanced by its ability to predict across multiple scales.
The mathematical representation of the novelty of YOLOv5 is represented in Eq. (1):
$${\text{YOLOv5 }} = {\text{ f}}\left( {{\text{CSPDarknet53}},{\text{ PANet}},{\text{ YOLO Head}}} \right)$$
(1)
where
-
a.
“CSPDarknet53” refers to the core network infrastructure known as the CSPDarknet53 backbone network.
-
b.
The PANet is a network that aggregates paths and is utilized in the neck region.
-
c.
The YOLO Head symbolizes the YOLO head used for object detection.
Novelty of YOLOv7
The improved and customizable YOLOv7 incorporates advancements from the existing YOLOv5 framework to enhance speed and accuracy. This originality includes alterations in the core structure, techniques for focusing, and integration of features.
-
1.
The YOLOv7 model incorporates a customized variant of the CSPDarknet53 backbone network, which improves the ability to extract features.
-
2.
The YOLOv7 model has the Spatial Attention Module (SAM) block, which enhances accuracy by enabling the model to concentrate on pertinent portions of the input.
-
3.
YOLOv7 utilizes PANet for feature fusion, similar to YOLOv5. This technique enhances object detection by merging features from various scales.
The mathematical representation for the novelty of YOLOv7 is represented in Eq. (2):
$${\text{YOLOv7 }} = {\text{ f }}\left( {{\text{Modified CSPDarknet53}},{\text{ SAM Block}},{\text{ PANet}}} \right)$$
(2)
where
-
a.
The term “Modified CSPDarknet53” refers to the altered version of the CSPDarknet53 backbone network.
-
b.
The acronym SAM stands for Spatial Attention Module, which is used to improve the feature extraction process.
-
c.
PANet is an acronym for Path Aggregation Network used for feature fusion.
Novelty of YOLOv8
The improved and customizable YOLOv8 represents the most recent iteration of the YOLO series and incorporates various pioneering elements such as anchor-free object identification, multi-scale prediction, and enhanced backbone networks.
-
1.
Anchor-Free Detection: YOLOv8 directly predicts an object’s center instead of relying on anchor boxes. This obviates the necessity of adjusting anchor boxes and enhances the precision of object localization.
-
2.
Multi-Scale Prediction: YOLOv8 utilizes a method of predicting bounding boxes and class probabilities at many scales, enabling it to effectively recognize objects of varied sizes.
-
3.
Enhanced Backbone Network: YOLOv8 employs a customized variant of the CSPDarknet53 backbone network, incorporating improvements like GhostNet modules and eliminating redundant layers.
The mathematical representation for the novelty of YOLOv8 is represented in Eq. (3):
$${\text{YOLOv8 }} = {\text{ f}}\left( {{\text{Anchor{-}Free Detection}},{\text{ Multi{-}Scale Prediction}},{\text{ Improved Backbone Network}}} \right)$$
(3)
where
-
a.
Anchor-Free Detection is an innovative method for directly determining the centers of objects.
-
b.
Multi-scale prediction refers to the ability to forecast objects at different scales.
-
c.
The Improved Backbone Network refers to the advancements made in the CSPDarknet53 backbone network.
-
d.
The mathematical representations provide a comprehensive grasp of the distinct contributions and advancements brought by each YOLO model, enabling more precise comprehension of innovations in object recognition.
Comparing the architectures of the improved—YOLOv5, YOLOv7, and YOLOv8
YOLOv5
YOLOv5 is a popular single-shot object detection algorithm that builds upon the earlier versions of YOLO. It introduces architectural advancements and performance improvements. Below is a detailed explanation of the YOLOv5 architecture22.
Improved backbone network
Improved YOLOv5 utilizes a powerful backbone network called CSPDarknet53 (Cross-Stage Partial Network). CSPDarknet53 is a modified version of Darknet-53, a deep CNN architecture. It consists of 53 convolutional layers and is designed to effectively extract high-level features from input images. The backbone network follows a “cross-stage partial” strategy, where it splits the network into multiple stages, and each stage has a partial path and a cross-path. The partial path processes the features independently, while the cross-path aggregates information from previous stages. This architecture helps improve information flow and gradient propagation, leading to better performance.
Neck
The neck of YOLOv5 is responsible for feature fusion and object detection at multiple scales. It consists of several convolutional layers and performs feature pyramid construction to handle objects of different sizes. The improved YOLOv5 employs a PANet (Path Aggregation Network) structure as its neck. PANet combines features from different layers of the backbone network to create a feature pyramid. It incorporates spatial pyramid pooling and lateral connections to aggregate features at different scales. This enables the network to detect objects of various sizes and improves detection accuracy.
Head
The head of YOLOv5 performs object detection and localization based on the features generated by the backbone and neck. It predicts bounding box coordinates and class probabilities for the detected objects.
The improved YOLOv5 adopts a YOLO head architecture that consists of several convolutional layers5, followed by a set of output layers. The output layers predict bounding box coordinates relative to the cell in the grid and class probabilities for multiple anchor boxes. The head predicts bounding box offsets, objectness scores, and class probabilities at different grid scales. These predictions are made at different feature map resolutions, allowing the detection of objects at multiple scales.
Loss function
YOLOv5 utilizes a combination of loss functions to train the model effectively. The loss functions include.
-
1.
Objectness Loss: This measures the accuracy of object prediction within each grid cell.
-
2.
Localization Loss: Measures the accuracy of predicted bounding box coordinates.
-
3.
Confidence Loss: Measures the accuracy of predicted class probabilities.
-
4.
Classification Loss: Measures the accuracy of predicted class labels.
The final loss is a linear combination of these individual loss components, and the network parameters are optimized using backpropagation and gradient descent algorithms.
Model sizes
YOLOv5 offers models of different sizes: YOLOv5s, YOLOv5m, YOLOv5l, and YOLOv5x. These models vary in terms of depth, width, and computational requirements. Smaller models like YOLOv5s are faster but may sacrifice some accuracy, while larger models like YOLOv5x provide higher accuracy but require more computational resources.
As shown in Fig. 1, the improved YOLOv5 architecture combines a powerful backbone network (CSPDarknet53) with a PANet neck and a YOLO head to perform efficient and accurate object detection. It leverages feature fusion and multi-scale predictions to handle objects of different sizes, making it suitable for a wide range of real-world applications. Figure 2 provides a detailed representation of the overall architecture, highlighting its layered structure and computational pathways.

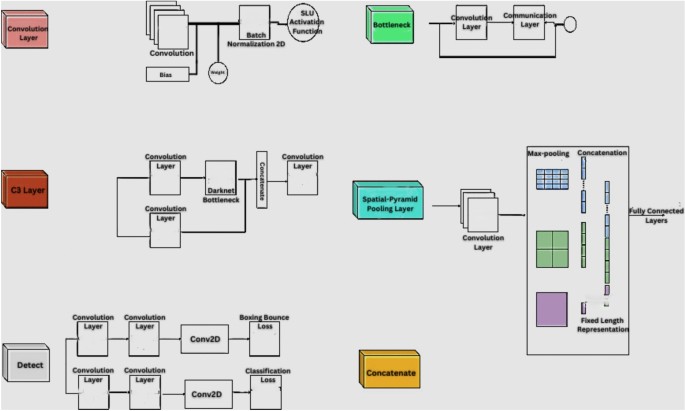
Components used in the improved YOLOV5 architecture.

Improved YOLOV5 architecture.
YOLOv7
YOLOv7 by Wang et al.9,10,11 is a single-stage object detection algorithm that builds upon the earlier versions of YOLO. It introduces several architectural advancements and performance improvements, including Trainable Bag-of-Freebies (BoF). BoF is a modular framework that allows users to plug and play various techniques to improve model performance. The improved YOLOv7 includes several pre-trained BoF modules, such as GhostNet, Focus, and SPP, which can be used to improve the speed and accuracy of the model as depicted in Fig. 3

Components used in improved YOLOV7 architecture.
YOLOv7 head
The YOLOv7 head is a new design that improves object detection accuracy. It predicts bounding box coordinates and class probabilities for the detected objects using a set of convolutional layers followed by a set of output layers.
Improved backbone network
The improved YOLOv7 uses a modified version of the CSPDarknet53 backbone network, designed to effectively extract high-level features from input images. The modified backbone network includes several improvements, such as using GhostNet modules and removing unnecessary layers. As shown in Fig. 4, YOLOv7’s architecture enables more precise feature extraction, especially for smaller objects crucial for accurate e-waste classification.

Improved YOLOV7 architecture.
The YOLOv7 is available in four sizes: YOLOv7s, YOLOv7m, YOLOv7l, and YOLOv7x. These models vary in terms of depth, width, and computational requirements. Smaller models like YOLOv7s are faster but may sacrifice some accuracy, while larger models like YOLOv7x provide higher accuracy but require more computational resources.
Overall, YOLOv7 is a powerful and efficient object detection algorithm that balances speed and accuracy well. It is suitable for various real-world applications, such as self-driving cars, robotics, and security surveillance.
YOLOv8
YOLOv8 by Wang et al.9,10,11 is the latest version of the YOLO object detection algorithm. It introduces several new features and improvements over YOLOv7, including Anchor free detection and multi-scale prediction.
Anchor-free detection
As illustrated in Fig. 5, the improved YOLOv8 is an anchor-free object detector, which predicts an object’s center directly instead of using anchor boxes. This eliminates the need to tune anchor boxes and improves object detection accuracy. Figure 6 shows the full architecture of YOLOv8, demonstrating its ability to scale across multiple resolutions.

Components used in the improved YOLOV8 architecture.

Improved YOLOV8 architecture.
Multi-scale prediction
The improved and customizable YOLOv8 predicts bounding boxes and class probabilities at different scales, which allows it to detect objects of various sizes more effectively.
Improved backbone network
The improved YOLOv8 uses a modified version of the CSPDarknet53 backbone network, designed to effectively extract high-level features from input images. The modified backbone network includes several improvements, such as using GhostNet modules and removing unnecessary layers.
YOLOv8 is available in four sizes: YOLOv8s, YOLOv8m, YOLOv8l, and YOLOv8x. These models vary in terms of depth, width, and computational requirements. Smaller models like YOLOv8s are faster but may sacrifice some accuracy, while larger models like YOLOv8x provide higher accuracy but require more computational resources.
Overall, the YOLOv8 is a powerful and efficient object detection algorithm that balances speed and accuracy well. It is suitable for various real-world applications, such as self-driving cars, robotics, and security surveillance.
YOLOv8 is the first YOLO model trained on COCO v6, the latest COCO object detection dataset version. This means that YOLOv8 is better at detecting new and challenging objects, such as small objects and objects in complex scenes. Overall, the improved YOLOv8 significantly improves over the improved YOLOv7 and offers the best performance in speed and accuracy. It is a good choice for any task that requires real-time object detection.
Methodology
Figure 7 depicts the comprehensive structure of the proposed framework in this research investigation.
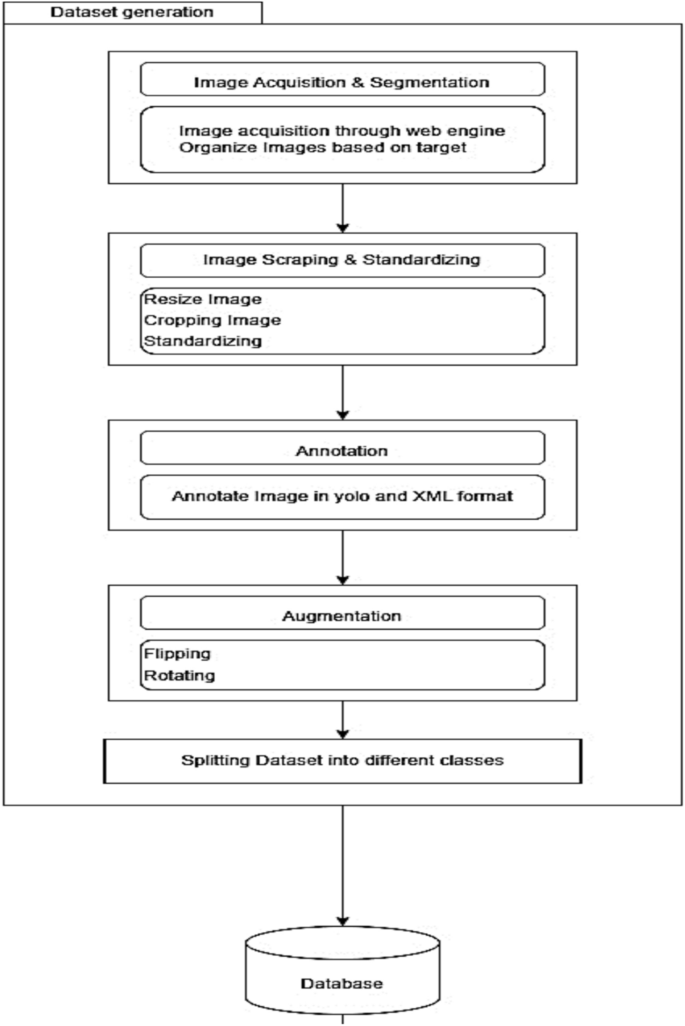
Illustration of the workflow diagram.
Materials and methods
Image dataset fabrication refers to the generation of numerous images that can be used to train a machine-learning model. The creation of a dataset requires the collection, organization, and labeling of data and is a necessary step in the development of any object detection or classification model. This document discusses the creation of image datasets for seven classes, including resistors, capacitors, motherboards, regulators, batteries, LCDs, and IoT sensors. Figure 8 visually represents the seven e-waste categories considered in this study.

Seven electronic components encompass batteries, resistors, capacitors, circuit boards, regulators, LCDs, and IoT sensors.
Image scraping and image standardization
The Python Image Library, as detailed by Lundh23, is a valuable resource for scraping and standardizing images to generate credible image datasets. PIL can be used to perform a variety of operations when creating an image dataset, including opening, resizing, cropping, and saving images. If you have a collection of raw images with different sizes and aspect ratios, for instance, you can use PIL to resize them to a standard size, crop them to focus on the relevant object or region, and save them in a standard format. This ensures that all images in the dataset are consistent and can be utilized to train a machine-learning model effectively.
Image data acquisition and segmentation
Collecting many images is the first step in creating an image dataset. In this instance, we focused on locating images of the seven classes. Images can be gathered from various sources, including search engines, online marketplaces, and manufacturer websites. Photographs should be of high quality and include a range of perspectives, lighting conditions, and backgrounds. It is essential that the images accurately represent the objects we wish to recognize in the real world.
Once many images have been collected, we must organize them into folders based on their respective classes. Seven folders have been created in this research work, one for each class. This step will make labeling and using the images easier to train the machine-learning model. PIL can also be used to clean and create the dataset. For instance, you may need to remove duplicate images, incorrect labels, or low-quality images. PIL provides various methods for manipulating images, such as blurring, sharpening, and adjusting brightness and contrast, which can improve the quality of images and make them easier to categorize.
Image labeling using bounding box
A class must be assigned to each image to label the images. There are numerous tools for labelling images, such as label boxes, CVAT, and labeling. These tools enable us to draw a bounding box around each image object and assign it to the corresponding class. To avoid confusion when training the model, ensuring that the labelling is uniform across all images is crucial. Figure 9 depicts an annotated sample with the help of an image labeling tool named makesense.io.

A sample image out of the seven classes of electronic components annotated using ‘makesense.io’.
Data augmentation
The process of generating new images by applying various transformations to the original images is known as data augmentation. Data augmentation can increase the size of the dataset and enhance the model’s robustness. Numerous techniques for enhancing data include flipping, rotation, and cropping. It is essential that the augmented images accurately represent the objects we wish to identify in the real world. Figure 10 illustrates the data augmentation techniques implemented, significantly expanding the dataset and improving the model’s generalization capability.

Image augmentation implemented on each image to expand the dataset’s size, thereby enriching the available data for the featured object detection model.
Dataset fragmentation
After collecting, organizing, labeling, and augmenting the images, we must divide the dataset into training, validation, and testing sets. The training set is used to train the model, the validation set is used to tune the model’s hyperparameters, and the testing set is used to assess the performance of the model. The division should be made randomly and reflect the distribution of classes in the real world.
Experimental dataset
In our research Dataset, we have considered a total of 700 images processed or synthesized using the above-mentioned techniques. For each dataset class, the distribution is shown in Table 2.
Model selection
Improved—YOLOv5, YOLOv7, and YOLOv8 are three distinct yet complementary machine learning pre-trained models that were utilized in our pursuit of a robust and effective solution for electronic waste detection.
YOLOv5
Ultralytics developed the YOLOv5 (You Only Look Once version 5) real-time object detection algorithm. We chose this model because of its lightweight construction, speed, and competitive precision. The innovative structure of YOLOv5, which consists of a backbone (CSPDarknet53), a neck (PANet and FPN), and a head (YOLOv3), was especially advantageous. Our e-waste identification system required real-time detection and high accuracy, which was made possible by this configuration15. Improved YOLOv5 was known for its CSPDarknet53 backbone, PANet for feature fusion, and a straightforward YOLO head for object detection, focusing on efficiency and simplicity.
YOLOv7
The improved YOLOv7 model was selected due to its enhanced performance in terms of speed and precision compared to previous versions. Its enhanced architecture includes several additional components, including an enhanced backbone (CSPDarknet53), the SAM block for an attention mechanism, and the PANet for feature fusion. Improved YOLOv7 introduced improvements such as the Spatial Attention Module (SAM) and modifications to the CSPDarknet53 backbone for enhanced feature extraction. These enhancements made it an ideal candidate for this research.
YOLOv8
The improved YOLOv8 is a recent iteration of the YOLO series that boasts improved performance, particularly concerning average precision. Its most significant enhancements include using an asymmetric loss to balance classification and localization and incorporating Mish activation to improve accuracy.
Anchor-Free Detection: YOLOv8 eliminates the need for anchor boxes by predicting the center of objects directly, simplifying the detection process and potentially increasing accuracy and speed by reducing the number of box predictions and streamlining Non-Maximum Suppression (NMS).
New Convolutions and Architectural Changes: YOLOv8 introduces C2f. modules, replacing C3 modules, and modifies the convolutional layers to improve feature extraction and information flow. This includes changes in the kernel sizes and the method of feature concatenation, aiming for a more efficient architecture.
Adaptive Training and Advanced Data Augmentation: MixUp and CutMix are used for more robust model training. YOLOv8 also optimizes training with adaptive learning rates and loss function balancing.
Customizable Architecture and Multiple Backbones: YOLOv8 supports EfficientNet, ResNet, and CSPDarknet, offering flexibility and customization for specific use cases.
Enhanced Speed and Accuracy: The model achieves faster inference speeds without sacrificing accuracy, positioning it as a leading solution for real-time object detection tasks.
Due to these promising improvements, we decided to include this model in our research.
Results and discussion
This section presents the results obtained from the models improved – YOLOv5, YOLOv7, and YOLOv8.
YOLOv5 results
The classification matrix from Fig. 11 compares the true labels (horizontal axis) against the predicted labels (vertical axis) for various electronic components and backgrounds. The diagonal cells represent the proportion of correct predictions for each class, with values such as 0.68 for batteries and 0.73 for circuit boards, indicating a higher rate of correct identification. Off-diagonal cells show misclassifications; IoT sensors are often misclassified as LCDs, as indicated by a value of 0.14. The color gradient from white to dark blue represents the scale of the proportions, with darker shades indicating higher values.

Confusion Matrix of the improved YOLOv5 in e-waste classification.
Figure 12 depicts the model’s ability to accurately identify and classify components in a hardware context. This demonstrates the model’s applicability in automated electronic inventory management and quality control systems.

The performance outcomes of the improved YOLOV5 model on the validation dataset.
The improved YOLOV5 model’s performance on the test dataset is depicted, highlighting its proficiency in identifying and classifying various electronic components such as resistors, capacitors, and voltage regulators, as displayed in Figure 13.

The performance outcomes of the improved YOLOV5 model on the test dataset.
The F1-Confidence Curve from Fig. 14 showcases the model’s performance for various electronic components, including batteries, capacitors, circuit boards, IoT sensors, LCDs, regulators, and resistors, as evaluated by the improved YOLOV5 model. The curve illustrates the trade-off between the F1 score and the confidence threshold for detection. A peak F1 score of 0.62 at a confidence level of 0.404 for all classes combined indicates optimal detection performance at this confidence threshold, suggesting a balanced precision-recall relationship achieved by the model across different component classes.

F1-Confidence curve for all the classes showcased by the improved YOLOV5 model.
Figure 15 provides a visual representation of the improved YOLOv5 model’s detection results, with the histogram showing the frequency of instances for each component class and the scatter plots depicting the spatial distribution and aspect ratios of detected objects. The histogram reveals that the model detected resistors most frequently, and the scatter plots suggest a consistent detection pattern across various scales and positions within the images. This visualization offers insights into the model’s precision and recall capabilities, reflecting its effectiveness in identifying and localizing electronic components in a dataset.

The improved YOLOV5 inference performance on a given dataset.
The improved YOLOv5 results are quantified in a series of graphs that track the model’s training and validation losses and its precision, recall, and mean Average Precision (mAP) over epochs. The graphs in Fig. 16 show a consistent decrease in loss metrics and increased precision and recall as training progresses, indicating the model’s improving accuracy in object detection. Notably, the mAP metrics for both 0.5 and 0.5:0.95 thresholds exhibit an upward trend, suggesting the model’s robust performance across different levels of detection difficulty.

Improved YOLOV5 model’s loss graph on the E-waste dataset.
Improved YOLOv7 RESULTS
Figure 17 illustrates the performance evaluation of the improved YOLOv7 model. Compared to the v5 result, the v7 model achieves higher accuracy for all classes, especially for the background classes. The matrix shows varying degrees of predictive accuracy, with perfect predictions for LCDs (1.00) and less accuracy for other components (e.g., resistors with a true positive rate of 0.67). The shades of blue represent the probability scores, with darker shades indicating higher probabilities. Each category also has false positives, indicated by the ‘background FP’ column. This suggests that the v7 model better distinguishes between background and objects in the dataset.

Confusion matrix of the improved YOLOv7 in E-waste classification.
Figure 18 depicts a montage of annotated results from an object detection model, specifically improved YOLOv7, tested on various electronic components, such as sensors, circuit boards, and regulators. Each component is boxed with a corresponding confidence score, demonstrating the model’s precision in identifying and classifying electronic items within a validation dataset. The high confidence scores, close to 1.0, indicate robust performance and accuracy in the model’s predictions.

The performance outcomes of the improved YOLOV7 model on the validation dataset.
Figure 19 illustrates the precision-recall trade-off for various electronic component categories using the improved YOLOv7 object detection model on a validation dataset. Each line represents an F1 score curve for a specific category across different confidence thresholds, such as batteries, capacitors, and sensors. The aggregate performance for all classes is highlighted, with an optimal F1 score of 0.62 achieved at a confidence level of 0.471, indicating balanced detection accuracy and reliability for the model across diverse electronic components.

F1-confidence curve for all the classes showcased by the improved YOLOv7 model.
Figure 20 comprehensively evaluates the improved YOLOv7 model on a validation dataset encapsulated through various performance metrics. The graphs display trends in loss for bounding box prediction (Box), objectness of detections, classification accuracy over epochs, and precision and recall curves. Additionally, the model’s mean Average Precision (mAP) is delineated for a single IoU threshold of 0.5 and a range from 0.5 to 0.95, signifying the model’s effectiveness in object detection tasks with an emphasis on the consistency of performance over different Intersection over Union (IoU) thresholds.

Improved YOLOv7 model’s loss graph on the E-waste dataset.
YOLOv8 results
The confusion matrix from Fig. 21 illustrates the performance evaluation of the proposed YOLOv8 model. The model achieves very high accuracy for all classes, with the highest correct prediction rates for IoT sensors (0.87) and LCDs (0.80). While it does show a high false positive rate for the background, similar to improved YOLOv5, the true positive rates for specific components are improved compared to both previous versions, indicating enhancements in the model’s learning and classification abilities. Overall, the v8 model results are very promising and suggest a significant improvement over the v5 and v7 models.

Confusion matrix of improved YOLOv8 in E-waste classification.
The image illustrates the performance outcomes of the improved YOLOV8 model on the validation dataset, highlighting its ability to detect and classify a wide range of electronic components with high accuracy. The displayed objects in Fig. 22 include IoT sensors, capacitors, batteries, and LCDs, each correctly identified and boxed, signifying the model’s precision.

The performance outcomes of the improved YOLOV8 model on the validation dataset.
Figure 23 showcases the validation results for the improved YOLOV8 model, demonstrating its refined object detection capabilities on electronic components such as resistors, capacitors, and voltage regulators. The images vividly showcase the model’s accuracy in identifying and delineating the boundaries of each component, with precise bounding boxes completely outclassing other YOLO models.

The performance outcomes of the improved YOLOV8 model on the test dataset.
The F1-Confidence Curve from Fig. 24 showcases the improved YOLOv8 model’s performance across individual classes. Achieving a peak F1 score of 0.63 at a confidence threshold of 0.375, YOLOv8 demonstrates significant improvements over previous iterations, like improved YOLOv5 and YOLOv7. This iteration represents a superior balance of precision and recall, indicating a more accurate and reliable performance in component classification tasks across multiple classes.

F1-confidence curve for all the classes showcased by the improved YOLOv8 model.
Figure 25 presents a comprehensive analysis of the improved YOLOv8 model’s object detection performance, featuring a histogram of instance counts per class and density plots for object localization. The histogram indicates the number of detected instances for each class, with ‘Resistor’ being the most prevalent, while the density plots reveal the distribution of object positions (x, y) and aspect ratios (width, height) across the dataset. This multi-faceted depiction underscores the model’s capability to recognize a wide variety of objects and accurately localize them within the image space, highlighting the advances of improved YOLOv8 in terms of both detection and contextual understanding of objects in images.

Improved YOLOV8 performance inference on a given dataset.
Figure 26 illustrates the superior performance of the improved YOLOV8 model compared to its predecessors, improved YOLOV5 and YOLOV7, as evidenced by the descending trend in both training and validation loss curves and the ascending precision and recall rates. The marked improvement in the mean Average Precision (mAP) scores, especially at the stringent 0.5 IoU threshold, highlights YOLOV8’s advancements in accurately detecting and classifying objects. These results underscore the model’s significant learning and predictive accuracy evolution, setting a new benchmark for object detection models.

YOLOV8 model’s loss graph on the E-waste dataset.
Discussion on the state-of-the-art comparison
Table 3 presents the performance results attained by each model on the data and Table 4 presents Performance of custom YOLOv5, v7 and v8 models on FICS PCB standard dataset.
The FICS-PCB Dataset, utilized by Hangwei Lu et al.24, has become one of the most often used datasets in recent years within the field of electrical components object recognition. The data included above is an annotated extract supplied by Roboflow25. The Roboflow dataset utilized herein comprises six classes: ICs, capacitors, resistors, inductors, transistors, and diodes, which are enumerated from 0 to 6 in the above table. Nonetheless, the YOLO models proposed in this study require significant enhancement regarding the classification of the FICS-PCB dataset, as the dataset was inherently limited and the training and testing splits were challenging to execute, which has hindered the performance capabilities of the YOLO models. This comparison depicted in Fig. 27 aims to ensure equitable and impartial results derived from this study.

Comparison of F1—confidence curve/interval results for the improved YOLOv5, YOLOv7, and YOLOv8 versions.
The rapid evolution of object detection algorithms, particularly in the realm of YOLO models, has significantly enhanced the capabilities of computer vision systems. This research critically evaluates the performance of three advanced iterations of the YOLO architecture—YOLOv5, YOLOv7, and YOLOv8—in the context of electronic waste classification. The comparative analysis focuses on the architectural nuances and operational efficacy of the above-mentioned models.
Improved YOLOv5, with its CSPDarknet53 backbone and PANet, demonstrated substantial capabilities in detecting various e-waste components. Its multi-scale prediction feature enabled it to recognize objects of different sizes, a vital attribute in e-waste management. Improved YOLOv7, building upon improved YOLOv5’s foundation, incorporated additional features like the Spatial Attention Module (SAM) block, improving focus on pertinent input areas and enhancing accuracy. However, both models faced challenges in object orientation detection, suggesting room for improvement.
Improved YOLOv8 emerges as a superior model in this research work. Its anchor-free detection method directly predicts an object’s center, eliminates the need for anchor box adjustments, and improves object localization accuracy. The enhanced CSPDarknet53 backbone in improved YOLOv8, incorporating GhostNet modules and reduced redundancy, further refines feature extraction. This architectural superiority is evident in YOLOv8’s performance. It demonstrated exceptional precision and accuracy, significantly reducing training time, a testament to its computational efficiency.
The research work’s dataset included seven distinct e-waste categories: resistors, capacitors, motherboards, regulators, batteries, LCDs, and IoT sensors. An in-depth analysis revealed variances in classification accuracy across these categories. Certain classes, like batteries and circuit boards, showed higher rates of correct identification than others, like IoT sensors and LCDs, which were prone to misclassification. This disparity can be attributed to several factors, including object size, shape, and texture differences, which affect the model’s detection capabilities.
The differential classification accuracy among e-waste categories can partly be explained by the feature learning theory in deep neural networks. This theory posits that the network learns to identify and extract features critical for classification tasks. Classes with distinct, easily discernible features tend to be classified more accurately than those with subtle or complex features. For instance, the different shapes and sizes of batteries and circuit boards might make it easier for the models to learn and identify them than the varied and intricate designs of IoT sensors and LCDs.
In conclusion, the improved YOLOv8 stands out as the most effective model for e-waste classification, primarily due to its advanced architectural features. The improved backbone network and anchor-free detection offer enhanced precision and efficiency. However, the research also highlights the need for continued refinement, especially in object orientation detection, to further enhance the model’s utility in diverse e-waste management scenarios. Future research could explore integrating these advanced models with emerging technologies to create more sophisticated, automated e-waste sorting systems. The ultimate goal remains to align technological advancements with environmental sustainability, paving the way for innovative solutions in global e-waste management.
Conclusion
This comprehensive research work critically evaluated the YOLOv5, YOLOv7, and YOLOv8 object detection models, specifically tailored to address the escalating challenges in electronic waste (e-waste) classification. The proposed research was driven by the urgency to develop efficient, accurate, and sustainable solutions for e-waste management, a burgeoning environmental concern. The findings from our research work distinctly highlight the superiority of the improved YOLOv8 model in terms of accuracy, precision, and training efficiency. This model’s advanced architecture, featuring Feature Pyramid Networks and an improved CSPDarknet53 backbone, sets it apart from its predecessors. Notably, improved YOLOv8 demonstrated remarkable performance in object detection with reduced training times, utilizing the computational strengths of the Tesla T4 GPU on Google Colab. This efficiency makes it exceptionally suitable for real-time e-waste detection applications. However, This research also unveiled certain limitations, primarily in object orientation detection. This aspect of YOLOv8’s functionality suggests a critical area for further development. Addressing this limitation can significantly enhance the model’s utility in complex and varied e-waste management scenarios.
The present research underlines the enormous potential and future scope for improvements in the YOLO architecture. Integrating these advanced models with emerging technologies is envisioned to create sophisticated automated e-waste sorting systems. Tailoring these models to cater to specific e-waste challenges, such as diverse material recognition and improved orientation sensitivity, is crucial to our future roadmap. Additionally, real-world implementation of these models and continuous refinement based on practical feedback will be pivotal in aligning technological innovation with environmental sustainability.
The implications of this research extend beyond mere technological advancements. It marks a significant step towards integrating innovative technological solutions with ecological responsibility. By setting a new benchmark in real-time object detection for e-waste management, this research work not only contributes to the field of environmental management but also aligns with global goals of resource conservation and environmental protection. Our work paves the way for future explorations that promise to revolutionize e-waste management systems, thereby substantially contributing to global sustainability efforts.
Data availability
Data supporting the findings will be available from Mr. Akhil Rajeev P (akhilrajeevpillai6419@gmail.com) upon reasonable request.
References
Kiddee, P., Naidu, R. & Wong, M. H. Electronic waste management approaches: An overview. Waste Manag. 33(5), 1237–1250 (2013).
Baldé, C.P., Forti, V., Gray, V., Kuehr, R. & Stegmann, P. The global e-waste monitor 2017: Quantities, flows and resources. United Nations University, International Telecommunication Union, and International Solid Waste Association (2017).
Rosebrock, A. Deep Learning for Computer Vision with Python, 1.3. 0. PyImageSearch. com. PyImageSearch. com. (2018).
Jiang, X., Zhou, W., Liu, M. & Liu, J. Automated sorting system for e-waste based on deep learning. J. Clean. Prod. 318, 128650 (2021).
Zhou, W., Liu, M., Liu, J. & Wang, X. E-waste component type identification using convolutional neural network. J. Clean. Prod. 270, 122418 (2020).
Huang, J., Rathod, V., Sun, C., Zhu, M., Korattikara, A., Fathi, A., Fischer, I., Wojna, Z., Song, Y., Guadarrama, S. and Murphy, K. Speed/accuracy trade-offs for modern convolutional object detectors. In Proceedings of the IEEE conference on computer vision and pattern recognition, 7310–7311 (2017).
Redmon, J., Divvala, S., Girshick, R. & Farhadi, A. You only look once: Unified, real-time object detection. İn Proceedings of the IEEE Conference on Computer Vision and Pattern Recognition, 779–788 (2016).
Bochkovskiy, A., Wang, C. Y. & Liao, H. Y. M. YOLOv4: Optimal speed and accuracy of object detection. arXiv preprint https://arxiv.org/abs/2004.10934 (2020).
Wang, J., Chen, Z. & Wang, X. An e-waste detection and sorting system based on YOLOv5 and transfer learning. J. Clean. Prod. 373, 133656 (2022).
Wang, C. Y., Bochkovskiy, A., Liao, H. Y. & Singh, K. YOLOv7-tiny: A lightweight and fast object detection model. arXiv preprint arXiv:2203.07360 (2022).
Wang, C. Y., Bochkovskiy, A. & Singh, K. YOLOv8-tiny: A lightweight and fast anchor-free object detection model. arXiv preprint arXiv:2204.06874 (2022).
Zhou, Y. A YOLO-NL object detector for real-time detection. Expert System. Appl. 238, 122256. https://doi.org/10.1016/j.eswa.2023.122256 (2024).
Wang, C. Y., Bochkovskiy, A. & Liao, H. Y. M. YOLOv7: Trainable bag-of-freebies sets new state-of-the-art for real-time object detectors. In Proceedings of the IEEE/CVF Conference on Computer Vision and Pattern Recognition, 7464–7475 (2023).
Lin, T. Y., Dollár, P., Girshick, R., He, K., Hariharan, B. & Belongie, S. Feature pyramid networks for object detection. İn Proceedings of the IEEE Conference on Computer Vision and Pattern Recognition, 2117–2125 (2017).
Li, Y., Zhang, W., Liu, Y., & Liu, Y. E-waste detection based on deep learning. In 2019 IEEE International Conference on Robotics and Biomimetics (ROBIO), 2372–2377 (IEEE, 2019).
Zhang, Y. & Liu, Y. A review of e-waste detection and sorting using deep learning. J. Clean. Prod. 369, 133135 (2022).
Wang, S. & Zhang, Y. A novel e-waste detection and sorting system based on YOLOv5 and transfer learning. Waste Manag. 154, 29–41 (2022).
Liu, X., Zhang, X. & Wang, X. A novel e-waste detection and sorting system based on YOLOv5 and ensemble learning. Waste Manag. 142, 365–374 (2022).
Chen, J., Zhang, Y. & Liu, Y. A novel e-waste detection and sorting system based on multi-scale feature fusion and YOLOv5. Waste Manag. 149, 755–768 (2022).
Alsubaei, F. S., Al-Wesabi, F. N. & Hilal, A. M. Deep learning-based small object detection and classification model for garbage waste management in smart cities and IoT environment. Appl. Sci. 12(5), 2281 (2022).
Lou, L., Lu, K. & Xue, J. Defect detection based on improved YOLOx for ultrasonic images (2024).
Bochkovskiy, A., Wang, C. Y., Liao, H. Y. & Singh, K. Improving the performance of YOLOv5 using spatial pyramid pooling. Sens. Imaging. 25 (10), 2–16 (2021) arXiv preprint arXiv:2108.03373.
Lundh, F. Python standard library. “O'Reilly Media, Inc.” (2001).
Lu, H., Mehta, D., Paradis, O., Asadizanjani, N., Tehranipoor, M. & Woodard, D. L. Fics-pcb: A multi-modal image dataset for automated printed circuit board visual inspection (2020).
FICS-PCB computer vision dataset by Manel. (n.d.). Roboflow. https://universe.roboflow.com/manel-0keik/fics-pcb/browse?queryText=&pageSize=50&startingIndex=0&browseQuery=true
Acknowledgements
The authors extend their thankfulness to researchers supporting project number (RSPD2025R800), king Saud university, Riyadh, Saudi Arabia
Ethics declarations
Competing interests
The authors declare no competing interests.
Additional information
Publisher’s note
Springer Nature remains neutral with regard to jurisdictional claims in published maps and institutional affiliations.
Rights and permissions
Open Access This article is licensed under a Creative Commons Attribution-NonCommercial-NoDerivatives 4.0 International License, which permits any non-commercial use, sharing, distribution and reproduction in any medium or format, as long as you give appropriate credit to the original author(s) and the source, provide a link to the Creative Commons licence, and indicate if you modified the licensed material. You do not have permission under this licence to share adapted material derived from this article or parts of it. The images or other third party material in this article are included in the article’s Creative Commons licence, unless indicated otherwise in a credit line to the material. If material is not included in the article’s Creative Commons licence and your intended use is not permitted by statutory regulation or exceeds the permitted use, you will need to obtain permission directly from the copyright holder. To view a copy of this licence, visit http://creativecommons.org/licenses/by-nc-nd/4.0/.
About this article

Cite this article
Rajeev, P.A., Dharewa, V., Lakshmi, D. et al. Advancing e-waste classification with customizable YOLO based deep learning models. Sci Rep 15, 18151 (2025). https://doi.org/10.1038/s41598-025-94772-x
Received:
Accepted:
Published:
DOI: https://doi.org/10.1038/s41598-025-94772-x