
Google AI Mode adds interactive charts for financial searches. See how this data visualization may affect SEO and content marketing strategies.
- Google AI Mode now creates custom charts and graphs when searching for financial data.
- Google previewed this feature at its annual I/O developer conference.
- The feature is currently experimental and available through labs.
Google has started rolling out interactive charts in AI Mode through Labs.
You can now ask complex financial questions and get both visual charts and detailed explanations.
The system builds these responses specifically for each user’s question.
Visual Analytics Come AI Mode
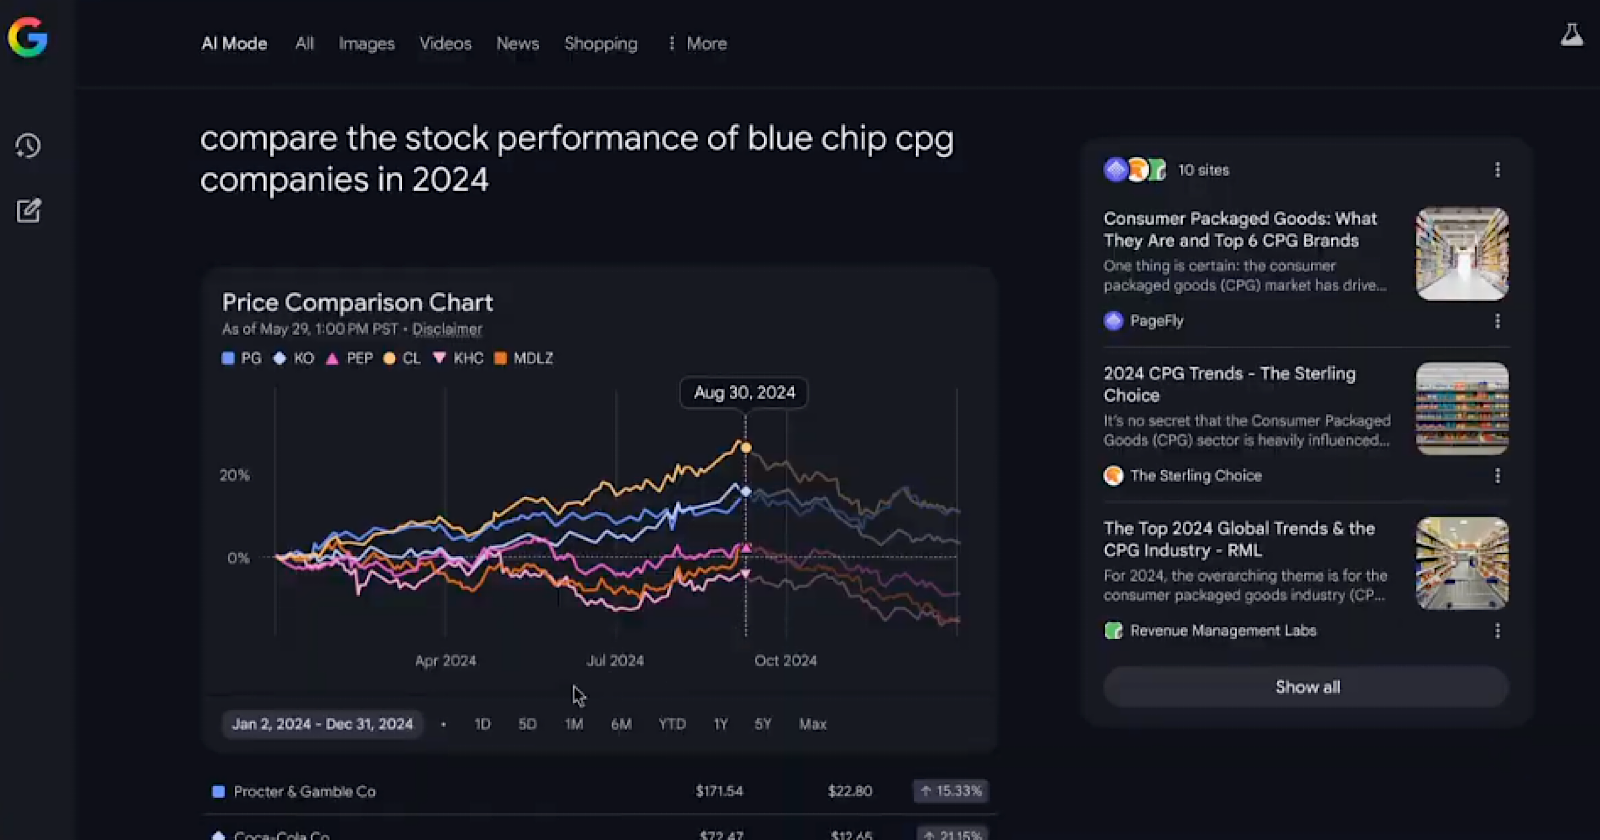
Soufi Esmaeilzadeh, Director of Product Management for Search at Google, explained that you can ask questions like “compare the stock performance of blue chip CPG companies in 2024” and get automated research with visual charts.
Google does the research work automatically. It looks up individual companies and their stock prices without requiring you to perform manual searches.
You can ask follow-up questions like “did any of these companies pay back dividends?” and AI Mode will understand what you’re looking for.
Technical Details
Google uses Gemini’s advanced reasoning and multimodal capabilities to power this feature.
The system analyzes what users are requesting, pulls both current and historical financial data, and determines the most effective way to present the information.
Implications For Publishers
Financial websites that typically receive traffic from comparison content should closely monitor their analytics. Google now provides direct visual answers to complex financial questions.
Searchers might click through to external sites less often for basic comparison data. But this also creates opportunities. Publishers that offer deeper analysis or expert commentary may find new ways to add value beyond basic data visualization.
Availability & Access
The data visualization feature is currently available through AI Mode in Labs. This means it’s still experimental. Google hasn’t announced plans for wider rollout or expansion to other types of data beyond financial information.
Users who want to try it out can access it through Google’s Labs program. Labs typically tests experimental search features before rolling them out more widely.
Looking Ahead
The trend toward comprehensive, visual responses continues Google’s strategy of becoming the go-to source for information rather than just a gateway to other websites.
While currently limited to financial data, the technology could expand to other data-heavy industries.
The feature remains experimental, but it offers a glimpse into how AI-powered search may evolve.