
Dimensions underlying the representational alignment of deep neural networks with humans
作者:Hebart, Martin N.
Main
Deep neural networks (DNNs) have achieved impressive performance, matching or surpassing human performance in various perceptual and cognitive benchmarks, including image classification1,2, speech recognition3,4 and strategic gameplay5,6. In addition to their excellent performance as machine learning models, DNNs have drawn attention in the field of computational cognitive neuroscience for their notable parallels to cognitive and neural systems in humans and animal models7,8,9,10,11. These similarities, observed through different types of behaviour or patterns of brain activity, have sparked a growing interest in determining both factors underlying these similarities and differences between human and DNN representations. From the machine learning perspective, understanding where DNNs exhibit a limited alignment with humans can support the development of better and more robust artificial intelligence (AI) systems. From the perspective of computational cognitive neuroscience, DNNs with stronger human alignment promise to be better candidate computational models of human cognition and behaviour12,13,14,15.
Much previous research on the alignment of human and artificial visual systems has compared behavioural strategies (for example, classification) in both systems and has revealed important limitations in the generalization performance of DNNs16,17,18,19,20. Other work has focused on directly comparing cognitive and neural representations in humans to those in DNNs, using methods such as representational similarity analysis (RSA21) or linear regression22,23,24,25. This quantification of alignment has led to a direct comparison of numerous DNNs across diverse visual tasks26,27,28,29, highlighting the role of factors such as architecture, training data or learning objective in determining the similarity to humans25,26,29,30.
Despite the appeal of summary statistics, such as correlation coefficients or explained variance, for comparing the representational alignment of DNNs with humans, they only quantify the degree of representational or behavioural alignment. However, without explicit hypotheses about potential causes for misalignment, such scalar measures are limited in their explanatory scope of which properties determine this degree of alignment, that is, which representational factors underlie the similarities and differences between humans and DNNs. Although diverse methods for interpreting DNN activations have been developed at various levels of analysis, ranging from single units to entire layers31,32,33,34,35, a direct comparability to human representations has remained a key challenge.
Inspired by recent work in cognitive sciences that has revealed core visual and semantic representational dimensions underlying human similarity judgements of object images36, here we propose a framework to systematically analyse and compare the dimensions that shape representations in humans and DNNs. In this work, we apply this framework to human visual similarity judgements and representations in a DNN trained to classify natural images. Our approach reveals numerous interpretable DNN dimensions that appear to reflect both visual and semantic image properties and that appear to be well aligned to humans. In contrast to humans, who showed a dominance of semantic over visual dimensions, DNNs exhibited a striking visual bias, demonstrating that downstream semantic behaviour is driven more strongly by different, primarily visual, strategies. Although psychophysical experiments on DNN dimensions underscored their global interpretability, a direct comparison with human dimensions revealed that DNN representations, in fact, only approximate human representations but lack the consistency expected from property-specific visual and semantic dimensions. Together, our results reveal key factors underlying the representational alignment and misalignment between humans and DNNs, shed light on potentially divergent representational strategies, and highlight the potential of this approach to identify the factors underlying the similarities and differences between humans and DNNs.
Results
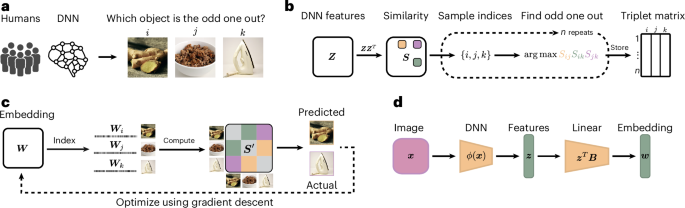
To improve the comparability of human and DNN representations, we aimed to identify the similarities and differences in core dimensions underlying human and DNN representations of images. To achieve this aim, we treated the neural network analogously to a human participant carrying out a cognitive behavioural experiment and then derived representational embeddings using a recent variational embedding technique37 from both human similarity judgements and a DNN on the same behavioural task (Methods). This approach ensured direct comparability between human and DNN representations. As a behavioural task, we chose a triplet odd-one-out similarity task, where from a set of three object images i, j and k, participants have to select the most dissimilar object (Fig. 1a; Supplementary Section D provides an analysis of the role of task instructions on triplet choice behaviour). In this task, the perceived similarity between two images i and j is defined as the probability of choosing these images to belong together across varying contexts imposed by a third object image k. By virtue of providing minimal context, the odd-one-out task highlights the information sufficient to capture the similarity between object images i and j across diverse contexts. In addition, it approximates human categorization behaviour for arbitrary visual and semantic categories, even for fairly diverse sets of objects36,37,38. Thus, by focusing on the building blocks of categorization that underlies diverse behaviours, this task is ideally suited for comparing object representations between humans and DNNs.

a, The triplet odd-one-out task in which a human participant or a DNN is presented with a set of three images and is asked to select the image that is the most different from the others. b, Sampling approach of odd-one-out decisions from DNN representations. First, a dot-product similarity space is constructed from the DNN features. Next, for a given triplet of objects, the most similar pair in this similarity space is identified, making the remaining object the odd one out. For humans, this sampling approach is based on observed behaviour, which is used as a measure of their internal cognitive representations. c, Illustration of the computational modelling approach to learn a lower-dimensional object representation for human participants and the DNN, optimized to predict behavioural choices made in the triplet task. d, Schematic of the interpretability pipeline that allows for the prediction of object embeddings from pretrained DNN features. The displayed images ginger, granola and iron are sourced from publicly available datasets and are licensed under a public domain license76. Images in a and c reproduced with permission from ref. 76, Springer Nature Limited.
For human behaviour, we used a set of 4.7 million publicly available odd-one-out judgements39 over 1,854 diverse object images, derived from the THINGS object concept and image database40. For the DNN, we collected similarity judgements for 24,102 images of the same objects used for humans (1,854 objects with 13 examples per object). We used a larger set of object images since the DNN was less limited by constraints in dataset size than humans. This allowed us to obtain more precise estimates of their representation. To derive DNN representations, we chose a pretrained VGG-16 model41, given its common use in the computational cognitive neurosciences. Specifically, this network has been shown to exhibit good correspondence to both human behaviour17 and measured neural activity9,27,42 and performs well at predicting human similarity judgements24,25,30,43,44,45. VGG-16 was trained on the 1,000-class ImageNet dataset46, which contains a diverse range of image categories, such as animals, everyday objects and scenes. However, for completeness, we additionally ran similar analyses for a broader range of neural network architectures (Supplementary Section A). We focused on penultimate layer activations as they are the closest to the behavioural output, and they also showed closest representational correspondence to humans (Supplementary Section B). For the DNN, we generated a dataset of behavioural odd-one-out choices for the 24,102 object images (Fig. 1b). To this end, we first extracted the DNN layer activations for all the images. Next, for a given triplet of activations zi, zj and zk, we computed the dot product between each pair as a measure of similarity, then identified the most similar pair of images in this triplet and designated the remaining third image as the odd one out. Given the excessively large number of possible triplets for all 24,102 images, we approximated the full set of object choices from a random subset of 20 million triplets47.
From both sets of available triplet choices, we next generated two representational embeddings, one for humans and one for the DNN, where each embedding was optimized to predict the odd-one-out choices in humans and DNNs, respectively. In these embeddings, each object is described through a set of dimensions that represent interpretable object properties. To obtain these dimensions and for comparability to previous work in humans36,37,38, we imposed sparsity and non-negativity constraints on the optimization, which support their interpretability and provide cognitively plausible criteria for dimensions36,39,48,49,50,51. Sparsity constrained the embedding to consist of fewer dimensions, motivated by the observation that real-world objects are typically characterized by only a few properties. Non-negativity encouraged a parts-based description, where dimensions cannot cancel each other out. Thus, a dimension’s weight indicated its relevance in predicting an object’s similarity to other objects. During training, each randomly initialized embedding was optimized using a recent variational embedding technique37 (see the ‘Embedding optimization and pruning’ section). The optimization resulted in two stable, low-dimensional embeddings, with 70 reproducible dimensions for DNN embedding and 68 for human embedding. The DNN embedding captured 84.03% of the total variance in image-to-image similarity, whereas the human embedding captured 82.85% of the total variance and 91.20% of the explainable variance given the empirical noise ceiling of the dataset.
DNN dimensions reflect diverse image properties
Having identified stable, low-dimensional embeddings that are predictive of triplet odd-one-out judgements, we first assessed the interpretability of each identified DNN dimension by visualizing object images with large numeric weights. In addition to this qualitative assessment, we validated these observations for the DNN by asking 12 (6 female and 6 male) human participants to provide labels for each dimension separately (see the ‘Labelling dimensions and construction of word clouds’ section). Similar to the core semantic and visual dimensions underlying odd-one-out judgements in humans described previously36,37,39, the DNN embedding yielded many interpretable dimensions, which appeared to reflect both semantic and visual properties of objects. The semantic dimensions included taxonomic membership (for example, related to food, technology and home) and other knowledge-related properties (for example, softness), whereas the visual dimensions reflected visual-perceptual attributes (for example, round, green and stringy), with some dimensions reflecting a composite of semantic and visual properties (for example, green and organic) (Fig. 2a). Of note, the DNN dimensions also revealed a sensitivity to basic shapes, including roundness, boxiness and tube shape. This suggests that in line with earlier studies52,53, DNNs indeed learn to represent basic shape properties, an aspect that might not be apparent in their overt behaviour54.

a, Visualization of example dimensions from human- and DNN-derived representational embeddings, with a selection of dimensions that had been rated as semantic, mixed visual–semantic and visual, alongside their dimension labels obtained from human judgements. Note that the displayed images reflect only images with a public domain license and not the full image set76. b, Rating procedure for each dimension, which was based on visualizing the top k images according to their numeric weights. Human participants labelled each of the human and DNN dimensions as predominantly semantic, visual, mixed visual–semantic or unclear (unclear ratings are not shown; 7.35% of all dimensions are for humans and 8.57%, for VGG-16). c, Relative importance of dimensions labelled as visual and semantic, where VGG-16 exhibited a dominance of visual and mixed dimensions relative to humans that showed a clear dominance of semantic dimensions. Images in a and b reproduced with permission from ref. 76, Springer Nature Limited.
Despite the apparent similarities, there were, however, striking differences found between humans and the DNN. First, overall, DNN dimensions were less interpretable than human dimensions, as confirmed by the evaluation of all dimensions by two independent raters (Supplementary Section C). This indicates a global difference in how the DNN assigns images as being conceptually similar to each other. Second, although human dimensions were clearly dominated by semantic properties, many DNN dimensions were more visual perceptual in nature or reflected a mixture of visual and semantic information. We quantified this observation by asking the same two independent experts to rate human and DNN dimensions according to whether they were primarily visual perceptual, semantic, reflected a mixture of both or were unclear (Fig. 2b). To confirm that the results were not an arbitrary byproduct of the chosen DNN architecture, we provided the raters with four additional DNNs for which we had computed additional representational embeddings. The results revealed a clear dominance of semantic dimensions in humans, with only a small number of mixed dimensions. By contrast, for DNNs, we found a consistently larger proportion of dimensions that were dominated by visual information or that reflected a mixture of both visual and semantic information (Fig. 2c and Supplementary Fig. 1b for all DNNs). This visual bias is also present across intermediate representations of VGG-16 and even stronger in early to late convolutional layers (Supplementary Fig. 2). This demonstrates a clear difference in the relative weight that humans and DNNs assign to visual and semantic information, respectively. We independently validated these findings using semantic text embedding and observed a similar pattern of visual bias (Supplementary Section E indicates that the results were not solely a product of human rater bias).
Linking DNN dimensions to their interpretability
Despite the overall differences in human and DNN representational dimensions, the DNN also contained many dimensions that appeared to be interpretable and comparable to those found in humans. Next, we aimed at testing to what degree these interpretable dimensions truly reflected specific visual or semantic properties, or whether they only superficially appeared to show this correspondence. To this end, we experimentally and causally manipulated images and observed the impact on dimension scores. Beyond general interpretability, these analyses further establish which visual properties in each image drive individual dimensions and, thus, determine image representations.
Image manipulation requires a direct mapping from input images to the embedding dimensions. However, the embedding dimensions were derived using a sampling-based optimization based on odd-one-out choices inferred from penultimate DNN features. Consequently, this approach does not directly map these features to the learned embedding. To establish this mapping, we applied ℓ2-regularized linear regression to link the DNN’s penultimate layer activations to the learned embedding. This mapping then enables the prediction of embedding dimensions from the penultimate feature activations in response to novel or manipulated images (Fig. 1d). Penultimate layer activations were indeed highly predictive of each embedding dimension, with all dimensions exceeding an R2 of 75%, and the majority exceeding 85%. Thus, this allowed us to accurately predict the dimension values for novel images.
Having established an end-to-end mapping between the input image and individual object dimensions, we next used three approaches to both probe the consistency of the interpretation and identify dimension-specific image properties. First, to identify image regions relevant for each individual dimension, we used Grad-CAM55, an established technique for providing visual explanations. Grad-CAM generates heat maps that highlight the image regions that are the most influential for model predictions. Unlike the typical use of Grad-CAM, which focuses on generating visual explanations for model classifications (for example, dog versus cat), we used Grad-CAM to reveal which image regions drive the dimensions in the DNN embedding. The results of this analysis are illustrated with example images in Fig. 3. Object dimensions were indeed driven by different image regions that contain relevant information, in line with the dimension’s interpretation derived from human ratings and suggesting that the representations captured by the DNN’s penultimate layer allow us to distinguish between different parts of the image that carry different functional importance.

a, General methodology of the approach. We used Grad-CAM55 to visualize the importance of distinct image parts based on the gradients of the penultimate DNN features that we initially used to sample triplet choices. The gradients were obtained in our fully differentiable interpretability model with respect to a dimension w in our embedding. b, We visualize the heat maps for three different images and dimensions. Each column shows the relevance of parts of an image for that dimension. For this figure, we filtered the embedding by images available in the public domain76. Credit: torch in b, Cezary Borysiuk under a Creative Commons license CC BY 2.0; wineglass in b, Wojtek Szkutnik under a Creative Commons license CC BY-SA 2.0. Images in a and b reproduced with permission from ref. 76, Springer Nature Limited.
As the second image explanation approach, to highlight which image properties drive a dimension, we used a generative image model to create novel images optimized for maximizing the values of a given dimension31,56,57. Unlike conventional activation maximization targeting a single DNN unit or a cluster of units, our approach aimed to selectively amplify activation in dimensions of the DNN embedding across the entire DNN layer, using a pretrained generative adversarial neural network (StyleGAN-XL58). To achieve this, we applied our linear end-to-end mapping to predict the embedding dimensions from the penultimate activations in response to the images generated by StyleGAN-XL. The results of this procedure are shown in Fig. 4b. The approach successfully generated images with high numerical values in the dimensions of our DNN embedding. Indeed, the properties highlighted by these generated images appear to align with human-assigned labels for each specific dimension, again suggesting that the DNN embedding contained conceptually meaningful and coherent object properties similar to those found in humans.

a, Using StyleGAN-XL58, we optimized a latent code to maximize the predicted response in a specific embedding dimension. b, Visualizations for different dimensions in our embedding. We show the top ten images that score the highest in the dimension and the corresponding top ten generated images. For this figure, we filtered the embedding by images available in the public domain76. Images in a and b reproduced with permission from ref. 76, Springer Nature Limited.
As the third image explanation approach, given that different visual properties naturally co-occur across images, and to unravel their respective contribution, we causally manipulated individual image properties and observed the effect on the predicted DNN dimensions. We exemplify this approach with manipulations in colour, object shape and background (Supplementary Section F), largely confirming our predictions, showing specific activation decreases or increases in dimensions that appeared to be representing these properties.
Factors driving human and DNN similarities and differences
The previous results have confirmed the overall consistency and interpretation of the DNN’s visual and semantic dimensions based on common interpretability techniques. However, a direct comparison with human image representations is crucial for identifying which representational dimensions align well and which do not. Traditional RSA provides a global metric of representational alignment, revealing a moderate correlation (Pearson’s r = 0.55) between the representational similarity matrices (RSMs) of humans and the DNN (Fig. 5a). Although this indicates some degree of alignment in the object image representations, it does not clarify the factors driving this alignment. To address this challenge, we directly compared pairs of dimensions from both embeddings, pinpointing which dimensions contributed the most to the overall alignment and which dimensions were less well aligned.

a, RSMs reconstructed from human and VGG-16 embedding. Each row represents an object, with rows sorted into 27 superordinate categories (for example, animal, food and furniture) from ref. 40 to better highlight similarities and differences in representation. b, Pairwise correlations between human and VGG-16 embedding dimensions. c, Cumulative RSA analysis that shows the amount of variance explained in the human RSM as a function of the number of DNN dimensions. The black line shows the number of dimensions required to explain 95% of the variance. d–f, Intersection (red and blue regions) and differences (orange and green regions) between three highly correlating human and DNN dimensions. The pink circles denote the intersection of the red and blue regions, that is, where the same image scores highly in both dimensions. For this figure, we filtered the embedding by images from the public domain76. For three images without a public domain version, visually similar replacements were used. Images in d–f reproduced with permission from ref. 76, Springer Nature Limited.
For each human dimension, we identified the most strongly correlated DNN dimension, once without replacement (unique) and once with replacement, and sorted the dimensions based on their fit (Fig. 5b). This revealed a close alignment, with Pearson’s reaching up to r = 0.80 for a select few dimensions, which gradually declined across other representational dimensions. To determine whether the global representational similarity was driven by just a few well-aligned dimensions or required a broader spectrum of dimensions, we assessed the number of dimensions needed to explain human similarity judgements. The analysis revealed that 40 dimensions were required to capture 95% of the variance in representational similarity with the human RSM (Fig. 5c). Although this number is much smaller than the original 4,096-dimensional VGG-16 layer, these results demonstrate that the global representational similarity is not solely driven by a small number of well-aligned dimensions.
Given the imperfect alignment of DNN and human dimensions, we explored the similarities and differences in the stimuli represented by these dimensions. For each dimension, we identified which images were the most representative of both humans and the DNN. Crucially, to highlight the discrepancies between the two domains, we then identified which images exhibited strong dimension values for humans but weak values for the DNN, and vice versa (Fig. 5d–f). Although the results indicated similar visual and semantic representations in the most representative images, they also exposed clear divergences in dimension meanings. For instance, in an animal-related dimension, humans consistently represented animals even for images in which the DNN exhibited very low dimension values. Conversely, the DNN dimension strongly represented objects that were not animals, such as natural objects, cages or mesh (Fig. 5d). Similarly, a string-related dimension maintained a string-like representation in humans but included other objects in the DNN that were not string like, potentially reflecting properties related to thin, curvy objects or specific image properties (Fig. 5f).
Relevance of object dimensions for categorization behaviour
Since internal representations do not necessarily translate into behaviour, we next addressed whether this misalignment would translate to downstream behavioural choices. To this end, we used a jackknife resampling procedure to determine the relevance of individual dimensions for odd-one-out choices. For each triplet, we iteratively pruned dimensions in both human and DNN embeddings and observed changes in the predicted probabilities of selecting the odd one out, yielding an importance score for each dimension for the odd-one-out choice (Fig. 6a). The results of this analysis showed that although humans and DNNs often aligned in their representations and choices, a sizable fraction of choices exhibited the same behaviour despite strong differences in representations (Fig. 6b). For behavioural choices, the semantic bias in humans was enhanced, as evidenced by an even stronger importance of semantic relative to visual or mixed dimensions in humans compared with DNNs. Individual triplet choices were affected not only by semantic dimensions but also by visual dimensions (Fig. 6c–f). Together, these results demonstrate that the differences in how humans and DNNs represent object images not only translate into behavioural choices but are also further amplified in their categorization behaviour.

a, Overview of the approach. For one triplet, we computed the original predicted softmax probability based on the entire representational embedding for each object image in the triplet. We then iteratively pruned individual dimensions from the representational embedding and stored the resulting change in the predicted softmax probability—relative to that of the full embedding—as a relevance score for that dimension. b, We calculated the relevance scores for a random sample of 10 million triplets and identified the most relevant dimension for each triplet. We then labelled the 10 million most relevant dimensions according to human-labelled visual properties as semantic, mixed visual–semantic, visual or unclear. Semantic dimensions are the most relevant for human behavioural choices, whereas for VGG-16, visual and mixed visual–semantic properties are more relevant. c–f, We rank the sorted changes in softmax probability to find triplets in which human and the DNN maximally diverge. Each panel shows a triplet with the behavioural choice made by humans and the DNN. We visualized the most relevant dimension for that triplet alongside the distribution of relevance scores. Each dimension is assigned its human-annotated label. For this figure, we filtered the embedding by images from the public domain76. Images in a and c–f reproduced with permission from ref. 76, Springer Nature Limited.
Discussion
A key challenge in understanding the similarities and differences in humans and AI lies in establishing ways to make these two domains directly comparable. Overcoming this challenge would allow us to identify strategies to make AI more human like17 and for using AI as an effective model of human perception and cognition. In this work, we propose a framework to identify interpretable factors that determine the similarities and differences between human and AI representations. In this framework, these factors can be identified by using the same experiment to probe behaviour in humans and AI systems and applying the same computational strategy to natural and artificial responses to infer their respective interpretable embeddings. We applied this approach to human similarity judgements and representations of DNNs trained on natural images with varying objectives, with a primary focus on an image classification model. This allowed for a direct, meaningful comparison of the representations underlying human similarity judgements with the representations of the image classification model.
Our results revealed that the DNN contained representations that appeared to be similar to those found in humans, ranging from visual (for example, ‘white’, ‘circular/round’ and ‘transparent’) to semantic properties (for example, ‘food related’ and ‘fire related’). However, a direct comparison with humans showed largely different strategies for arriving at these representations. Although human representations were dominated by semantic dimensions, the DNN exhibited a pronounced bias towards visual or mixed visual–semantic dimensions. In addition, a direct comparison of seemingly aligned dimensions revealed that DNNs only approximated the semantic representations found in humans. These different strategies were also reflected in their behaviour, where similar behavioural outcomes were based on different embedding dimensions. Thus, despite seemingly well-aligned human and DNN representations at a global level, deriving dimensions underlying the representational similarities provided a more complete and more fine-grained picture of this alignment, revealing the nature of the representational strategies that humans and DNNs use12,14,59.
Although approaches like RSA21,60 are particularly useful for comparing one or multiple representational spaces, they typically provide only a summary statistic of the degree of alignment and require explicit hypotheses and model comparisons to determine what it is about the representational space that drives human alignment. By contrast, other approaches have focused specifically on the interpretability of DNN representations31,32,34,35,61,62,63, but either provide very specific local measures about DNN units or have limited direct comparability with human representations, as the same interpretability methods can typically not be applied to understand human mental representations. Our framework combines the strengths of the comparability gained from RSA and existing interpretability methods to understand image representations in DNNs. We applied common interpretability methods to show that our approach allows for detailed experimental testing and causal probing of DNN representations and behaviour across diverse images. Yet, only the direct comparison with human representations revealed the diverging representational strategies of humans and DNNs and, thus, the limitations of the visualization techniques we used64.
Our results are consistent with previous work indicating that DNNs make use of strategies that deviate from those used in humans65,66. Beyond previously discovered biases, here we found a visual bias in DNNs that diverges from a semantic bias in humans for similarity judgements. In particular, even the highest layers in DNNs retained strong visual biases for solving the tasks they had been trained on, including image classification or linking images with text, both of which can be described as semantic tasks with different degrees of richness. This visual strategy may, of course, reflect how our visual system solves core object recognition67. Indeed, it is an open question to what extent human core object recognition relies on a similar visual bias68 and whether this bias is also found in the anterior ventral–temporal cortex69, which is known to be involved in high-level object processing70 However, even if humans used a primarily visual strategy for solving core object recognition, our findings would demonstrate a significant limitation of DNNs in capturing human mental representations as measured with similarity judgements, despite similar representational geometries71.
Interestingly, CLIP, a more predictive model of human cortical visual processing26,29, retained a visual bias despite training on semantic image descriptions, showing that the classification objective alone is not sufficient for explaining visual bias in DNNs. At the same time, the visual bias in CLIP was smaller (Supplementary Fig. 1b), indicating that better models of high-level visual processing may also be models with a larger semantic bias and pointing towards potential strategies for improving their alignment with humans, which may involve multimodal pretraining or larger, more diverse datasets29. Future work would benefit from a systematic comparison of different DNNs to identify what factors determine visual bias and their alignment with human brain and behavioural data.
Although these results indicate that studying core dimensions of DNN representations can improve our understanding of the factors required to identify better models of human mental representations, it has also been demonstrated recently that aligning DNNs with human representations can improve DNN robustness and performance at out-of-distribution tasks28,72. This work highlights that identifying visual bias may be useful not only for understanding representational and behavioural differences between humans and DNNs but also for guiding future work determining the gaps in human–AI alignment and identifying adjustments in architecture and training needed to reduce this bias59. Further work is needed to clarify the role of task instructions in human–AI alignment across diverse tasks and instructions73.
The framework introduced in this work can be expanded in several ways. Future work could use this approach to explore what factors make DNNs similar or different from one another. A comprehensive analysis of various DNN architectures, objectives or datasets25,26,28 could uncover the factors underlying representational alignment, and extension to other stimuli, tasks and domains, including brain recordings. Together, this framework promises a more comprehensive understanding of the relationship between human and AI representations, providing the potential to identify better candidate models of human cognition and behaviour and more human-aligned artificial cognitive systems.
Methods
Triplet odd-one-out task
In the triplet odd-one-out task, participants are presented with three objects and must choose the one that is least similar to the others, that is, the odd one out. We define a dataset \({\mathcal{D}}:={\left\{\left(\{{i}_{s},{j}_{s},{k}_{s}\},\{{a}_{s},{b}_{s}\}\right)\right\}}_{s = 1}^{n}\), where n is the total number of triplets and {is, js, ks} is a set of three unique objects, with {as, bs} being the pair among them determined as the most similar. We used a dataset of human responses36 to learn an embedding of human object concepts. In addition, we simulated the triplet choices from a DNN. For the DNN, we simulated these choices by computing the dot product of the penultimate layer activation \({{\bf{z}}}_{i}\in {{\mathbb{R}}}_{+}\) after applying the rectified linear unit function, where \({S}_{ij}={{\bf{z}}}_{i}^{\top }{{\bf{z}}}_{j}\). The most similar pair {as, bs} was then identified by the largest dot product:
$$\{{a}_{s},{b}_{s}\}=\mathop{{\rm{arg}}\,{\rm{max}}}\limits_{({x}_{s},{y}_{s})\in \{({i}_{s},\,{j}_{s}),({i}_{s},{k}_{s}),({j}_{s},{k}_{s})\}}\left\{{{\bf{z}}}_{{x}_{s}}^{\top }{{\bf{z}}}_{{y}_{s}}\right\}.$$
(1)
Using this approach, we sampled the triplet odd-one-out choices for a total of 20 million triplets for the DNN.
Embedding optimization and pruning
Optimization
Let \({W}\in {{\mathbb{R}}}^{m\times p}\) denote a randomly initialized embedding matrix, where p = 150 is the initial embedding dimensionality. To learn interpretable concept embeddings, we used variational interpretable concept embeddings (VICE), an approximate Bayesian inference approach37. VICE performs mean-field variational inference to approximate the posterior distribution \(p({W}| {\mathcal{D}})\) with a variational distribution, qθ(W), where \({q}_{\theta }\in {\mathcal{Q}}\).
VICE imposes sparsity on the embeddings using a spike-and-slab Gaussian mixture before updating the variational parameters θ. This prior encourages shrinkage towards zero, with the spike approximating a Dirac delta function at zero (responsible for sparsity) and the slab modelled as a wide Gaussian distribution (determining non-zero values). Therefore, it is a sparsity-inducing prior and can be interpreted as a Bayesian version of the elastic net74. The optimization objective minimizes the Kullback–Leibler divergence between the posterior and approximate distributions:
$$\begin{array}{ll}\mathop{{\rm{arg}}\,{\rm{min}}}\limits_{\theta }\,{{\mathbb{E}}}_{{q}_{\theta}({W})}\vphantom{\frac{1}{n}\mathop{\sum}\limits_{s=1}^{n}}\left[\displaystyle\frac{1}{n}\log\left[{q}_{\theta }({W})-\log p({W})\left.\right)\right]\right.\\\left.-\displaystyle\frac{1}{n}\mathop{\sum}\limits_{s=1}^{n}\log p\left[\left(\{{a}_{s},{b}_{s}\}| \{{i}_{s},{j}_{s},{k}_{s}\},{W}\right)\right]\right],\end{array}$$
(2)
where the left term represents the complexity loss and the right term is the data log-likelihood.
Pruning
Since the variational parameters are composed of two matrices, one for the mean and one for the variance, that is, θ = {μ, σ}, we can use the mean representation μi as the final embedding for an object i. Imposing sparsity and positivity constraints improves the interpretability of our embeddings, ensuring that each dimension meaningfully represents distinct object properties. Although sparsity is guaranteed via the spike-and-slab prior, we enforced non-negativity by applying a rectified linear unit function to our final embedding matrix, thereby guaranteeing that \({W}\in {{\mathbb{R}}}_{+}^{m\times p}\). Note that this is done both during optimization and at inference time. We used the same procedure as in ref. 37 for determining the optimal number of dimensions. Specifically, we initialized our model with p = 150 dimensions and reduced the dimensionality iteratively by pruning dimensions based on their probability of exceeding a threshold set for sparsity:
$$\,\text{Prune if}\,\Pr ({w}_{ij} > 0) < 0.05\,\,\text{for fewer than five objects}\,,$$
(3)
where wij is the weight associated with object i and dimension j. Training stopped either when the number of dimensions remained unchanged for 500 epochs or when the embedding was optimized for a maximum of 1,000 epochs.
Embedding reproducibility and selection
We assessed reproducibility across 32 model runs with different seeds using a split-half reliability test. We chose the split-half reliability test for its effectiveness in evaluating the consistency of our model’s performance across different subsets of data, ensuring robustness. We partitioned the objects into two disjoint sets using odd and even masks. For each model run and every dimension in an embedding, we identified the dimension that is the most highly correlated among all the other models by using an odd mask. Using the even mask, we correlated this highest match with the corresponding dimension. This process generated a sampling distribution of Pearson’s r coefficients for all the model seeds. We subsequently Fisher z transformed the Pearson’s r sampling distribution. The average z-transformed reliability score for each model run was obtained by taking the mean of these z scores. Inverting this average provides an average Pearson’s r reliability score (Supplementary Section G). For our final model and all subsequent analyses, we selected the embedding with the highest average reproducibility across all dimensions.
Labelling dimensions and construction of word clouds
We assigned labels to the human embedding by pairing each dimension with its highest correlating counterpart from ref. 36. These dimensions were derived from the same behavioural data, but using a non-Bayesian variant of our method. We then used the human-generated labels that were previously collected for these dimensions, without allowing for repeats.
For the DNN, we labelled dimensions using human judgements. This allowed us to capture a broad and nuanced understanding of each dimension’s characteristics. To collect human judgements, we asked 12 laboratory participants (6 male, 6 female; mean age, 29.08 years; s.d., 3.09 years; range, 25–35 years) to label each DNN dimension. Participants were presented with a 5 × 6 grid of images, with each row representing a decreasing percentile of importance for that specific dimension. The top row contained the most important images, and the following rows included images within the 8th, 16th, 24th and 32nd percentiles. Participants were asked to provide up to five labels that they thought best described each dimension. Word clouds showing the provided object labels were weighted by the frequencies of occurrence, and the top six labels were visualized. Due to computer crashes during data acquisition, three participants had incomplete data (32%, 80% and 93%).
Study participation was voluntary, and participants were not remunerated for their participation. This study was conducted in accordance with the Declaration of Helsinki and was approved by the local ethics committee of the Medical Faculty of the University Medical Center Leipzig (157/20-ek).
Dimension ratings
Two independent experts rated the dimensions according to two questions. The first question asked whether the dimensions were primarily visual perceptual, semantic conceptual, a mix of both or whether their nature was unclear. For the second question, they rated the dimensions according to whether they reflected a single concept, several concepts or were not interpretable. Overall, both raters agreed agreed 81.86% of the time for question 1 and 90.00% of the time for question 2. Response ambiguity was resolved by a third rater (Supplementary Sections A–C). All raters were part of the laboratory but were blind to whether the dimensions were model or human generated.
Convolutional embeddings
We additionally learned embeddings from early (convolutional block 1), middle (convolutional block 3) and late (convolution block 5) convolutional layers of VGG-16. For this, we applied global average pooling to the spatial dimensions of the feature maps and then sampled triplets from the averaged one-dimensional representations.
Dimension value maximization
To visualize the learned object dimensions, we used an activation maximization technique with a pretrained StyleGAN-XL generator \({\mathcal{G}}\) (ref. 58). Our approach combines sampling with gradient-based optimization to generate images that maximize specific dimension values in our embedding space.
Initial sampling
We started by sampling a set of N = 100,000 concatenated noise vectors \({{\bf{v}}}_{i}\in {{\mathbb{R}}}^{d}\), where d is the dimensionality of the StyleGAN-XL latent space. For each noise vector, we generated an image \({{\bf{x}}}_{i}={\mathcal{G}}({{\bf{v}}}_{i})\) and predicted its embedding \({\hat{{\bf{y}}}}_{i}\in {{\mathbb{R}}}^{p}\) using our pipeline, where p is the number of dimensions in our embedding space.
For a given dimension j, we selected the top k images that yielded the highest values for \({\hat{y}}_{ij}\), the jth component of \(\hat{{{\bf{y}}}_{i}}\). These images served as starting points for our optimization process.
Gradient-based optimization
To refine these initial images, we performed gradient-based optimization in the latent space of StyleGAN-XL. Our objective function \({{\mathcal{L}}}_{{\rm{AM}}}\) balances two goals: increasing the absolute value of the embedding for dimension j and concentrating probability mass towards dimension j. Formally, we define \({{\mathcal{L}}}_{{\rm{AM}}}\) as
$${{\mathcal{L}}}_{{\rm{AM}}}({{\bf{v}}}_{i})=-\alpha {\hat{y}}_{ij}-\beta \log\left[p\left({\hat{y}}_{ij}| {{\bf{z}}}_{i}\right)\right],$$
(4)
where \({{\bf{z}}}_{i}=f({\mathcal{G}}({{\bf{v}}}_{i}))\) denotes the penultimate features extracted from the generated image using the pretrained VGG-16 classifier f. The term on the left, referred to as the dimension size reward, contributes to increasing the absolute value \(\hat{y}_{ij}\) for the object dimension j. The term on the right, referred to as the dimension specificity reward, concentrates probability mass towards a dimension without necessarily increasing its absolute value. The balance between these two objectives is controlled by the scalars α and β. The objective \({{\mathcal{L}}}_{{\rm{AM}}}\) was minimized using vanilla stochastic gradient descent. Importantly, only the latent code vector vi was updated, and keeping the parameters of \({\mathcal{G}}\), the VGG-16 classifier f and the embedding model fixed.
This optimization process was performed for each of the top k images selected in the initial sampling phase. The resulting optimized images provide visual representations that maximally activate specific dimensions in our learned embedding space, offering insights into the semantic content captured by each dimension.
Highlighting image properties
To highlight the image regions driving individual DNN dimensions, we used Grad-CAM. For each image, we performed a forward pass to obtain an image embedding and computed gradients using a backward pass. We next aggregated the gradients across all the feature maps in that layer to compute an average gradient, yielding a two-dimensional dimension importance map.
RSA analyses
We used RSA to compare the structure of our learned embeddings with human judgements and DNN features. This analysis was conducted in three stages: human RSA, DNN RSA, and a comparative analysis between human and DNN representations.
Human RSA
We reconstructed a similarity matrix from our learned embedding. Given a set of objects \({\mathcal{O}}={o}_{1},\ldots ,{o}_{m}\), we computed the similarity Sij between each pair of objects (oi, oj) using the softmax function:
$${S}_{ij}=\frac{1}{| {\mathcal{O}}\setminus \{{o}_{i},{o}_{j}\}| }\sum _{k\in {\mathcal{O}}\setminus \{{o}_{i},{o}_{j}\}}\frac{\exp \left({{\bf{y}}}_{i}^{\top }{{\bf{y}}}_{j}\right)}{\exp \left({{\bf{y}}}_{i}^{\top }{{\bf{y}}}_{j}\right)+\exp \left({{\bf{y}}}_{i}^{\top }{{\bf{y}}}_{k}\right)+\exp \left({{\bf{y}}}_{j}^{\top }{{\bf{y}}}_{k}\right)},$$
(5)
where yi is the embedding of object oi, and the softmax function returns the probability of oi being more similar to ok than oj. To evaluate the explained variance, we used a subset of 48 objects for which a fully sampled similarity matrix and associated noise ceilings were available from previous work36. We then computed the Pearson correlation between our predicted RSM and the ground-truth RSM for these 48 objects.
DNN RSA
We followed a similar procedure, reconstructing the RSM from our learned embedding of the DNN features. We then correlated this reconstructed RSM with the ground-truth RSM derived from the original DNN features used to sample our behavioural judgements.
Comparative analysis
To compare human and DNN representations, we conducted two analyses. First, we performed a pairwise comparison by matching each human dimension with its most correlated DNN dimension. This was done both with and without replacement, allowing us to assess the degree of alignment between human and DNN representational spaces. Second, we performed a cumulative RSA to determine the number of DNN dimensions needed to accurately reflect the patterns in the human similarity matrix. We took the same ranking of DNN dimensions used for the pairwise RSA, starting with the highest correlating dimension. We then progressively added one DNN dimension at a time to a growing subset. After each addition, we reconstructed the RSM from this subset and correlated both the human RSM and the cumulative DNN RSM. This step-by-step process allowed us to observe how the inclusion of each additional DNN dimension contributed to explaining the variance in the human RSM.
Data availability
The images used in this study are obtained from the THINGS object concept and image database39, available via the OSF repository at https://osf.io/jum2f. All the result files pertaining to this study are made publicly available via a separate OSF repository at https://osf.io/nva43/.
Code availability
A Python implementation of all the experiments presented in this paper is publicly available via GitHub at https://github.com/florianmahner/object-dimensions/ and via Zenodo at https://doi.org/10.5281/zenodo.14731440 (ref. 75).
References
Krizhevsky, A., Sutskever, I. & Hinton, G. E. ImageNet classification with deep convolutional neural networks. Adv. Neural Inf. Process. Syst. 25, 1106–1114 (2012).
He, K., Zhang, X., Ren, S. & Sun, J. Deep residual learning for image recognition. In Proc. IEEE Conference on Computer Vision and Pattern Recognition 770–778 (IEEE, 2016).
Hinton, G. et al. Deep neural networks for acoustic modeling in speech recognition: the shared views of four research groups. IEEE Signal Process. Mag. 29, 82–97 (2012).
Amodei, D. et al. Deep Speech 2: end-to-end speech recognition in English and Mandarin. Proc. Mach. Learn. Res. 48, 173–182 (2016).
Silver, D. et al. Mastering the game of Go with deep neural networks and tree search. Nature 529, 484–489 (2016).
Vinyals, O. et al. Grandmaster level in StarCraft II using multi-agent reinforcement learning. Nature 575, 350–354 (2019).
Khaligh-Razavi, S.-M. & Kriegeskorte, N. Deep supervised, but not unsupervised, models may explain it cortical representation. PLoS Comput. Biol. 10, e1003915 (2014).
Yamins, D. L. K. et al. Performance-optimized hierarchical models predict neural responses in higher visual cortex. Proc. Natl Acad. Sci. USA 111, 8619–8624 (2014).
Güçlü, U. & van Gerven, M. A. J. Deep neural networks reveal a gradient in the complexity of neural representations across the ventral stream. J. Neurosci. 35, 10005–10014 (2015).
Rajalingham, R., Schmidt, K. & DiCarlo, J. J. Comparison of object recognition behavior in human and monkey. J. Neurosci. 35, 12127–12136 (2015).
Kubilius, J., Bracci, S. & Op de Beeck, H. P. Deep neural networks as a computational model for human shape sensitivity. PLoS Comput. Biol. 12, e1004896 (2016).
Cichy, R. M. & Kaiser, D. Deep neural networks as scientific models. Trends Cogn. Sci. 23, 305–317 (2019).
Lindsay, G. W. Convolutional neural networks as a model of the visual system: past, present, and future. J. Cogn. Neurosci. 33, 2017–2031 (2021).
Kanwisher, N., Khosla, M. & Dobs, K. Using artificial neural networks to ask ‘why’ questions of minds and brains. Trends Neurosci. 46, 240–254 (2023).
Doerig, A. et al. The neuroconnectionist research programme. Nat. Rev. Neurosci. 24, 431–450 (2023).
Rajalingham, R. et al. Large-scale, high-resolution comparison of the core visual object recognition behavior of humans, monkeys, and state-of-the-art deep artificial neural networks. J. Neurosci. 38, 7255–7269 (2018).
Geirhos, R. et al. Generalisation in humans and deep neural networks. Adv. Neural Inf. Process. Syst. 31, 7549–7561 (2018).
Rosenfeld, A., Zemel, R. & Tsotsos, J. K. The elephant in the room. Preprint at https://arxiv.org/abs/1808.03305 (2018).
Beery, S., Van Horn, G. & Perona, P. Recognition in terra incognita. In Proc. European Conference on Computer Vision 456–473 (Springer, 2018).
Szegedy, C. et al. Intriguing properties of neural networks. Preprint at https://arxiv.org/abs/1312.6199 (2013).
Kriegeskorte, N., Mur, M. & Bandettini, P. A. Representational similarity analysis-connecting the branches of systems neuroscience. Front. Syst. Neurosci. 2, 4 (2008).
Attarian, M., Roads, B. D. & Mozer, M. C. Transforming neural network visual representations to predict human judgments of similarity. Preprint at https://arxiv.org/abs/2010.06512 (2020).
Roads, B. D. & Love, B. C. Learning as the unsupervised alignment of conceptual systems. Nat. Mach. Intell. 2, 76–82 (2020).
Peterson, J. C., Abbott, J. T. & Griffiths, T. L. Evaluating (and improving) the correspondence between deep neural networks and human representations. Cogn. Sci. 42, 2648–2669 (2018).
Muttenthaler, L., Dippel, J., Linhardt, L., Vandermeulen, R. A. & Kornblith, S. Human alignment of neural network representations. In Proc. International Conference on Learning Representions (ICLR, 2023).
Conwell, C., Prince, J. S., Kay, K. N., Alvarez, G. A. & Konkle, T. A large-scale examination of inductive biases shaping high-level visual representation in brains and machines. Nat. Commun. 15, 9383 (2024).
Schrimpf, M. et al. Brain-Score: which artificial neural network for object recognition is most brain-like? Preprint at BioRxiv https://doi.org/10.1101/407007 (2018).
Muttenthaler, L. et al. Improving neural network representations using human similarity judgments. Adv. Neural Inf. Process. Syst. 36, 50978–51007 (2023).
Wang, A. Y., Kay, K., Naselaris, T., Tarr, M. J. & Wehbe, L. Better models of human high-level visual cortex emerge from natural language supervision with a large and diverse dataset. Nat. Mach. Intell. 5, 1415–1426 (2023).
Storrs, K. R., Kietzmann, T. C., Walther, A., Mehrer, J. & Kriegeskorte, N. Diverse deep neural networks all predict human inferior temporal cortex well, after training and fitting. J. Cogn. Neurosci. 33, 2044–2064 (2021).
Erhan, D., Bengio, Y., Courville, A. & Vincent, P. Visualizing Higher-Layer Features of a Deep Network Report No. 1341 (Univ. of Montreal, 2009).
Zeiler, M. D. & Fergus, R. Visualizing and understanding convolutional networks. In Proc. European Conference on Computer Vision 818–833 (Springer, 2014).
Zhou, B., Sun, Y., Bau, D. & Torralba, A. Revisiting the importance of individual units in CNNs via ablation. Preprint at https://arxiv.org/abs/1806.02891 (2018).
Morcos, A. S., Barrett, David G. T., Rabinowitz, N. C. & Botvinick, M. On the importance of single directions for generalization. Preprint at https://arxiv.org/abs/1803.06959 (2018).
Bau, D. et al. Understanding the role of individual units in a deep neural network. Proc. Natl Acad. Sci. USA 117, 30071–30078 (2020).
Hebart, M. N., Zheng, C. Y., Pereira, F. & Baker, C. I. Revealing the multidimensional mental representations of natural objects underlying human similarity judgements. Nat. Human Behav. 4, 1173–1185 (2020).
Muttenthaler, L. et al. VICE: variational interpretable concept embeddings. Adv. Neural Inf. Process. Syst. 35, 33661–33675 (2022).
Zheng, C. Y., Pereira, F., Baker, C. I. & Hebart, M. N. Revealing interpretable object representations from human behavior. In Proc. International Conferemce on Learning Representations (ICLR, 2019).
Hebart, M. N. et al. THINGS-data, a multimodal collection of large-scale datasets for investigating object representations in human brain and behavior. eLife 12, e82580 (2023).
Hebart, M. N. et al. THINGS: a database of 1,854 object concepts and more than 26,000 naturalistic object images. PLoS ONE 14, e0223792 (2019).
Simonyan, K. & Zisserman, A. Very deep convolutional networks for large-scale image recognition. In Proc. International Conference on Learning Representations (ICLR, 2015).
Nonaka, S., Majima, K., Aoki, S. C. & Kamitani, Y. Brain hierarchy score: which deep neural networks are hierarchically brain-like? iScience 24, 103013 (2021).
Jozwik, K. M., Kriegeskorte, N., Storrs, K. R. & Mur, M. Deep convolutional neural networks outperform feature-based but not categorical models in explaining object similarity judgments. Front. Psychol. 8, 1726 (2017).
King, M. L., Groen, I. A., Steel, A., Kravitz, D. J. & Baker, C. I. Similarity judgments and cortical visual responses reflect different properties of object and scene categories in naturalistic images. NeuroImage 197, 368–382 (2019).
Kaniuth, P., Mahner, F. P., Perkuhn, J. & Hebart, M. N. A high-throughput approach for the efficient prediction of perceived similarity of natural objects. eLife 14, RP105394 (2025).
Deng, J. et al. ImageNet: a large-scale hierarchical image database. In Proc. IEEE Conference on Computer Vision and Pattern Recognition 248–255 (IEEE, 2009).
Jain, L., Jamieson, K. G. & Nowak, R. D. Finite sample prediction and recovery bounds for ordinal embedding. Adv. Neural Inf. Process. Syst. 29, 2703–2711 (2016).
Hoyer, P. O. Non-negative sparse coding. In Proc. IEEE Workshop on Neural Networks for Signal Processing 557–565 (IEEE, 2002).
Murphy, B., Talukdar, P. & Mitchell, T. Learning effective and interpretable semantic models using non-negative sparse embedding. In Proc. International Conference on Computational Linguistics 1933–1950 (COLING, 2012).
Fyshe, A., Wehbe, L., Talukdar, P., Murphy, B. & Mitchell, T. A compositional and interpretable semantic space. In Proc. Conference of the North American Chapter of the Association for Computational Linguistics: Human Language Technologies 32–41 (ACL, 2015).
Muttenthaler, L. & Hebart, M. N. THINGSvision: a Python toolbox for streamlining the extraction of activations from deep neural networks. Front. Neuroinform. 15, 45 (2021).
Hermann, K., Chen, T. & Kornblith, S. The origins and prevalence of texture bias in convolutional neural networks. Adv. Neural Inf. Process. Syst. 33, 19000–19015 (2020).
Singer, J. J. D., Seeliger, K., Kietzmann, T. C. & Hebart, M. N. From photos to sketches—how humans and deep neural networks process objects across different levels of visual abstraction. J. Vis. 22, 4 (2022).
Geirhos, R. et al. ImageNet-trained CNNs are biased towards texture; increasing shape bias improves accuracy and robustness. In Proc. International Conferene on Learning Representations (ICLR, 2019).
Selvaraju, R. R. et al. Grad-CAM: visual explanations from deep networks via gradient-based localization. In Proc. IEEE International Conferene on Computer Vision 618–626 (IEEE, 2017).
Yosinski, J., Clune, J., Nguyen, A., Fuchs, T. & Lipson, H. Understanding neural networks through deep visualization. Preprint at https://arxiv.org/abs/1506.06579 (2015).
Montavon, G., Samek, W. & Müller, K.-R. Methods for interpreting and understanding deep neural networks. Digit. Signal Process. 73, 1–15 (2018).
Sauer, A., Schwarz, K. & Geiger, A. StyleGAN-XL: scaling StyleGAN to large diverse datasets. In Proc. SIGGRAPH '22 Conference 49, 1–10 (ACM, 2022).
Sucholutsky, I. et al. Getting aligned on representational alignment. Preprint at https://arxiv.org/abs/2310.13018 (2023).
Kornblith, S., Norouzi, M., Lee, H. & Hinton, G. Similarity of neural network representations revisited. Proc. Mach. Learn. Res. 97, 3519–3529 (2019).
Mahendran, A. & Vedaldi, A. Understanding deep image representations by inverting them. In Proc. IEEE Conference on Computer Vision and Pattern Recognition 5188–5196 (IEEE, 2015).
Bau, D., Zhou, B., Khosla, A., Oliva, A. & Torralba, A. Network dissection: quantifying interpretability of deep visual representations. In Proc. IEEE Conference on Computer Vision and Pattern Recognition 3319–3327 (IEEE, 2017).
Nguyen, A., Yosinski, J. & Clune, J. Understanding neural networks via feature visualization: a survey. In Explainable AI: Interpreting, Explaining and Visualizing Deep Learning (eds Samek, W.et al.) 55–76 (Springer, 2019).
Geirhos, R., Zimmermann, R. S., Bilodeau, B. L., Brendel, W. & Kim, B. Don't trust your eyes: on the (un)reliability of feature visualizations. In Proc. International Conference on Machine Learning (ICML, 2024).
Geirhos, R. et al. Shortcut learning in deep neural networks. Nat. Mach. Intell. 2, 665–673 (2020).
Hermann, K. L., Mobahi, H., Fel, T. & Mozer, M. C. On the foundations of shortcut learning. In Proc. International Conference on Learning Representations (ICLR, 2024).
DiCarlo, J. J., Zoccolan, D. & Rust, N. C. How does the brain solve visual object recognition? Neuron 73, 415–434 (2012).
Jagadeesh, A. V. & Gardner, J. L. Texture-like representation of objects in human visual cortex. Proc. Natl Acad. Sci. USA 119, e2115302119 (2022).
Prince, J. S., Alvarez, G. A. & Konkle, T. Contrastive learning explains the emergence and function of visual category-selective regions. Sci. Adv. 10, eadl1776 (2024).
Kanwisher, N. Functional specificity in the human brain: a window into the functional architecture of the mind. Proc. Natl Acad. Sci. USA 107, 11163–11170 (2010).
Mur, M. et al. Human object-similarity judgments reflect and transcend the primate-IT object representation. Front. Psychol. 4, 128 (2013).
Sundaram, S. et al. When does perceptual alignment benefit vision representations? Adv. Neural Inf. Process. Syst. 37, 55314–55341 (2024).
Dwivedi, K. & Roig, G. Representation similarity analysis for efficient task taxonomy and transfer learning. In Proc. IEEE/CVF Conference on Computer Vision and Pattern Recognition 12387–12396 (2019).
Zou, H. & Hastie, T. Regularization and variable selection via the elastic net. J. R. Stat. Soc. B 67, 301–320 (2005).
Mahner, F. P. florianmahner/object-dimensions. Zenodo https://doi.org/10.5281/zenodo.14731440 (2025).
Stoinski, L. M., Perkuhn, J. & Hebart, M. N. THINGSplus: new norms and metadata for the THINGS database of 1854 object concepts and 26,107 natural object images. Behav. Res. 56, 1583–1603 (2024).
Acknowledgements
F.P.M., L.M. and M.N.H. acknowledge support from a Max Planck Research Group grant of the Max Planck Society awarded to M.N.H. M.N.H. acknowledges support from the ERC Starting Grant COREDIM (ERC-StG-2021-101039712) and the Hessian Ministry of Higher Education, Science, Research and Art (LOEWE Start Professorship and Excellence Program ‘The Adaptive Mind’). U.G. acknowledges support from the project Dutch Brain Interface Initiative (DBI2) with project no. 024.005.022 of the research program Gravitation, which is (partly) financed by the Dutch Research Council (NWO). L.M. acknowledges support from the German Federal Ministry of Education and Research (BMBF) for the Berlin Institute for the Foundations of Learning and Data (BIFOLD) (01IS18037A) and for grants BIFOLD22B and BIFOLD23B. This study used the high-performance computing capabilities of the Raven and Cobra Linux clusters at the Max Planck Computing & Data Facility (MPCDF), Garching, Germany (https://www.mpcdf.mpg.de/services/supercomputing/). The funders had no role in the study design, data collection and analysis, decision to publish or preparation of the manuscript. L.M. was a Student Researcher at Google DeepMind while this work was done.
Funding
Open access funding provided by Max Planck Society.
Ethics declarations
Competing interests
The authors declare no competing interests.
Peer review
Peer review information
Nature Machine Intelligence thanks Alex Murphy, and the other, anonymous, reviewer(s) for their contribution to the peer review of this work.
Additional information
Publisher’s note Springer Nature remains neutral with regard to jurisdictional claims in published maps and institutional affiliations.
Supplementary information
Rights and permissions
Open Access This article is licensed under a Creative Commons Attribution 4.0 International License, which permits use, sharing, adaptation, distribution and reproduction in any medium or format, as long as you give appropriate credit to the original author(s) and the source, provide a link to the Creative Commons licence, and indicate if changes were made. The images or other third party material in this article are included in the article’s Creative Commons licence, unless indicated otherwise in a credit line to the material. If material is not included in the article’s Creative Commons licence and your intended use is not permitted by statutory regulation or exceeds the permitted use, you will need to obtain permission directly from the copyright holder. To view a copy of this licence, visit http://creativecommons.org/licenses/by/4.0/.
About this article

Cite this article
Mahner, F.P., Muttenthaler, L., Güçlü, U. et al. Dimensions underlying the representational alignment of deep neural networks with humans. Nat Mach Intell 7, 848–859 (2025). https://doi.org/10.1038/s42256-025-01041-7
Received:
Accepted:
Published:
Issue Date:
DOI: https://doi.org/10.1038/s42256-025-01041-7