

- Research
- Open access
- Published:
Cardiovascular Diabetology volume 24, Article number: 326 (2025) Cite this article
Abstract
Background
Early detection of vulnerable carotid plaques is critical for stroke prevention. This study aimed to develop a machine learning model based on routine blood tests and derived indices to predict plaque vulnerability and assess sex-specific risk patterns across biomarker value ranges.
Methods
We retrospectively included 1701 hospitalized patients from Suzhou Municipal Hospital (2019–2020), selected from an initial cohort of 10,028 individuals. All patients underwent carotid ultrasound, with vulnerable plaques identified using predefined imaging criteria. A total of 30 laboratory variables—including blood count, coagulation, and biochemistry—were extracted, alongside derived indices such as triglyceride-glucose index (TyG), atherogenic index of plasma (AIP), neutrophil-to-lymphocyte ratio (NLR) and others. Features were standardized and selected based on statistical and clinical relevance. Five machine learning models were trained using a 7:3 train-test split and evaluated by cross-validation. Model performance was assessed using AUC, sensitivity, and specificity. The best model was interpreted using SHapley Additive exPlanations (SHAP) analysis. Sex differences were explored using Mann–Whitney U tests and restricted cubic spline (RCS) modeling across value intervals.
Results
The Random Forest model showed the highest predictive performance (AUC = 0.847; 95% CI 0.791–0.895; specificity = 89.4%; sensitivity = 64.2%). SHAP analysis identified gender, age, fibrinogen, NLR, creatinine, fasting blood glucose, uric acid to high-density lipoprotein ratio (UHR), TyG, systemic inflammation response index (SIRI), and lymphocyte count as top predictors. Significant sex-specific differences in SHAP values were observed for key biomarkers, including age, UHR, TyG, SIRI, and others. RCS modeling further revealed distinct sex-related patterns in plaque vulnerability across biomarker value ranges.
Conclusion
A Random Forest model integrating routine blood markers and derived indices accurately predicted vulnerable carotid plaques. The results underscore the importance of sex-specific risk assessment, highlighting differential effects of key biomarkers across genders and value intervals.
Graphical abstract

Background
Ischemic stroke remains a leading cause of disability and mortality worldwide, with a substantial proportion attributed to atherosclerotic disease of the carotid arteries [1, 2]. Among these, vulnerable carotid plaques—characterized by lipid-rich necrotic core, intraplaque haemorrhage, thin fibrous cap and others—are prone to rupture and embolize, triggering cerebrovascular events [3,4,5]. Early and accurate identification of such plaques is therefore essential for timely risk stratification and stroke prevention [1].
While imaging modalities such as high-resolution carotid ultrasound, magnetic resonance imaging (MRI), and Computed Tomography Angiography (CTA) provide structural information on plaque morphology and stability, their clinical application is constrained by high costs, operator dependence, and limited suitability for large-scale screening, especially in asymptomatic populations [6,7,8]. More importantly, these techniques provide only a static snapshot of local anatomy and often fail to capture the underlying systemic biological processes—such as chronic inflammation, metabolic imbalance, and immune dysregulation—that drive plaque destabilization. In contrast, blood-based biomarkers obtained from routine laboratory tests offer a non-invasive, cost-effective, and scalable means to assess these systemic factors. Leveraging hematological and biochemical indices enables earlier and broader identification of individuals at increased risk of plaque vulnerability, surpassing what can be achieved by imaging modalities alone.
Recent research has underscored the value of hematological and biochemical biomarkers derived from routine blood tests as readily accessible indicators of vascular inflammation, immune dysregulation, oxidative stress, and endothelial dysfunction [9,10,11,12,13,14]. Composite indices such as the neutrophil-to-lymphocyte ratio (NLR), platelet-to-lymphocyte ratio (PLR), systemic immune-inflammation index (SII), triglyceride-glucose index (TyG), and atherogenic index of plasma (AIP) have emerged as surrogate markers of atherosclerotic risk [15,16,17,18,19,20]. Previous studies have also identified several biomarkers indicative of excessive inflammation, including sirtuins, microRNAs, ST2 protein, apolipoprotein E, and adiponectin, which play crucial roles in the diagnosis, monitoring, and prognostic evaluation of cardiovascular diseases (CVDs) [21, 22]. Furthermore, the role of epigenetic modifications and microRNAs in the rupture of atherosclerotic plaques and other related complications has been increasingly reported, and their potential value in guiding clinical treatment is gradually gaining recognition [23, 24]. However, most prior studies have evaluated these biomarkers in isolation, without integrating them into holistic predictive frameworks. Meanwhile, the accuracy and specificity of these scoring systems and predictors remain unsatisfactory.
Moreover, sex-based differences in the pathophysiology and clinical expression of atherosclerosis are increasingly recognized [25,26,27,28,29]. Females and males exhibit distinct patterns of immune response, hormonal regulation, and vascular remodeling, all of which may influence the development and destabilization of atherosclerotic plaques [26, 29]. However, few studies have explored whether the predictive value of blood-based biomarkers for plaque instability varies by sex, or how such differences manifest across the entire range of biomarker distributions.
In this context, machine learning (ML) offers powerful tools to uncover complex, nonlinear associations across multiple clinical variables and to build flexible, high-performing models for individualized risk prediction [11, 30]. Compared to traditional statistical approaches, ML algorithms can handle high-dimensional data, accommodate variable interactions, and improve predictive accuracy. Importantly, interpretable ML methods—such as those utilizing SHapley Additive exPlanations (SHAP)—enable detailed understanding of feature contributions at both the global and individual levels, thereby enhancing clinical trust and applicability [30].
While prior research has explored associations between biomarkers and plaque characteristics, many studies lacked model interpretability, failed to stratify by sex, and did not examine biomarker thresholds systematically. Furthermore, few incorporated a diverse set of derived hematological indices or validated models on robust clinical cohorts, limiting their generalizability. Given these gaps, there is a pressing need for robust, interpretable, and clinically applicable machine learning models that integrate routine laboratory data to predict carotid plaque vulnerability. Employing a sex-stratified analytical approach may further clarify sex-specific risk profiles and facilitate the development of more personalized preventive strategies for atherosclerotic stroke.
Method
Study design and population
This retrospective observational study was conducted at Suzhou Municipal Hospital and included adult inpatients admitted between January 2019 and December 2020. From an initial cohort of 10,028 individuals who underwent carotid ultrasound during hospitalization, a total of 1701 patients were included in the final analysis after applying eligibility criteria (Fig. 1 details patient inclusion flow chart).
Participants were required to have ultrasound-confirmed carotid atherosclerotic plaques. The vulnerability of plaques was determined using standardized sonographic criteria, including, intraplaque haemorrhage, lipid-rich necrotic core and thin fibrous cap, intraplaque neovascularisation, irregular morphology of the luminal surface and the presence of ulceration [3, 4]. These imaging features have been widely validated as markers of vulnerable plaques and are associated with increased risk of embolic stroke and other cerebrovascular events. Exclusion criteria included missing or incomplete laboratory data, known systemic inflammatory diseases (e.g., autoimmune disorders), and active malignancies. The final study population consisted of patients with clear carotid plaque classification, categorized as having either vulnerable or stable plaques based on the aforementioned imaging criteria. As a retrospective single-center study, the findings may be subject to selection bias, and the generalizability of results beyond the Suzhou Municipal Hospital population is limited. Ultrasound-based classification may have limitations in sensitivity compared to MRI or CTA, and inter-operator variability could influence plaque characterization.
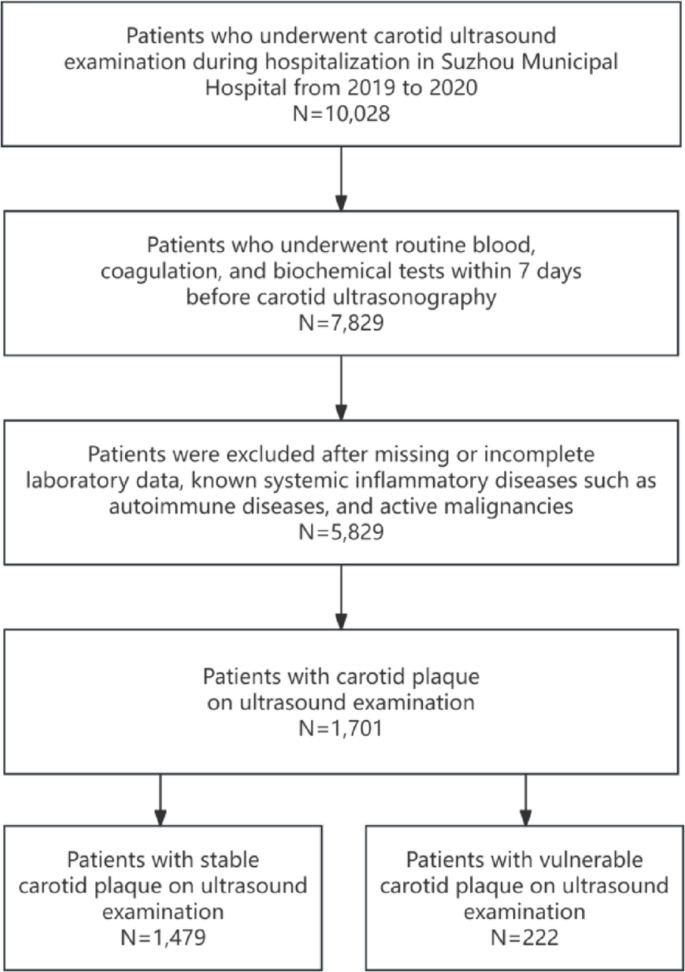
Flowchart of patient inclusion. Flow diagram illustrating the selection process of hospitalized patients undergoing carotid ultrasound at Suzhou Municipal Hospital from 2019 to 2020. After applying exclusion criteria, 1701 patients with carotid plaque were included in the final analysis, comprising 1479 with stable plaque and 222 with vulnerable plaque based on predefined criteria
Data collection and variables
Demographic information, medical history, and laboratory parameters were retrospectively extracted from the electronic medical record system of Suzhou Municipal Hospital. All laboratory tests were performed at admission as part of routine clinical assessment. After excluding variables with missing values, a total of 40 features were retained for analysis, encompassing demographic characteristics, laboratory measurements, and derived indices. These variables comprised gender and age; glycemic and lipid metabolism markers such as Glycosylated Hemoglobin A1c (HbA1c, %), fasting blood glucose (FBG, mg/dL), triglycerides (TG, mg/dL), total cholesterol (TC, mg/dL), low-density lipoprotein (LDL, mg/dL), high-density lipoprotein (HDL, mg/dL), and very-low-density lipoprotein (VLDL, mg/dL); renal and electrolyte parameters including creatinine (Cr, µmol/L), Urea (mmol/L), uric acid (UA, µmol/L), sodium (Na, mmol/L), potassium (K, mmol/L), chloride (Cl, mmol/L), calcium (Ca, mmol/L), magnesium (Mg, mmol/L), and phosphorus (P, mmol/L); liver function indicators such as alanine aminotransferase (ALT, U/L), aspartate aminotransferase (AST, U/L), and alkaline phosphatase (ALP, U/L); hematologic indices including hemoglobin (Hb, g/L), red blood cell count (RB, ×1012/L), platelet count (PLT, ×109/L), and fibrinogen (Fb, g/L); and leukocyte subtypes including neutrophil count (NE, ×109/L), lymphocyte count (LYM, ×109/L), monocyte count (MO, ×109/L), eosinophil count (EO, ×109/L), and basophil count (BA, ×109/L). In addition, ten derived indicators were calculated to reflect systemic inflammation and metabolic dysregulation, including: triglyceride-glucose index (TyG = ln [TG × FBG / 2]), atherogenic index of plasma (AIP = log10 [TG / HDL]), the stress hyperglycemia ratio (SHR) was calculated as FBG (mg/dL) / [28.7 × HbA1c (%)– 46.7], neutrophil-to-lymphocyte ratio (NLR = NE / LYM), platelet-to-lymphocyte ratio (PLR = PLT / LYM), monocyte-to-lymphocyte ratio (MLR = MO / LYM), systemic immune-inflammation index (SII = PLT × NE / LYM), systemic inflammation response index (SIRI = NE × MO / LYM), aggregate index of systemic inflammation (AISI = NE × MO × PLT / LYM), and uric acid to HDL ratio (UHR = UA / HDL). All laboratory values were obtained from fasting blood samples collected within 7 days before carotid ultrasound examination. Missing demographic or lifestyle factors such as smoking or physical activity could not be adjusted for due to data unavailability, potentially confounding biomarker associations.
Feature classification and selection
To facilitate effective model development, all candidate variables were subjected to systematic preprocessing and feature selection through a comprehensive, multi-stage pipeline. Continuous variables were standardized using the StandardScaler function from the scikit-learn library, which transforms each variable by subtracting the mean and dividing by the standard deviation, resulting in a standardized variable with a mean of 0 and a standard deviation of 1. This ensures comparability across different scales and allows all features to contribute equally to the model. The categorical variable “Gender” was encoded via label encoding.
To classify candidate features as linear or nonlinear, a model-driven strategy was applied. Each variable was independently assessed using univariate logistic regression (linear) and XGBoost (nonlinear), with the area under the ROC curve (AUC) used to evaluate discriminative performance. Features with higher AUCs under logistic regression were labeled linear, while those performing better with XGBoost were considered nonlinear. Variables with similar or poor performance across both models were excluded. This empirical, performance-based approach enabled data-adaptive feature categorization, improving model interpretability and downstream selection efficiency. For linear features, four selection criteria were applied: Variance thresholding: variables with variance ≤ 0.01 were removed. Univariate Spearman correlation: variables with absolute correlation among the top 10 were retained (empirically,|ρ| ≳ 0.1). F-test (ANOVA) via SelectKBest: the 10 most significantly associated variables (by P-value) were selected. Lasso regression (LassoCV, five-fold cross-validation): features with non-zero coefficients were retained. Features selected by at least one of the above methods were retained. Age and HbA1c, for example, were consistently selected by multiple strategies. For nonlinear features, four complementary methods were used: Mutual information (MI): top 10 features by MI score were selected. XGBoost feature importance: variables with importance values in the top quartile were retained. Recursive feature elimination (RFE): top 10 features were selected using logistic regression as the base estimator. Sequential forward selection (SFS): another top 10 features were selected using forward inclusion strategy. To mitigate the limitations of any single method and reduce the risk of excluding relevant features, a union-based strategy was applied within each feature category. The final nonlinear set comprised 23 variables, encompassing a broad range of metabolic, hematologic, and inflammation-related markers.
Finally, all retained linear (n = 2), nonlinear (n = 23), and categorical (n = 1) features were merged and deduplicated, resulting in a final feature set of 26 variables used for model construction. These included: Gender, Age, LDL, Urea, ALT, SII, Fb, UA, FBG, AIP, NE, BA, UHR, HbA1c, PLR, EO, AST, LYM, Cr, TyG, RB, TC, NLR, SIRI, AISI, and MO.
Machine learning model development and evaluation
Five supervised machine learning algorithms—Random Forest (RF), Logistic Regression (LR), Support Vector Machine (SVM), K-Nearest Neighbors (KNN), and AdaBoost—were developed to predict the presence of vulnerable carotid plaques based on 26 selected features. The dataset was randomly divided into training and test sets using a 7:3 split. All models were implemented in Python using the scikit-learn package. Performance evaluation was conducted through 5-fold cross-validation on the training set and further validated on the test set. Key evaluation metrics included AUC, sensitivity, specificity, accuracy, precision, and F1 score. The AUC was bootstrapped using 1000 iterations to estimate 95% confidence intervals.
SHAP-based model interpretation and sex-stratified risk analysis
To elucidate the internal mechanisms of the best-performing model (Random Forest), SHapley Additive exPlanations (SHAP) were employed to quantify the marginal contribution of each input variable to the predicted probability of vulnerable carotid plaque. Global feature importance was illustrated using the mean absolute SHAP values across the test set. To further investigate the directionality and distribution of feature effects, beeswarm plots and decision plots were generated. SHAP dependence plots were utilized to examine potential non-linear patterns, such as threshold effects or saturation across the range of continuous variables. To identify key points where feature contributions changed markedly, we applied locally weighted scatterplot smoothing (LOWESS) to the SHAP dependence curves. For each feature and gender subgroup, we extracted (1) zero-crossing points, where the SHAP value curve crossed zero—indicating a shift in predicted risk direction—and (2) inflection points, defined as local maxima in the absolute first derivative (|d(SHAP)/dx|), representing the most rapid changes in model attribution. Up to three key points per feature were retained to highlight biologically or clinically meaningful thresholds.
Given the prominent ranking of gender, further stratified analyses were performed. SHAP dependence plots were color-coded by gender to visualize potential divergence in biomarker-associated risk trajectories. To present these non-linear associations in a clinically intuitive manner, restricted cubic spline (RCS) logistic models were fitted using a cubic basis with five internal knots. Knot locations were derived from the female subgroup and uniformly applied to both genders to ensure consistency and comparability. Sex-specific predicted probabilities were plotted across biomarker ranges with bootstrap-based confidence intervals, and group-wise comparisons were visualized using combined line and bar plots.
Statistical analysis
Summary statistics were presented as total frequencies and percentages for categorical variables, and as medians with interquartile ranges (IQR) or means with standard deviations (SD) for continuous variables, as appropriate. Group differences were assessed using the χ² test for categorical variables and the Mann–Whitney U test or Student’s t-test for continuous variables, depending on data distribution. All tests were two-sided, and a P-value < 0.05 was considered statistically significant. Where applicable, multiple testing correction was conducted using the Benjamini–Hochberg procedure to control the false discovery rate (FDR), with significance defined as adjusted P < 0.05. Spearman’s correlation was used to assess inter-feature associations, with correlation heatmaps stratified by plaque type (stable vs. vulnerable) and gender. FDR-adjusted P-values were used to determine statistical significance for all pairwise correlations. For SHAP-based analyses, differences in SHAP value distributions between male and female participants were assessed using the Mann–Whitney U test. For modeling risk trajectories, RCS logistic regression was employed using five internal knots. Knot positions were derived from the female subgroup and identically applied to male models to ensure comparability. RCS models were fitted separately for males and females. 95% confidence intervals were generated using 1000 bootstrap resamples per group. Predicted probabilities were binned according to spline-derived intervals, and gender-based comparisons within each bin were conducted using independent-samples t-tests. Only features showing statistically significant differences (P < 0.05) in at least one bin were retained for final RCS visualization. All statistical analyses and visualizations were performed using Python (v3.12). Asterisks denote statistical significance: P < 0.05 (*), P < 0.01 (**), P < 0.001 (***).
Results
Patient characteristics
The clinical characteristics of the study population are summarized in Table 1. A total of 1701 hospitalized patients were included in the analysis, of whom 222 (13.1%) were classified as having vulnerable carotid plaques, while 1479 (86.9%) had stable plaques. Compared with the stable group, individuals with vulnerable plaques were significantly older (median age: 73 vs. 68 years, P < 0.001) and more likely to be male (74.8% vs. 47.7%, P < 0.001). The vulnerable plaque group exhibited significantly elevated levels of metabolic and inflammatory biomarkers. In particular, FBG (106.38 vs. 95.94 mg/dL, P < 0.001), Cr (72.8 vs. 62.3 µmol/L, P < 0.001), TyG index (8.61 vs. 8.56, P = 0.021), and AIP (0.01 vs. 0.05, P = 0.009) were all significantly higher in the vulnerable group. These findings indicate an atherogenic metabolic profile associated with plaque instability. Moreover, inflammation-related markers, including NLR (2.46 vs. 2.06, P < 0.001) and Fb (2.99 vs. 2.66 g/L, P < 0.001), were also significantly elevated in patients with vulnerable plaques. In contrast, LYM counts was lower in this group. These results underscore the distinct metabolic and immunologic abnormalities present in patients with vulnerable carotid plaques, which may contribute to their increased risk of cerebrovascular events.
The cohort was randomly divided into a train set (n = 1190) and a test set (n = 511). Baseline characteristics were largely comparable between the two sets. The proportion of females was nearly identical (48.7% vs. 48.9%, P = 0.961), and no significant differences were observed in median age (both 69 years, P = 0.386), RB count (4.26 vs. 4.24 × 10¹²/L, P = 0.585), or LYM count (1.63 vs. 1.67 × 10⁹/L, P = 0.970). Other vast majority of key metabolic and inflammatory markers, such as FBG, Cr, TyG index, and NLR, were also balanced between the train and test cohorts (P > 0.05), supporting the validity of subsequent model development and evaluation. The clinical characteristics of the study populations for the training and test sets are shown in Supplementary Table S1.
Spearman correlation analysis
To examine inter-feature relationships, Spearman correlation coefficients were calculated among selected continuous variables. Heatmaps were generated for the entire cohort and further stratified by plaque phenotype (stable vs. vulnerable) (Fig. 2 and Supplemental Table S2-3). In the overall population (n = 1701), strong positive correlations were observed among several metabolic and inflammatory biomarkers. TC was highly correlated with LDL (ρ = 0.927, P < 0.001). Inflammation-related indices showed tight interdependence: SII was strongly associated with NLR (ρ = 0.856, P < 0.001) and SIRI (ρ = 0.765, P < 0.001). TyG index was positively correlated with AIP index (ρ = 0.850, P < 0.001), and UA with UHR (ρ = 0.763, P < 0.001). Negative correlations were also evident: LYM count was inversely related to Fb (ρ = − 0.144, P < 0.001) and NLR (ρ = − 0.651, P < 0.001), while UHR was negatively associated with TC (ρ = − 0.222, P < 0.001). In patients with vulnerable plaques (n = 222), the inflammatory-metabolic axis appeared more tightly coupled. SII correlated strongly with NLR (ρ = 0.877, P < 0.001), AISI (ρ = 0.851, P < 0.001), and SIRI (ρ = 0.772, P < 0.001). TyG index was closely associated with both AIP (ρ = 0.790, P < 0.001) and FBG (ρ = 0.617, P < 0.001). UA and UHR also showed a strong positive correlation (ρ = 0.601, P < 0.001). Negative associations persisted between LYM count and Fb (ρ = − 0.200, P < 0.01), and between UHR and TC (ρ = − 0.330, P < 0.001). In the stable plaque group (n = 1479), correlation magnitudes were generally attenuated. TC and LDL remained strongly correlated (ρ = 0.927, P < 0.001), and TyG index retained associations with AIP (ρ = 0.858, P < 0.001) and FBG (ρ = 0.480, P < 0.001). Inflammatory indices demonstrated modestly reduced interrelationships, including SII–NLR (ρ = 0.825, P < 0.001) and SII–SIRI (ρ = 0.761, P < 0.001). Negative correlations between LYM–Fb (ρ = − 0.127, P < 0.001), and UHR–TC (ρ = − 0.201, P < 0.001) remained significant, albeit weaker than in the vulnerable group. These findings suggest a more pronounced inflammatory-metabolic clustering in patients with vulnerable plaques, potentially contributing to plaque destabilization.

Spearman correlation heatmaps across plaque subgroups. Spearman correlation matrices were generated using the final 26 selected features across: A the entire study population (n = 1701); B patients with stable carotid plaques (n = 1479); C patients with vulnerable carotid plaques (n = 222). The strength and direction of pairwise correlations are reflected by the custom “navy-pink” colormap, with navy indicating negative correlations and pink indicating positive correlations. Vulnerable plaque cases exhibited stronger and more clustered inter-variable relationships, particularly among inflammatory and metabolic markers. Fasting blood glucose (FBG), glycosylated hemoglobin A1c (HbA1c), creatinine (Cr), alanine aminotransferase (ALT), aspartate aminotransferase (AST), uric acid (UA), uric acid to HDL ratio (UHR ), triglyceride-glucose index (TyG), atherogenic index of plasma (AIP), total cholesterol (TC), low-density lipoprotein (LDL), fibrinogen (Fb), eosinophil count (EO), basophil count (BA), lymphocyte count (LYM), red blood cell count (RB), neutrophil count (NE), monocyte count (MO), systemic immune-inflammation index (SII), neutrophil-to-lymphocyte ratio (NLR), systemic inflammation response index (SIRI), aggregate index of systemic inflammation (AISI), platelet-to-lymphocyte ratio (PLR)
Model performance
Five machine learning models were trained using a 7:3 train-test split and evaluated using 5-fold cross-validation. Performance metrics included AUC (with 1,000 bootstrap iterations), F1 score, accuracy, sensitivity, specificity, precision, and sklearn AUC (Table 2). The RF model achieved the best performance: Training AUC: 0.965 (95% CI 0.953–0.977); Sensitivity: 85.8%; Specificity: 90.9%; Accuracy: 90.3%; F1 Score: 0.696. Test set AUC: 0.847 (95% CI 0.791–0.895); Sensitivity: 64.2%; Specificity: 89.4%; Accuracy: 86.1%; F1 Score: 0.548. The RF model maintained consistent performance in both training and test sets, suggesting excellent generalizability without substantial overfitting. Logistic Regression showed moderate performance (Test AUC: 0.775; F1 score: 0.367) with relatively balanced sensitivity (68.7%) and specificity (68.9%), but limited precision (25.0%). AdaBoost achieved a test AUC of 0.804, with very high specificity (98.2%) but poor sensitivity (14.9%), making it less suitable for screening purposes. KNN and SVM models had low sensitivity (< 20%) despite high specificity, indicating poor recall of positive cases. The RF model provided the most favorable trade-off between sensitivity and specificity and outperformed other models across all major metrics (Fig. 3). Its strong discrimination and robustness suggest practical value for identifying patients at high risk of vulnerable plaque using routine blood test data. Although the RF model showed robust performance, sensitivity remained modest (64.2%), indicating that some vulnerable plaques may still go undetected.

Receiver operating characteristic (ROC) curves of five machine learning models in the training and test sets. A ROC curves in the training set; B ROC curves in the test set. Random Forest, Logistic Regression, Support Vector Machine (SVM), K-Nearest Neighbors (KNN), and AdaBoost classifiers were evaluated. Shaded areas indicate 95% confidence intervals of the AUC estimated using 1000 bootstrap iterations
SHAP-based model interpretation and key feature analysis
To enhance the interpretability of the best-performing Random Forest model, SHAP analysis was conducted to quantify the relative contribution of each predictor to the model’s output. The mean absolute SHAP values identified the top 20 most influential features (Fig. 4). Gender (0.048), Age (0.048), Fb (0.043), NLR (0.025), and Cr (0.024) emerged as the most impactful variables. Notably, several derived indices—including the TyG index, UHR, SIRI, AIP, and PLR—also ranked prominently, underscoring the added prognostic value of integrated inflammatory and metabolic markers in the prediction of vulnerable carotid plaques. The interpretability provided by SHAP is limited to model-specific behavior and does not infer causal relationships. SHAP values depend on the underlying data distribution and model structure.
The SHAP beeswarm plot (Fig. 5A) illustrates the magnitude and direction of feature contributions across individual predictions. The increase in Age and the elevated levels of Fb, FBG, and Cr were consistently associated with higher SHAP values, suggesting an increased predictive probability for vulnerable carotid plaques. Conversely, higher lymphocyte and RB counts were associated with negative SHAP values, suggesting a potential protective effect. Notably, gender emerged as a dominant contributor, with consistently high SHAP values across the population. SHAP decision plots (Fig. 5B) further revealed consistent feature contribution trajectories across patients, with age, gender, and inflammation-related markers—particularly NLR and SIRI—frequently occupying leading roles in the risk prediction pathway. These findings underscore the pivotal role of gender in modulating biomarker influence and reinforce the clinical relevance of explainable machine learning for individualized vascular risk stratification.

Global feature importance based on SHAP values in the Random Forest model. Bar plot showing the top 20 most important features ranked by mean absolute SHAP values derived from the Random Forest model. Fasting blood glucose (FBG), glycosylated hemoglobin A1c (HbA1c), creatinine (Cr), uric acid (UA), uric acid to HDL ratio (UHR ), triglyceride-glucose index (TyG), atherogenic index of plasma (AIP), total cholesterol (TC), low-density lipoprotein (LDL), fibrinogen (Fb), lymphocyte count (LYM), red blood cell count (RB), monocyte count (MO), systemic immune-inflammation index (SII), systemic inflammation response index (SIRI), platelet-to-lymphocyte ratio (PLR), neutrophil-to-lymphocyte ratio (NLR)

SHAP-based model interpretation visualizations for the Random Forest classifier. A SHAP summary plot showing the distribution of SHAP values for the top 20 features ranked by mean absolute importance. Each dot represents an individual observation in the test set, with color indicating the original feature value (red = high, blue = low). The x-axis reflects the SHAP value, representing the feature’s impact on model output. B SHAP decision plot illustrating the cumulative contribution of features to the model’s predicted probability for each patient. Lines represent individual patients, with colors denoting the model output (left = low risk, right = high risk). The visualization highlights how different combinations of feature values lead to diverse predictions across individuals. Fasting blood glucose (FBG), glycosylated hemoglobin A1c (HbA1c), creatinine (Cr), uric acid (UA), uric acid to HDL ratio (UHR ), triglyceride-glucose index (TyG), atherogenic index of plasma (AIP), total cholesterol (TC), low-density lipoprotein (LDL), fibrinogen (Fb), lymphocyte count (LYM), red blood cell count (RB), monocyte count (MO), systemic immune-inflammation index (SII), systemic inflammation response index (SIRI), platelet-to-lymphocyte ratio (PLR), neutrophil-to-lymphocyte ratio (NLR)
To investigate the marginal contribution patterns of top-ranking continuous biomarkers, SHAP dependence plots were generated using test-set-derived SHAP values (Fig. 6A–O). These plots revealed prominent non-linear associations between feature values and predicted risk of vulnerable carotid plaque, with identifiable risk thresholds for several key biomarkers. Notably, Age, TyG, FBG, HbA1c, UHR, and SII demonstrated particularly pronounced non-linear patterns. For instance, Age showed a SHAP = 0 threshold at 64.93 years, with the steepest gradient occurring between 66.0 and 70.0 years, indicating a sharp increase in predicted risk in late midlife. LDL displayed two SHAP = 0 crossings (69.11 and 133.90 mg/dL) and three inflection points (137.67, 144.24, and 228.54 mg/dL), suggesting a U-shaped relationship with vulnerability risk. Metabolic markers such as TyG exhibited three SHAP = 0 transitions (8.24, 8.56, 8.94), with peak local effects concentrated around 9.07–9.19. FBG showed inflections at 108.72, 135.36, and 188.46 mg/dL, with a SHAP = 0 point at 104.61 mg/dL, aligning closely with clinical glycemic thresholds. Similarly, HbA1c switched from protective to harmful around 6.36%. Glyco-inflammatory indices also showed distinct localized contributions. SIRI presented strong effects across inflection points between 0.589 and 0.685, with peak SHAP gradients > 0.12. AIP exhibited sharp inflections at − 0.33, − 0.16, and − 0.11, with maximal slope at − 0.16, suggesting early risk elevation even in borderline ranges. Among inflammatory markers, PLR showed steep changes across 71.1, 73.6, and 144.97, flanked by SHAP = 0 crossings at 57.6 and 131.8. SII, despite having lower overall SHAP magnitude, showed narrow but consistent risk transitions between 367.9 and 392.9. UHR inflected between 9.29 and 10.40. Renal and oxidative stress markers also demonstrated complex, threshold-based behavior. Urea displayed inflections at 4.61, 6.57, and 7.82 mmol/L; Creatinine at 53.3, 87.1, and 100.0 µmol/L; and Uric acid around 5.04–5.08 mg/dL. These values correspond to key transitions where predictive contributions of these markers increased sharply. Collectively, these results confirm that many routine blood biomarkers influence plaque vulnerability in a non-linear and threshold-dependent manner. The top three SHAP = 0 and inflection points for each feature are summarized in Supplementary Table S4.

A–O SHAP dependence plots of top-ranked continuous features in the overall cohort. Each panel depicts the relationship between raw feature values (x-axis) and their corresponding SHAP values (y-axis), reflecting the marginal contribution of each variable to the predicted probability of vulnerable carotid plaque. Color gradients indicate the relative magnitude of feature values across observations. Fasting blood glucose (FBG), glycosylated hemoglobin A1c (HbA1c), creatinine (Cr), uric acid to HDL ratio (UHR ), triglyceride-glucose index (TyG), atherogenic index of plasma (AIP), low-density lipoprotein (LDL), fibrinogen (Fb), lymphocyte count (LYM), systemic immune-inflammation index (SII), systemic inflammation response index (SIRI), platelet-to-lymphocyte ratio (PLR), neutrophil-to-lymphocyte ratio (NLR)
Sex-specific risk interpretation and biomarker dynamics
Sex-specific correlation structures among key predictors
To further explore sex-related differences in biomarker interdependencies, Spearman correlation analysis was performed separately in male and female participants using high SHAP-ranked predictors (Fig. 7 ). A total of 118 significant pairwise correlations were identified in males, compared to 107 in females. Among these, 90 correlation pairs were shared between genders, while 28 and 17 pairs were unique to males and females, respectively, highlighting both convergences and divergences in underlying biological networks. In both genders, strong positive correlations were commonly observed between metabolic and inflammatory markers, including TyG–UHR, NLR–SII, and MO–Urea. However, notable sex-specific patterns were also present. In males, unique correlations included SII–Age, Cr–NLR, RB–Fb, RB–UHR, and Cr–HbA1c, suggesting tight coupling between inflammation, renal function, and hematological status. In contrast, female-specific correlations such as HbA1c–SIRI, MO–Cr, Age–HbA1c, MO–TC, and LDL–Cr implied stronger links between glycemic, lipid, and immune-metabolic pathways. These sex-specific structures indicate that the pathophysiological interactions among key biomarkers differ between males and females, which may contribute to the observed heterogeneity in SHAP values and plaque vulnerability risk patterns.

Sex-specific correlation heatmaps of top predictive features. A Spearman correlation heatmap of in female participants. B Spearman correlation heatmap in male participants. Fasting blood glucose (FBG), glycosylated hemoglobin A1c (HbA1c), creatinine (Cr), uric acid (UA), uric acid to HDL ratio (UHR ), triglyceride-glucose index (TyG), atherogenic index of plasma (AIP), total cholesterol (TC), low-density lipoprotein (LDL), fibrinogen (Fb), lymphocyte count (LYM), red blood cell count (RB), monocyte count (MO), systemic immune-inflammation index (SII), systemic inflammation response index (SIRI), platelet-to-lymphocyte ratio (PLR), neutrophil-to-lymphocyte ratio (NLR)
Sex differences in SHAP-based feature contributions
To investigate sex-related differences in feature contributions, SHAP values were compared between male and female participants for the top-ranked predictors, excluding gender itself. Figure 8 presents scatter plots of SHAP distributions for features with statistically significant differences between sexes (P < 0.05, Mann–Whitney U test). Cr, FBG, UHR, TyG index, SIRI, and HbA1c displayed significantly higher SHAP values in males. Age, LYM count, and RB count showed significantly higher SHAP values in females. Other high-ranking features, including NLR and Fb, did not show significant sex differences in SHAP distributions (P ≥ 0.05), and were not included in the figure.
To explore whether the contribution patterns of key features differed by gender, SHAP dependence plots were generated and color-coded accordingly (Fig. 9). A total of 26 features demonstrated measurable inflection behavior in males, and 24 in females. While several features showed overlapping SHAP = 0 ranges between genders, substantial differences were observed in the number of inflection points, their locations, and the magnitude of SHAP gradient peaks. Age showed SHAP = 0 at 63.0 years in males and 66.0 in females. Top SHAP gradients were identified at 66.0 and 70.0 years in males, and 59.0, 64.0, and 68.0 years in females. LDL had two SHAP = 0 points in both genders (males: 70.38, 136.12 mg/dL; females: 67.29, 129.93 mg/dL). Females showed top derivative values at 100.16, 93.97, and 62.26 mg/dL; males at 85.85, 90.49, and 71.54 mg/dL. TyG exhibited three SHAP = 0 points in males (8.19, 8.73, 8.87) and one in females (8.96). Both genders had similar top gradient zones between 7.88 and 9.00. FBG had SHAP = 0 at approximately 104.22 mg/dL in males and 104.58 mg/dL in females. The sharpest transitions occurred at 88.38–99.0 mg/dL in males and 84.78–101.16 mg/dL in females. HbA1c crossed SHAP = 0 at 6.3% in both genders. Gradient peaks were observed at 6.1 and 6.3 in males, and 5.3–6.1 in females. SII presented a single SHAP = 0 point in males (528.05) and two in females (163.93, 589.33). The maximum SHAP slope reached 8033.27 in females versus 3359.88 in males. PLR showed two SHAP = 0 values in both genders. Peak derivative values in females reached 684.85, compared to 494.83 in males. Several other features (e.g., Urea, UHR, Cr, ALT, NE, NLR, AIP, TC) exhibited similar trends, with differences primarily in the number of inflection points and the value intervals where slope peaks occurred. The SHAP = 0 points and Top SHAP gradients for each feature are summarized in Supplementary Table S5.

A–L Sex-specific SHAP value distributions of key predictors. Scatter plots compare SHAP values between female and male participants. Only features with statistically significant sex-based differences (P < 0.05, Mann–Whitney U test) were included. Fasting blood glucose (FBG), glycosylated hemoglobin A1c (HbA1c), creatinine (Cr), uric acid (UA), uric acid to HDL ratio (UHR ), triglyceride-glucose index (TyG), atherogenic index of plasma (AIP), total cholesterol (TC), low-density lipoprotein (LDL), fibrinogen (Fb), lymphocyte count (LYM), red blood cell count (RB), monocyte count (MO), systemic immune-inflammation index (SII), systemic inflammation response index (SIRI), platelet-to-lymphocyte ratio (PLR), neutrophil-to-lymphocyte ratio (NLR)

A–O SHAP dependence plots of the top 15 features, stratified by gender. Each subplot illustrates the relationship between the raw feature value (x-axis) and the corresponding SHAP value (y-axis), reflecting the marginal contribution of the feature to the model’s predicted probability of vulnerable carotid plaque. Data points are color-coded by gender (red = male, blue = female), allowing visualization of sex-specific effect patterns. Fasting blood glucose (FBG), glycosylated hemoglobin A1c (HbA1c), creatinine (Cr), uric acid to HDL ratio (UHR ), triglyceride-glucose index (TyG), atherogenic index of plasma (AIP), low-density lipoprotein (LDL), fibrinogen (Fb), lymphocyte count (LYM), systemic immune-inflammation index (SII), systemic inflammation response index (SIRI), platelet-to-lymphocyte ratio (PLR), neutrophil-to-lymphocyte ratio (NLR)
RCS modeling reveals sex-related risk inflection patterns
To further explore sex-related non-linear risk patterns, RCS models were constructed for the high SHAP-ranked biomarkers, stratified by gender. Each variable was plotted against the predicted probability of vulnerable plaque, and group-wise comparisons were conducted across clinically relevant intervals (Fig. 10). Significant differences in risk trajectories were identified across several markers. For Age (Fig. 10A), predicted risk increased steadily with age in both sexes, but men exhibited significantly higher probabilities between 57.8 and 78.9 years (P = 0.008), suggesting earlier and steeper risk escalation. Fb (Fig. 10B) demonstrated a sharper rise in females across the 4.48–6.51 g/L range (P = 0.029), while no significant differences were observed in other intervals. NLR (Fig. 10C) showed a strong sex effect in the lowest quartile (1.42–2.78), where females had markedly higher predicted risk than males (P < 0.001). For Cr (Fig. 10D), males had significantly higher predicted probabilities in the 57.5–93.6 µmol/L range (P < 0.001), aligning with early renal dysfunction profiles. FBG (Fig. 10E) and UHR (Fig. 10F) showed sex-specific differences in the highest tertile (FBG: 214.7–inf, P = 0.009; UHR: 39.0–inf, P = 0.011), indicating more prominent glycemic and stress-related effects in females. TyG (Fig. 10G) and SIRI (Fig. 10H) curves also diverged in upper ranges (TyG > 10.4, P = 0.003), highlighting heightened metabolic-inflammation coupling in females. For AIP (Fig. 10I), males showed greater risk in the 0.1–0.8 interval (P < 0.001), while females had higher predicted risk for Urea between 5.67 and 31.84 mmol/L (P = 0.004) and for LDL between 98.46 and 170.34 mg/dL (P = 0.009). Sex differences were also found in MO and RB trajectories, where males had higher risk at lower MO levels (0.41–0.77, P = 0.012) and females had increased risk at mid-range RB values (3.66–4.36, P < 0.001).

A–O Sex-stratified RCS modeling of predicted probabilities across biomarker value intervals. RCS curves (upper panels) visualize the predicted probability of vulnerable plaque stratified by gender, with shaded areas representing 95% confidence intervals. Bar plots (lower panels) compare average predicted probabilities between male and female patients across binned biomarker intervals. Only biomarkers or features with at least one significant gender-based difference are included. P-values are derived from independent two-sample t-tests; asterisks denote significance levels (*P < 0.05, **P < 0.01, ***P < 0.001, ns = not significant). Fasting blood glucose (FBG), creatinine (Cr), uric acid (UA), uric acid to HDL ratio (UHR ), triglyceride-glucose index (TyG), atherogenic index of plasma (AIP), total cholesterol (TC), low-density lipoprotein (LDL), fibrinogen (Fb), red blood cell count (RB), monocyte count (MO), systemic inflammation response index (SIRI), neutrophil-to-lymphocyte ratio (NLR)
Discussion
This study represents, to the best of our knowledge, the first and largest effort to apply multiple machine learning algorithms to routine clinical blood indicators and derived indices for predicting carotid plaque vulnerability, with a novel focus on sex-related heterogeneity. The Random Forest model achieved robust discrimination and was successfully interpreted using SHAP analysis, which revealed both global feature importance and individual-level effect directions. Notably, gender emerged as the top predictor, prompting a series of stratified analyses that uncovered significant heterogeneity in biomarker contributions, correlation structures, and risk trajectories between male and female patients. These findings support the clinical relevance of gender-aware risk modeling and provide mechanistic insight into gender-linked vulnerability in carotid atherosclerosis.
The application of ML in this study provided a powerful, interpretable framework for identifying individuals at risk for carotid plaque vulnerability using routinely available blood test indicators. Among five candidate algorithms, the Random Forest model demonstrated the best discriminative ability, achieving an AUC of 0.847 (95% CI 0.791–0.895) with high specificity (89.41%) in the test cohort, outperforming both logistic regression and SVM-based classifiers. Importantly, the model’s interpretability was enhanced through SHAP analysis, which quantified the marginal contribution of each feature to prediction outcomes (Fig. 5). As shown, Gender, Age, Fb, NLR, and Cr ranked among the top predictors, highlighting the relevance of inflammation, coagulation, and renal markers in plaque destabilization. Notably, gender ranked as the top predictor, reinforcing the profound influence of sex-specific biology on atherosclerotic disease processes. This finding is consistent with prior research indicating that hormonal status, immune cell function, and vascular responses differ markedly between males and females, potentially shaping divergent plaque phenotypes and vulnerability patterns [28, 31]. Age and Fb also emerged as leading predictors. The strong contribution of age reflects the cumulative effects of vascular aging, endothelial dysfunction, and chronic inflammation [32,33,34]. Fb, a key coagulation factor and acute-phase reactant, may indicate underlying plaque instability via promotion of thrombus formation and inflammatory cascades [35,36,37]. Inflammatory markers, including NLR, SIRI, and SII, were ranked highly, underscoring the central role of systemic inflammation in plaque destabilization [38, 39]. These indices, which reflect neutrophil predominance and lymphocyte suppression, may be indicative of innate immune activation and impaired resolution of inflammation, both of which are implicated in necrotic core expansion and fibrous cap thinning [40,41,42,43]. Renal function markers, such as Cr and urea, also demonstrated substantial contributions. This may suggest a link between microvascular injury, uremic toxins, and accelerated atherosclerosis. Additionally, metabolic indicators such as FBG, TyG, and AIP contributed notably to the model, supporting the hypothesis that insulin resistance and lipid dysregulation fuel pro-inflammatory vascular remodeling [44]. Importantly, several features with relatively modest traditional significance (e.g., PLR, UA, TC) still showed meaningful SHAP values, implying that ML models can uncover subtle yet relevant patterns that may escape conventional statistical thresholds. Together, this ranking provides mechanistic insight into the multifaceted interplay between inflammation, metabolism, and vascular health, while also emphasizing the central, and often underappreciated, role of gender in modulating these effects.
In addition to the predictive contributions of individual biomarkers, our correlation analysis revealed distinct patterns of inter-marker connectivity across plaque phenotypes and between sexes, suggesting that plaque vulnerability may arise not only from the elevation of single indicators but also from the disruption and reorganization of biological networks. In the overall population, a dense and significant correlation structure was observed among inflammatory, metabolic, and hematological markers, reflecting a tightly coupled systemic profile under general physiological conditions. However, upon stratification by plaque subtype, the network architectures diverged. In the vulnerable plaque group, markers such as TyG, UHR, SIRI, FBG, and Cr exhibited stronger pairwise correlations (e.g., TyG–UHR, SIRI–FBG, Cr–SII; see Fig. 2), suggesting coordinated activation of pro-atherogenic, pro-inflammatory, and metabolic stress pathways. This integrated network may reflect a more unstable vascular milieu, in which systemic metabolic and immune dysregulation drive plaque destabilization. In contrast, the stable plaque group demonstrated weaker, more fragmented correlations, possibly indicative of more localized or compartmentalized biological regulation, consistent with a less activated pathophysiologic state. Beyond plaque phenotype, sex-stratified analyses further revealed divergent correlation topologies. In males, inflammatory and metabolic indices (e.g., SII–Age, Cr–NLR, RB–Fb, Cr–HbA1c) were more tightly linked, pointing toward a cohesive inflammatory–renal–hematologic axis. In females, a distinct pattern emerged, with stronger coupling between markers of glycemic control, lipid metabolism, renal function, and immunity (e.g., HbA1c–SIRI, MO–Cr, Age–HbA1c, MO–TC, LDL–Cr). These sex-specific correlation structures likely reflect differences in immune-metabolic regulation, hormonal milieu, and vascular remodeling processes. Mechanistically, these sex-specific correlation patterns may reflect fundamental biological differences in atherosclerotic disease evolution. Men are more likely to develop symptomatic carotid atherosclerosis earlier in life, often characterized by lipid-rich necrotic cores and intraplaque hemorrhage, which are closely associated with plaque rupture and thromboembolic events [8]. In contrast, women—particularly in the postmenopausal stage—exhibit a shift toward plaque erosion rather than rupture, potentially linked to changes in endothelial integrity, immune cell activation, and the loss of estrogen’s vascular protective effects [45]. These gender-related differences in plaque morphology and remodeling have been confirmed in histological and imaging studies [8, 28, 46, 47].
SHAP analysis identified non-linear, threshold-dependent effects for several key features, including Age, TyG, FBG, and HbA1c. These variables exhibited SHAP = 0 crossings at biologically relevant points, indicating shifts from protective to harmful contributions. First-order SHAP derivatives further revealed sharp gradient peaks in specific value ranges, reflecting rapid increases in predicted plaque vulnerability. For example, age showed its steepest SHAP increase between 66 and 70 years, highlighting this range as a critical window of accelerated vascular vulnerability. LDL also showed non-linear behavior, with SHAP = 0 crossings around 69 and 134 mg/dL, and gradient peaks near 144 mg/dL. These patterns suggest that risk contribution increases primarily at higher LDL levels, consistent with lipid-driven plaque progression [9]. Likewise, TyG, FBG, and HbA1c presented pronounced gradient peaks near 9.1, 135 mg/dL, and 6.3%, respectively—values aligned with subclinical metabolic stress and glycemic thresholds. Notably, inflammatory indices such as SIRI, SII, and PLR showed steep SHAP derivatives despite relatively low mean SHAP values, suggesting that even mild elevations may mark early systemic inflammatory activation. For instance, SIRI reached a gradient peak above 0.13 within the 0.6–0.7 range, and SII displayed sharp risk transitions between 360 and 390. These localized patterns imply that certain biomarkers act as early “tipping points” in the pathogenesis of plaque destabilization. Coagulation and renal markers such as Fb and Cr also exhibited non-linear contributions. Fb showed inflection points between 2.5 and 3.3 g/L, consistent with early prothrombotic states, while Cr presented steeper SHAP gradients in the 85–100µmol/L range, corresponding to subclinical renal impairment. In addition, characteristics such as age and HbA1c were previously classified as linear based on comparable AUCs between logistic regression and XGBoost models, SHAP dependence plots revealed localized non-linear contributions. This apparent discrepancy reflects the difference in analytic focus: AUC-based comparisons assess global predictive performance, while SHAP captures local marginal effects across the feature range. Thus, a feature may exhibit linear behavior at the model level but still demonstrate threshold-like patterns or inflection points at specific value intervals. These insights highlight the value of combining global and local interpretability methods for a more comprehensive understanding of feature impact.
Integration of routine clinical blood tests and derived indicators—such as TyG, AIP, NLR, SIRI, and UHR—substantially enhanced model performance [48,49,50,51,52,53]. These indices represent converging axes of metabolic dysregulation, immune activation, and endothelial stress, which are now recognized as core drivers of atherosclerotic plaque instability [54,55,56]. Importantly, our findings extend prior work by demonstrating that the contributions of these biomarkers vary significantly between genders. Our SHAP-based analysis revealed notable sex-specific differences in both the timing and dynamics of biomarker contributions to carotid plaque vulnerability. Age consistently emerged as a key contributor, but with distinct patterns between genders. In males, the SHAP value became positive at 63 years, with concentrated risk acceleration at 66–70 years. In females, although the SHAP inflection occurred later (66 years), the sharpest changes in risk contribution were spread across a broader range (59–68 years). These patterns may reflect differences in vascular aging trajectories, with men experiencing earlier endothelial dysfunction and cumulative damage, while women transition into risk more gradually—potentially mediated by perimenopausal hormonal changes and the loss of estrogen’s vascular protective effects. Lipid and metabolic markers such as LDL and TyG showed threshold-based risk increases in both sexes but with different profiles. Females exhibited steeper SHAP gradients at higher LDL values, while males had more distributed transitions. TyG showed multiple inflection points and SHAP peaks in males, reflecting prolonged metabolic stress, whereas females showed sharper risk shifts in a narrower range, aligning with hormonally modulated metabolic sensitivity. Glycemic markers (FBG, HbA1c) also revealed sex-specific behavior. Males showed SHAP risk transitions at lower glucose values, while females displayed sharper gradient peaks even near or below conventional diagnostic cutoffs (e.g., HbA1c 5.3–6.1%), consistent with heightened vascular reactivity to glycemic disturbance. Inflammatory indices, particularly SII and PLR, showed substantially higher SHAP derivatives in females (e.g., SII up to 8033.27), indicating a more abrupt transition into risk. These results may reflect sex differences in immune regulation, endothelial activation, and inflammatory amplification, particularly after menopause. In addition, the SHAP scatter plots in Fig. 8 further confirmed that males consistently exhibited significantly higher SHAP values for several high-ranking features—including Cr, FBG, UHR, TyG, and SIRI—indicating stronger marginal contributions of renal, glycemic, and inflammatory stress to predicted risk in men. Meanwhile, females showed comparable or even elevated SHAP distributions for features such as HbA1c, LYM, and TC, suggesting distinct immune-metabolic sensitivity patterns. Overall, males tended to exhibit earlier but smoother risk transitions, while females displayed later but more abrupt shifts across multiple biological domains. These differences may reflect sex-specific responses to systemic inflammation, hormonal regulation, and vascular stress, echoing observations from prior cardiovascular cohorts [57,58,59]. Such divergence further reinforces the rationale for incorporating gender into model interpretation and clinical decision-making.
Our RCS modeling revealed pronounced sex-specific differences in the non-linear risk trajectories of multiple hematological and metabolic markers associated with carotid plaque vulnerability. These differences extended beyond simple threshold shifts, reflecting divergent biological inflection patterns and magnitudes across biomarker distributions. For instance, males exhibited steeper risk elevations in age intervals beyond 57 years, suggesting accelerated vascular aging and earlier endothelial dysfunction. This aligns with prior findings that men tend to develop clinically relevant carotid lesions earlier in life, often with a rupture-prone phenotype. In contrast, females showed more gradual age-associated risk escalation, potentially influenced by hormonal transitions such as menopause and the loss of estrogen’s vascular protective effects. Notably, glycemic and glyco-inflammatory markers—including FBG, HbA1c, TyG, and UHR—demonstrated higher risk contributions in females at elevated levels. These findings suggest increased metabolic sensitivity and inflammatory reactivity among women, particularly under stress or insulin-resistant states. This is supported by mechanistic studies showing enhanced endothelial dysfunction and immune activation in postmenopausal females, even at subclinical glucose elevations [60, 61]. Conversely, males displayed sharper inflection points for markers such as Cr, Fb, and MO, indicating stronger associations between renal function, coagulation, and hematologic status with plaque risk in men. These sex-specific patterns may reflect differential immune-metabolic setpoints and systemic compensation mechanisms across the sexes. The observed divergence in RCS curves also highlights the limitations of applying uniform biomarker thresholds across genders. For example, at similar LDL levels, predicted risk diverged between sexes, with males showing higher probabilities in low LDL ranges, suggesting distinct lipid handling and vascular response profiles. The observed gender differences in biomarker importance and inflection points are biologically plausible and increasingly supported by research evidence. A recent single-cell RNA sequencing study identified substantial gender-based heterogeneity in the subcellular composition and gene-regulatory activity of carotid plaques. In females, smooth muscle cells (SMCs) showed a shift toward osteogenic phenotypes, while macrophage subclusters were enriched f or immune presentation and TREM1-high inflammatory signatures. In contrast, male plaques were dominated by chondrocytic SMCs, angiogenic endothelial cells, and T cell cytotoxicity pathways [28]. These gender-divergent subcellular landscapes mirror our findings of differing inflammatory-metabolic correlations and SHAP-derived risk curves, supporting the biological basis for sex-specific modeling approaches. By capturing nuanced, gender-stratified, non-linear biomarker-risk relationships, our model provides a more biologically aligned framework for individualized stroke prevention strategies.
Despite its strengths, several limitations should be acknowledged. First, this was a single-center retrospective study, which may limit external generalizability. Second, reliance on ultrasound for plaque classification introduces potential variability compared to histological or MRI-based assessment. Third, the absence of critical confounders such as smoking status, physical activity, and medication use restricts comprehensive risk adjustment. Fourth, while SHAP and RCS analyses enhance model transparency, they are inherently associative and do not establish causal links. Finally, external validation in larger, multicenter cohorts is essential to confirm the robustness and utility of the proposed model.
In summary, this study demonstrates that integrating routine clinical blood biomarkers with interpretable machine learning models enables accurate prediction of vulnerable carotid plaques. Notably, sex-specific differences emerged as a central theme, with divergent biomarker contributions, inflection points, and correlation structures observed between men and women. The combination of SHAP and RCS analyses revealed critical non-linear feature effects and identified threshold-based risk transitions, offering practical tools for early risk stratification. By acknowledging and leveraging sex-based heterogeneity, this approach advances the development of individualized, precision-targeted strategies for stroke prevention, particularly in asymptomatic or subclinical populations.
Data availability
No datasets were generated or analysed during the current study.
Abbreviations
- ML:
-
Machine learning
- SHAP:
-
SHapley Additive exPlanations
- RCS:
-
Restricted cubic spline
- ROC:
-
Receiver operator characteristic curve
- AUC:
-
Area under the ROC curve
- MI:
-
Mutual information
- RFE:
-
Recursive feature elimination
- SFS:
-
Sequential forward selection
- RF:
-
Random Forest
- LR:
-
Logistic regression
- SVM:
-
Support vector machine
- KNN:
-
K-nearest neighbors
- LOWESS:
-
Locally weighted scatterplot smoothing
- IQR:
-
Interquartile ranges
- SD:
-
Standard deviations
- FDR:
-
False discovery rate
- CVDs:
-
Cardiovascular diseases
- TyG:
-
Triglyceride-glucose index
- AIP:
-
Atherogenic index of plasma
- NLR:
-
Neutrophil-to-lymphocyte ratio
- SIRI:
-
Systemic inflammation response index
- UHR:
-
Uric acid to high-density lipoprotein ratio
- CTA:
-
Computed tomography angiography
- MRI:
-
Magnetic resonance imaging
- PLR:
-
Platelet-to-lymphocyte ratio
- SII:
-
Systemic immune-inflammation index
- SHR:
-
Stress hyperglycemia ratio
- MLR:
-
Monocyte-to-lymphocyte ratio
- AISI:
-
Aggregate index of systemic inflammation
- HbA1c:
-
Glycosylated hemoglobin A1c
- FBG:
-
Fasting blood glucose
- TG:
-
Triglycerides
- TC:
-
Total cholesterol
- LDL:
-
Low-density lipoprotein
- HDL:
-
High-density lipoprotein
- VLDL:
-
Very-low-density lipoprotein
- Cr:
-
Creatinine
- UA:
-
Uric acid
- Na:
-
Sodium
- K:
-
Potassium
- Cl:
-
Chloride
- Ca:
-
Calcium
- Mg:
-
Magnesium
- P:
-
Phosphorus
- ALT:
-
Alanine aminotransferase
- AST:
-
Aspartate aminotransferase
- ALP:
-
Alkaline phosphatase
- Hb:
-
Hemoglobin
- RB:
-
Red blood cell count
- PLT:
-
Platelet count
- Fb:
-
Fibrinogen
- NE:
-
Neutrophil count
- LYM:
-
Lymphocyte count
- MO:
-
Monocyte count
- EO:
-
Eosinophil count
- BA:
-
Basophil count
References
Saba L, Cau R, Murgia A, Nicolaides AN, Wintermark M, Castillo M, Staub D, Kakkos SK, Yang Q, Paraskevas KI, et al. Carotid Plaque-RADS: a novel stroke risk classification system. JACC Cardiovasc Imaging. 2024;17(1):62–75.
Kopczak A, Schindler A, Bayer-Karpinska A, Koch ML, Sepp D, Zeller J, Strecker C, Hempel JM, Yuan C, Malik R, et al. Complicated carotid artery plaques as a cause of cryptogenic stroke. J Am Coll Cardiol. 2020;76(19):2212–22.
Saba L, Saam T, Jäger HR, Yuan C, Hatsukami TS, Saloner D, Wasserman BA, Bonati LH, Wintermark M. Imaging biomarkers of vulnerable carotid plaques for stroke risk prediction and their potential clinical implications. Lancet Neurol. 2019;18(6):559–72.
Johri AM, Herr JE, Li TY, Yau O, Nambi V. Novel ultrasound methods to investigate carotid artery plaque vulnerability. J Am Soc Echocardiogr Off Publ Am Soc Echocardiogr. 2017;30(2):139–48.
Schindler A, Schinner R, Altaf N, Hosseini AA, Simpson RJ, Esposito-Bauer L, Singh N, Kwee RM, Kurosaki Y, Yamagata S, et al. Prediction of stroke risk by detection of hemorrhage in carotid plaques: meta-analysis of individual patient data. JACC Cardiovasc Imaging. 2020;13(2 Pt 1):395–406.
Kamel H, Navi BB, Merkler AE, Baradaran H, Díaz I, Parikh NS, Kasner SE, Gladstone DJ, Iadecola C, Gupta A. Reclassification of ischemic stroke etiological subtypes on the basis of high-risk nonstenosing carotid plaque. Stroke. 2020;51(2):504–10.
Murata K, Murata N, Chu B, Watase H, Hippe DS, Balu N, Sun J, Zhao X, Hatsukami TS, Yuan C. Characterization of carotid atherosclerotic plaques using 3-Dimensional MERGE magnetic resonance imaging and correlation with stroke risk factors. Stroke. 2020;51(2):475–80.
Ota H, Reeves MJ, Zhu DC, Majid A, Collar A, Yuan C, DeMarco JK. Sex differences in patients with asymptomatic carotid atherosclerotic plaque: in vivo 3.0-T magnetic resonance study. Stroke. 2010;41(8):1630–5.
Ma X, Wang Q, Hu X, Wang X, Zhao Y, Liu X, Li J, Du Y, Wang M, Qiu C, et al. Association of sdLDL-C with incident carotid plaques with stable and vulnerable morphology: a prospective cohort study. Stroke. 2024;55(3):576–85.
Baradaran H, Eisenmenger LB, Hinckley PJ, de Havenon AH, Stoddard GJ, Treiman LS, Treiman GS, Parker DL, Scott McNally, J. Optimal carotid plaque features on computed tomography angiography associated with ischemic stroke. J Am Heart Association. 2021;10(5):e019462.
Ning C, Ouyang H, Xiao J, Wu D, Sun Z, Liu B, Shen D, Hong X, Lin C, Li J, et al. Development and validation of an explainable machine learning model for mortality prediction among patients with infected pancreatic necrosis. EClinicalMedicine. 2025;80:103074.
Yoo SK, Fitzgerald CW, Cho BA, Fitzgerald BG, Han C, Koh ES, Pandey A, Sfreddo H, Crowley F, Korostin MR, et al. Prediction of checkpoint inhibitor immunotherapy efficacy for cancer using routine blood tests and clinical data. Nat Med. 2025;31(3):869–80.
Aaseth E, Halvorsen S, Helseth R, Gravning JA. Remnant cholesterol, plasma triglycerides and risk of cardiovascular disease events in young adults: a prospective cohort study. Eur J Prev Cardiol 2025. https://doi.org/10.1093/eurjpc/zwaf104
Björkegren JLM, Lusis AJ. Atherosclerosis: recent developments. Cell. 2022;185(10):1630–45.
Peng M, Wang L, Xia Y, Tao L, Liu Y, Huang F, Li S, Gong X, Liu X, Xu G. High dietary inflammatory index is associated with increased plaque vulnerability of carotid in patients with ischemic stroke. Stroke. 2020;51(10):2983–9.
Gong P, Liu Y, Gong Y, Chen G, Zhang X, Wang S, Zhou F, Duan R, Chen W, Huang T, et al. The association of neutrophil to lymphocyte ratio, platelet to lymphocyte ratio, and lymphocyte to monocyte ratio with post-thrombolysis early neurological outcomes in patients with acute ischemic stroke. J Neuroinflamm. 2021;18(1):51.
Jiang L, Cai X, Yao D, Jing J, Mei L, Yang Y, Li S, Jin A, Meng X, Li H, et al. Association of inflammatory markers with cerebral small vessel disease in community-based population. J Neuroinflamm. 2022;19(1):106.
Huo RR, Liao Q, Zhai L, You XM, Zuo YL. Interacting and joint effects of triglyceride-glucose index (TyG) and body mass index on stroke risk and the mediating role of TyG in middle-aged and older Chinese adults: a nationwide prospective cohort study. Cardiovasc Diabetol. 2024;23(1):30.
Lopez-Jaramillo P, Gomez-Arbelaez D, Martinez-Bello D, Abat MEM, Alhabib KF, Avezum Á, Barbarash O, Chifamba J, Diaz ML, Gulec S, et al. Association of the triglyceride glucose index as a measure of insulin resistance with mortality and cardiovascular disease in populations from five continents (PURE study): a prospective cohort study. Lancet Healthy Longev. 2023;4(1):e23–33.
Min Q, Wu Z, Yao J, Wang S, Duan L, Liu S, Zhang M, Luo Y, Ye D, Huang Y, et al. Association between atherogenic index of plasma control level and incident cardiovascular disease in middle-aged and elderly Chinese individuals with abnormal glucose metabolism. Cardiovasc Diabetol. 2024;23(1):54.
Sardu C, Pieretti G, D’Onofrio N, Ciccarelli F, Paolisso P, Passavanti MB, Marfella R, Cioffi M, Mone P, Dalise AM, et al. Inflammatory cytokines and SIRT1 levels in subcutaneous abdominal fat: relationship with cardiac performance in overweight Pre-diabetics patients. Front Physiol. 2018;9:1030.
Sardu C, Paolisso G, Marfella R. Inflammatory related cardiovascular diseases: from molecular mechanisms to therapeutic targets. Curr Pharm Design. 2020;26(22):2565–73.
Dolz S, Górriz D, Tembl JI, Sánchez D, Fortea G, Parkhutik V, Lago A. Circulating MicroRNAs as novel biomarkers of stenosis progression in asymptomatic carotid stenosis. Stroke. 2017;48(1):10–6.
Sardu C, Modugno P, Castellano G, Scisciola L, Barbieri M, Petrella L, Fanelli M, Macchia G, Caradonna E, Massetti M et al. Atherosclerotic plaque fissuration and clinical outcomes in pre-diabetics vs. normoglycemics patients affected by asymptomatic significant carotid artery stenosis at 2 years of follow-up: role of MicroRNAs modulation: the ATIMIR study. Biomedicines. 2021;9(4):401.
Jochmann SL, Sievering EMW, Ernst J, Ringlstetter R, Grosshennig A, Weissenborn K, Grosse GM. Sex-Specific risk factors of nonstenotic carotid plaque in embolic stroke of unknown source: a case-control study. Stroke. 2024;55(2):296–300.
Gasbarrino K, Di Iorio D, Daskalopoulou SS. Importance of sex and gender in ischaemic stroke and carotid atherosclerotic disease. Eur Heart J. 2022;43(6):460–73.
Song JW, Cao Q, Siegler JE, Thon JM, Woo JH, Cucchiara BL. Sex differences in carotid plaque composition in patients with embolic stroke of undetermined source. J Am Heart Association. 2021;10(9):e020143.
Sukhavasi K, Mocci G, Ma L, Hodonsky CJ, Diez Benevante E, Muhl L, Liu J, Gustafsson S, Buyandelger B, Koplev S, et al. Single-cell RNA sequencing reveals sex differences in the subcellular composition and associated gene-regulatory network activity of human carotid plaques. Nat Cardiovasc Res. 2025;4(4):412–32.
Rexrode KM, Madsen TE, Yu AYX, Carcel C, Lichtman JH, Miller EC. The impact of sex and gender on stroke. Circul Res. 2022;130(4):512–28.
Chen Z, Ouyang H, Sun B, Ding J, Zhang Y, Li X. Utilizing explainable machine learning for progression-free survival prediction in high-grade serous ovarian cancer: insights from a prospective cohort study. Int J Surg (London England). 2025;111:3224
van Dam-Nolen DHK, van Egmond NCM, Dilba K, Nies K, van der Kolk AG, Liem MI, Kooi ME, Hendrikse J, Nederkoorn PJ, Koudstaal PJ, et al. Sex differences in plaque composition and morphology among symptomatic patients with Mild-to-Moderate carotid artery stenosis. Stroke. 2022;53(2):370–8.
Tyrrell DJ, Blin MG, Song J, Wood SC, Zhang M, Beard DA, Goldstein DR. Age-Associated mitochondrial dysfunction accelerates atherogenesis. Circul Res. 2020;126(3):298–314.
Kim SY, Cheon J. Senescence-associated microvascular endothelial dysfunction: a focus on the blood-brain and blood-retinal barriers. Ageing Res Rev. 2024;100:102446.
Paneni F, Osto E, Costantino S, Mateescu B, Briand S, Coppolino G, Perna E, Mocharla P, Akhmedov A, Kubant R, et al. Deletion of the activated protein-1 transcription factor JunD induces oxidative stress and accelerates age-related endothelial dysfunction. Circulation. 2013;127(11):1229–40. e1221-1221.
Luyendyk JP, Schoenecker JG, Flick MJ. The multifaceted role of fibrinogen in tissue injury and inflammation. Blood. 2019;133(6):511–20.
Lei J, Zhou Y, Zhao H, Chen Y, Yan G, Wu L, Xu Y, Zhang J, Zhang X, Wang J, et al. Dabigatran activates inflammation resolution by promoting fibrinogen-like protein 2 shedding and RvD5(n-3 DPA) production. Theranostics. 2021;11(9):4251–61.
Hahn J, Temprano-Sagrera G, Hasbani NR, Ligthart S, Dehghan A, Wolberg AS, Smith NL, Sabater-Lleal M, Morrison AC, de Vries PS. Bivariate genome-wide association study of Circulating fibrinogen and C-reactive protein levels. J Thromb Haemostasis: JTH. 2024;22(12):3448–59.
Ménégaut L, Laubriet A, Crespy V, Leleu D, Pilot T, Van Dongen K, de Barros JP, Gautier T, Petit JM, Thomas C, et al. Inflammation and oxidative stress markers in type 2 diabetes patients with advanced carotid atherosclerosis. Cardiovasc Diabetol. 2023;22(1):248.
Harmon EY, Fronhofer V, Keller RS, Feustel PJ, Zhu X, Xu H, Avram D, Jones DM, Nagarajan S, Lennartz MR. Anti-inflammatory immune skewing is atheroprotective: Apoe–/–FcγRIIb–/– mice develop fibrous carotid plaques. J Am Heart Association. 2014;3(6):e001232.
Mawhin MA, Tilly P, Zirka G, Charles AL, Slimani F, Vonesch JL, Michel JB, Bäck M, Norel X, Fabre JE. Neutrophils recruited by leukotriene B4 induce features of plaque destabilization during endotoxaemia. Cardiovascular Res. 2018;114(12):1656–66.
Montecucco F, Di Marzo V, da Silva RF, Vuilleumier N, Capettini L, Lenglet S, Pagano S, Piscitelli F, Quintao S, Bertolotto M, et al. The activation of the cannabinoid receptor type 2 reduces neutrophilic protease-mediated vulnerability in atherosclerotic plaques. Eur Heart J. 2012;33(7):846–56.
Fernandez DM, Rahman AH, Fernandez NF, Chudnovskiy A, Amir ED, Amadori L, Khan NS, Wong CK, Shamailova R, Hill CA, et al. Single-cell immune landscape of human atherosclerotic plaques. Nat Med. 2019;25(10):1576–88.
Ma T, Gao Q, Zhu F, Guo C, Wang Q, Gao F, Zhang L. Th17 cells and IL-17 are involved in the disruption of vulnerable plaques triggered by short-term combination stimulation in Apolipoprotein E-knockout mice. Cell Mol Immunol. 2013;10(4):338–48.
Zhao S, Yu S, Chi C, Fan X, Tang J, Ji H, Teliewubai J, Zhang Y, Xu Y. Association between macro- and microvascular damage and the triglyceride glucose index in community-dwelling elderly individuals: the Northern Shanghai study. Cardiovasc Diabetol. 2019;18(1):95.
Wendorff C, Wendorff H, Pelisek J, Tsantilas P, Zimmermann A, Zernecke A, Kuehnl A, Eckstein HH. Carotid plaque morphology is significantly associated with sex, age, and history of neurological symptoms. Stroke. 2015;46(11):3213–9.
Mosquera JV, Auguste G, Wong D, Turner AW, Hodonsky CJ, Alvarez-Yela AC, Song Y, Cheng Q, Lino Cardenas CL, Theofilatos K, et al. Integrative single-cell meta-analysis reveals disease-relevant vascular cell States and markers in human atherosclerosis. Cell Rep. 2023;42(11):113380.
Franzén O, Ermel R, Cohain A, Akers NK, Di Narzo A, Talukdar HA, Foroughi-Asl H, Giambartolomei C, Fullard JF, Sukhavasi K, et al. Cardiometabolic risk loci share downstream cis- and trans-gene regulation across tissues and diseases. Sci (New York NY). 2016;353(6301):827–30.
Yi Y, Luo Q, Chen J, Chen Z, Aydemir HA, Chen P, Tang J, Luo F, Fang Z. Association between the uric acid-to-HDL-cholesterol ratio (UHR) and the risk of cardiovascular disease and dyslipidemia: a population-based study. Lipids Health Dis. 2025;24(1):143.
Li W, Chen D, Tao Y, Lu Z, Wang D. Association between triglyceride-glucose index and carotid atherosclerosis detected by ultrasonography. Cardiovasc Diabetol. 2022;21(1):137.
Li Z, He Y, Wang S, Li L, Yang R, Liu Y, Cheng Q, Yu L, Zheng Y, Zheng H, et al. Association between triglyceride glucose index and carotid artery plaque in different glucose metabolic States in patients with coronary heart disease: a RCSCD-TCM study in China. Cardiovasc Diabetol. 2022;21(1):38.
Guo Y, Wang F, Ma S, Mao Z, Zhao S, Sui L, Jiao C, Lu R, Zhu X, Pan X. Relationship between atherogenic index of plasma and length of stay in critically ill patients with atherosclerotic cardiovascular disease: a retrospective cohort study and predictive modeling based on machine learning. Cardiovasc Diabetol. 2025;24(1):95.
Wu XB, Huang LX, Huang ZR, Lu LM, Luo B, Cai WQ, Liu AM, Wang SW. The lymphocyte-to-monocyte ratio predicts intracranial atherosclerotic stenosis plaque instability. Front Immunol. 2022;13:915126.
Qin P, Ho FK, Celis-Morales CA, Pell JP. Association between systemic inflammation biomarkers and incident cardiovascular disease in 423,701 individuals: evidence from the UK biobank cohort. Cardiovasc Diabetol. 2025;24(1):162.
Sarlon-Bartoli G, Bennis Y, Lacroix R, Piercecchi-Marti MD, Bartoli MA, Arnaud L, Mancini J, Boudes A, Sarlon E, Thevenin B, et al. Plasmatic level of leukocyte-derived microparticles is associated with unstable plaque in asymptomatic patients with high-grade carotid stenosis. J Am Coll Cardiol. 2013;62(16):1436–41.
Silvestre-Roig C, de Winther MP, Weber C, Daemen MJ, Lutgens E, Soehnlein O. Atherosclerotic plaque destabilization: mechanisms, models, and therapeutic strategies. Circul Res. 2014;114(1):214–26.
Yurdagul A Jr. Crosstalk between macrophages and vascular smooth muscle cells in atherosclerotic plaque stability. Arterioscler Thromb Vasc Biol. 2022;42(4):372–80.
Mazhar F, Faucon AL, Fu EL, Szummer KE, Mathisen J, Gerward S, Reuter SB, Marx N, Mehran R, Carrero JJ. Systemic inflammation and health outcomes in patients receiving treatment for atherosclerotic cardiovascular disease. Eur Heart J. 2024;45(44):4719–30.
Moran CA, Collins LF, Beydoun N, Mehta PK, Fatade Y, Isiadinso I, Lewis TT, Weber B, Goldstein J, Ofotokun I, et al. Cardiovascular implications of immune disorders in women. Circul Res. 2022;130(4):593–610.
Dushay J, Rickers ES, Wang E, Gilman J, Zhang Y, Blankstein R, Gervino EV, Jerosch-Herold M, Veves A. Effects of age and sex on systemic inflammation and cardiometabolic function in individuals with type 2 diabetes. J Am Heart Association. 2025;14(3):e037863.
Fryk E, Rodrigues Silva VR, Bauzá-Thorbrügge M, Schmelz M, Gan LM, Strindberg L, Jansson PA. Feasibility of high-dose Tadalafil and effects on insulin resistance in well-controlled patients with type 2 diabetes (MAKROTAD): a single-centre, double-blind, randomised, placebo-controlled, cross-over phase 2 trial. EClinicalMedicine. 2023;59:101985.
Darvish S, Murray KO, Ludwig KR, Avalani KH, Craighead DH, Freeberg KA, Bevers S, Reisz JA, D’Alessandro A, Moreau KL, et al. Preservation of vascular endothelial function in late-onset postmenopausal women. Circul Res. 2025;136(5):455–69.
Acknowledgements
All authors actively participated in the research process made substantial contributions to manuscript revisions, and carefully reviewed and approved the final version.
Funding
National Science and Technology Major Project (No. 2023ZD0503900; 2023ZD0503902).
Ethics declarations
Ethics approval and consent to participate
This study was a retrospective analysis approved by the Ethics Committee of Suzhou Municipal Hospital. Given the use of de-identified clinical data, the requirement for informed consent from individual participants was waived by the Ethics Committee.
Competing interests
The authors declare no competing interests.
Additional information
Publisher’s note
Springer Nature remains neutral with regard to jurisdictional claims in published maps and institutional affiliations.
Electronic supplementary material
Below is the link to the electronic supplementary material.
12933_2025_2867_MOESM3_ESM.xlsx
Supplementary Table S3: Calculate the Spearman correlation coefficient of the selected variables between stable plaques and vulnerable plaques
Rights and permissions
Open Access This article is licensed under a Creative Commons Attribution-NonCommercial-NoDerivatives 4.0 International License, which permits any non-commercial use, sharing, distribution and reproduction in any medium or format, as long as you give appropriate credit to the original author(s) and the source, provide a link to the Creative Commons licence, and indicate if you modified the licensed material. You do not have permission under this licence to share adapted material derived from this article or parts of it. The images or other third party material in this article are included in the article’s Creative Commons licence, unless indicated otherwise in a credit line to the material. If material is not included in the article’s Creative Commons licence and your intended use is not permitted by statutory regulation or exceeds the permitted use, you will need to obtain permission directly from the copyright holder. To view a copy of this licence, visit http://creativecommons.org/licenses/by-nc-nd/4.0/.
About this article

Cite this article
E, Y., Yao, Z., Ge, M. et al. Development and validation of a machine learning model for predicting vulnerable carotid plaques using routine blood biomarkers and derived indicators: insights into sex-related risk patterns. Cardiovasc Diabetol 24, 326 (2025). https://doi.org/10.1186/s12933-025-02867-6
Received:
Accepted:
Published:
DOI: https://doi.org/10.1186/s12933-025-02867-6