
仅在常规儿科检查中使用机器学习来预测儿童近视折射率的发作
作者:Goldstein, Anat
介绍
近视风险不断升级,与威胁性状况(例如白内障)有关1青光眼2和视网膜疾病3提出了重大的公共卫生挑战4。与普通人群相比5。预测表明,到2050年,全球人口的一半可能是近视6早期识别和干预的重要性至关重要。这种不断上升的患病率,加上对视觉健康和整体生活质量的有害影响,强调了旨在减慢近视发展或阻止其发作的策略的需求。儿童近视的患病率也在增加6使其成为在儿童中进行常规眼检查的原因之一。从这些常规眼检查中收集的数据可用于分析和识别患有眼科问题(尤其是近视)风险增加的人。
多年来,已经引入了几种策略,以减缓近视发展甚至阻止其发作,重点关注行为,药理和光学方法7。行为建议包括增加室外时间8,,,,9已显示可降低近视风险,遵循20-20-20规则限制了近距离工作,并保持适当的阅读距离10,,,,11。药理治疗,特别是低剂量的阿托品眼滴12,,,,13,,,,14,,,,15,,,,16在减慢近视进展方面具有显着的有效性,副作用最小,甚至阻止它。光学解决方案,旨在减慢近视进展而不是预防,包括正差异(Ortho-K)镜头17和专门设计的多灶性软隐形眼镜18。奇观镜头也已成为有效工具,将进度率降低了50%19。通过确定有肌无力发展的儿童,医疗保健提供者可以采取有针对性的预防措施和干预措施,采取积极主动的方法来减轻近视对公共卫生的日益增长的影响。
近年来,人工智能(AI)技术已经快速发展,对整个研究和医学领域都有显着贡献,对眼科特殊影响20,,,,21。在AI领域内,机器学习(ML)和深度学习(DL)已成为强大的工具,展示了它们对医学应用的适用性。这些技术促进了数据分析,分析,自动诊断以及潜在结果的预测21提供各种各样的工具和方法,以辨别医疗数据中的复杂模式22,,,,23,,,,24。
ML模型,尤其是基于树木集合和深层神经网络的模型,它提供了将各种各样的良好成熟以及潜在的未置换变量集成到单个预测框架中的能力。与传统的统计方法(例如逻辑回归或生存分析)不同,在预测近视的其他研究中成功使用了25,,,,26,,,,27,,,,28ML模型不受假设的限制,例如自变量之间没有相关性。这种灵活性使他们能够发现变量之间的复杂关系和相互作用,从而为风险预测提供了细微的见解。尽管这样的ML模型可能无法就各个变量的影响提供直接的解释性,但它们通过将各种数据点综合为全面的风险评估工具来提供整体预测。
尽管在眼科中已经开发了许多应用,但主要关注影响成年人的疾病,尤其是影响视神经和视网膜的疾病29,,,,30,AI在小儿眼科中的利用相对有限20,,,,31,,,,32,,,,33,,,,34,,,,35。在小儿近视的背景下,只有很少的研究使用了ML36,,,,25,,,,27,,,,37,,,,38,,,,39,,,,40。
在这项研究中,我们介绍了基于ML的模型,以预测儿童近视的未来发展。这些模型依赖于在标准眼诊访问期间(临床和无抗信息)中易于访问的非侵入性数据。值得注意的是,我们故意排除了更复杂的测量值,例如轴向长度或角膜曲率,这些测量通常更具挑战性。上述先前的研究(以及其他变量)使用了此类测量值37,,,,38,,,,39。使用这些数据,这些预测模型的主要目的是主动识别没有近视的儿童,这些儿童的屈光近视变化风险较高。这种早期发现至关重要,因为它为早期干预策略打开了大门,大多是不保守的生活方式改变(例如,在户外花费更多的时间41,有可能减轻近视的发展,甚至可以防止其发作。
方法
这项研究是根据赫尔辛基宣布进行的,并获得了兰巴姆医疗保健校园伦理委员会的批准,该委员会放弃了同意书的要求。赫尔辛基批准号为RMB-D-0653-21。
数据
我们的数据集源自儿科眼科诊所的患者记录,包括2010年至2022年。数据集中的每个记录都对应于患者的访问,提供基本细节,例如独特的患者标识符,访问日期,访问时的患者年龄,产科历史,眼科状况的家族史,病史,访问期间收集的全面信息。值得注意的是,在当前的研究中,我们没有利用描述家族史,病史或产科历史的文本信息。取而代之的是,我们引入了相应的二进制变量,指示这些字段是否具有默认值,并表示问题的证据。这种方法使我们能够通过将文本数据转换为更结构化且在分析上可访问的格式来简化分析的同时合并相关信息。表中显示了变量,它们的描述和描述性统计数据的列表 1在结果部分。如果患者的左眼或右眼的球形等效物是从球体和右眼上计算出的球形等效词,则将患者归类为患有近视或近视屈光不确定的错误。
\(球形{\ text {}}等效\,= \,客观{\ text {}} refraction {{\ text {}} sphere \,+\,0.5 \ times object object {\ text {}
虽然近视发作的常规定义通常需要两只眼睛的球形等同于0.50 d或更多,但我们的研究重点是检测以前非侧虫种群中近视进展的最早迹象。
为了捕捉这些微妙的变化,我们将近视归类为近视,即使它仅在一只眼睛中被鉴定出来。
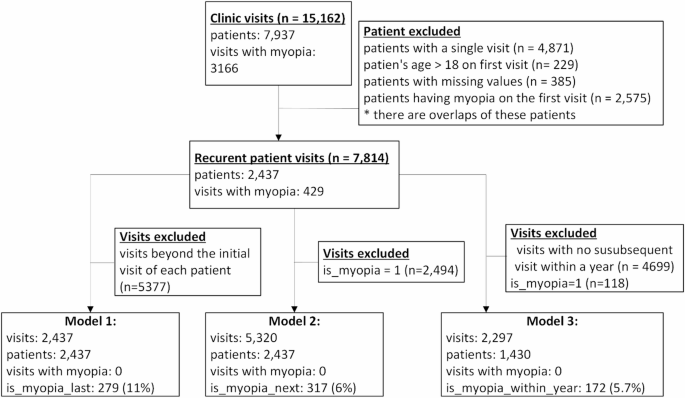
该数据集总共包括7937名患者的15,162次访问。在追求预测近视的过程中,我们排除了只有一次诊所就诊的患者,以及在初次就诊期间与近视介绍的患者。换句话说,我们只包括至少两次访问并且在第一次访问中没有被诊断出患有近视的患者。这导致了一个精致的数据集,该数据集由7814次涉及2437名患者的访问组成。在这个队列中,有429名(11%)的人最终发展了近视。每位患者的平均随访时间为3。08年。
数据准备
如果诸如客观折射球,圆柱体和角度等变量缺失值(通常是由于医生在特定访问期间进行未测量)的情况,我们通过将特定患者的先前访问中的缺失值推定,并且仅在三个月内发生在三个月内的情况下,并在较短的时间内进行临时性临时性,并且在较短的时间内进行了临时性的临时性,则在此方面进行了解决。这种方法使我们能够保留尽可能多的数据集,从而最大程度地减少潜在有价值的信息的丢失,同时在跨访问中保持单个患者数据的连续性。
我们为每次访问介绍了三个其他变量,可作为下面详述的预测模型的目标变量:
-
(1)
是近视最后:指示患者是否在访问后的某个时候发生了近视折射变化。
-
(2)
接下来是近视:指示患者随后的访问中是否发现了新的近视折射率。
-
(3)
是一年内的近视:指示是否在访问后一年内发生任何近视折射率。
这些变量根据患者的后续访问反映了未来的轨迹。例如,考虑一个在访问1时不是近视的患者,但后来在访问4中发展近视。该患者将在第一次访问中分类为:是近视最后如果访问4是最终记录的访问,并导致近视诊断;接下来是近视=错误,因为下一次访问不会导致近视诊断;是一年内的近视如果访问1和访问4之间的时间超过或等于一年,则=错误。
最后,为了保持对预测近视的关注,我们删除了患者已经患有近视的所有访问。
模型开发
我们构建了三个不同的近视预测模型:
-
模型1
该模型预测患者是否仅根据第一次访问就会在某个时候发展近视。训练该模型的数据集仅包括至少两次访问的患者的第一次访问。总共有2437次此类访问。该模型中的目标变量表明患者是否在第一次访问后发生近视,有279名(11.4%)患者最终发展近视。
-
模型2
对于患者没有近视的每次访问,该模型预测他们是否会在随后的访问中被诊断为近视。因此,用于培训的数据集该模型包括所有未诊断出近视的患者的访问(总共有5320次此类访问)。目标变量表示在下一次访问中是否被诊断为近视患者,共有317(6%)患者接受了这种诊断。
-
模型3
该模型可以预测,对于没有近视的每次访问,是否会在一年内诊断出患者患有近视。该模型的培训数据集涵盖了所有访问,患者没有近视,并在一年内进行了随后的访问,总共2297个实例。目标变量表明该患者是否在访问后一年内被诊断为近视,172(5.7%)的访问导致指定时间范围内的近视诊断。
数字1显示研究队列及其用于每个模型的子集。
在所有三个模型中,所使用的预测因素包括:年龄,性别,产科史,药物敏感性,病史,眼科史,缝隙灯眼检查,视力检查,敏锐度,环形循环折射和amblyopia(请参阅表格 1)。请注意,以下变量:产科历史,药物敏感性,病史,眼科历史和缝隙灯眼检查是二进制的(0不存在或1个现有)。还应注意的是,尽管通常相关的左眼和右眼折射率测量值,但我们还是选择基于经验评估的模型中包括两者。当我们仅使用右眼折射数据测试模型的简化版本时,预测性能始终下降(在所有模型中,AUC降低了0.01以上)。此外,在我们的研究中包括的7814次访问中,有1437(18.4%)在眼睛之间表现出球形等效(SE)的差异为0.50 d(平均差异= 0.15 d,SD = 0.36),这表明该眼睛的不对称可能性可能在临床上相关。由于这些原因,我们从两只眼睛中保留了折射率,以保持预测信号并保持临床保真度。
我们使用两种广泛采用的机器学习分类算法培训了这三个模型:“随机森林(RF)”和“梯度增强树(GBT)”,都在Scikit-Learn Python图书馆中可用42。这些模型很受欢迎,被认为对分类非常有效36,,,,43。
RF分类器创建了一个由决策树组成的森林,每个森林都以随机选择的特征子集进行训练。通过利用这些树木的集体智慧,RF模型通过巩固其单个产出来对给定样本进行预测。最终分类是由多数投票系统决定的,其中最常见的跨树的班级被选为最终标签44,,,,45。
相比之下,GBT分类器也是一个由多个决策树(弱学习者)组成的合奏模型,结合在一起形成强大的预测模型。在训练过程中,将树逐渐添加到模型中,每个后续树旨在通过梯度下降方法减少模型的误差。GBT模型在发现数据中的复杂模式方面表现出色,使它们对于分类任务特别有利46。
这两个模型都能够发现这些变量与因变量之间的复杂关系。此外,它们不受统计假设的限制(例如,独立变量,独立观察结果或因变量和自变量之间的特定关系之间没有多共线性)。
除了产生预测外,这两个模型都提供了功能分析能力47它可用于学习与近视发展相关的变量。这些分数提供了每个变量对模型预测性能的相对贡献的定量度量。较高的分数表明,该变量在区分结局方面起着更重要的作用,而较低的分数表明有限或可以忽略的影响。
我们采用功能重要性分析不仅对预测变量进行排名,还采用了逐步的特征消除程序,旨在简化模型,同时保持预测性能。从最不重要的功能(基于重要性得分)开始,我们一次迭代删除一个变量并重新评估模型性能。如果性能(AUC)保持稳定或改进,则该功能将被永久排除。如果性能退化,则重新引入该功能。这个过程一直持续到无法通过删除来实现进一步的改进。通过使用这种方法,我们确保最终模型仅保留了最有用的功能,从而提高了解释性并降低了过度拟合的风险,同时保持或增强了预测性准确性。

研究队列。该图显示了如何得出每个模型的子集。
由于我们的数据集固有的不平衡,其近视的患者比例明显小于那些(11%)的患者,我们通过上采样技术(例如合成少数群体过度采样技术(SMOTE))来解决这一差异。48。向上采样的目的是生成人造样品,以反映少数族裔中现有样品的特征。这种方法有助于该模型更好地学习少数群体的细微差别并增强其预测能力。
对模型性能采用的标准机器学习指标的评估,包括准确性,灵敏度(回忆),特异性,精度,F1得分(精度和召回的谐波平均值,在两者之间提供平衡)以及接收器操作特征(ROC)曲线(AUC)下的面积。为了确保结果的鲁棒性和意义,实施了10倍的交叉验证程序。K折交叉验证是ML中的一种模型评估技术,其中数据集分为K均等折叠,并且每次使用不同的折叠作为测试集,其余数据作为训练集训练和测试K时间。平均每次迭代的性能指标以评估模型的整体性能。为了防止数据泄漏并确保所有模型的交叉验证过程的完整性,我们确保在训练集或测试集中仅存在同一患者的所有访问。这种预防措施对于维持培训和测试阶段的独立性至关重要,避免了它们之间的任何信息共享。
结果
数据的描述性统计数据总结在表中 1。
如前所述,对于每种模型类型,我们提供两个版本:GBT和RF。值得注意的是,尽管我们努力通过为每个模型提高采样技术来增强模型性能,但仍未观察到改进。
在呈现了每个模型的性能之后,我们深入研究了功能重要性分析的结果,基于该结果,我们在删除了具有低重要性得分的特征后对模型进行了重新训练。
模型1:仅基于第一次访问的近视预测
鉴于患者的第一次访问数据,患者将来是否会在未来的任何特定点发展近视,旨在预测模型的第一种类型。我们介绍了图中GBT模型的ROC曲线。 2(由于结果表明GBT模型的性能略高于RF模型),并且两个模型在表格中的结果 2。图中GBT模型的ROC曲线。 2源自10倍的交叉验证中真实正率(TPR)和假阳性率(FPR)的平均值和标准偏差。曲线促进了由Youden指数确定的优化TPR和FPR之间优化权衡的分类阈值49。我们在曲线上突出了两个阈值点,展示了护理人员选择所需的性能指标(灵敏度,特异性和精度)时的灵活性。
桌子 2介绍了GBT(左侧)和RF(右侧)模型的性能指标,用于根据患者的第一次访问来预测近视。它显示与RF模型相比,GBT模型的性能要好得多。重要的是要注意桌子 2指示根据最佳Youden索引为每个模型选择的独特阈值。

基于GBT分类器的模型1的ROC曲线(10倍交叉验证平均值和标准偏差)。
在11%的阈值时,灵敏度为77%,精度为31%,而使用GBT的20%阈值如图所示。 2,灵敏度降至63%,但精度增加到40%。这些标记强调了阈值选择涉及的权衡,以与护理人员的某些绩效指标的优先级相吻合。
模型2:预测下次访问的近视
鉴于患者的访问数据,第二种模型旨在预测患者是否会在随后的访问中发展近视。图 3显示了GBT模型的ROC曲线(10倍交叉验证平均值和标准偏差)。就像在第一个模型中一样,在这里,曲线也促进了基于Youden索引的分类阈值的选择。
数字3在曲线上显示两个阈值点,每个阈值用GBT模型的相应灵敏度和精度指标注释。

基于GBT分类器的模型2的ROC曲线(10倍交叉验证平均值和标准偏差)。
在5%的阈值下,该模型的灵敏度为83%,精度为19%。相反,在阈值15%的情况下,灵敏度下降到54%,但精度升至30%。同样,这些数据点说明了阈值选择中的固有权衡,强调了调整如何使模型的性能与护理人员的特定性能指标的优先级相结合。
桌子 3介绍了GBT(左侧)和RF(右侧)模型的性能指标,以预测下一次访问中的近视,从而在当前访问中给出了患者的信息。表中显示的值 3对应于15%的阈值。与第一个模型一样,与RF模型相比,GBT模型的性能要好得多。
模型3:预测随后的近视
鉴于患者的访问数据,该模型的第三种模型旨在预测患者是否会在随后的一年内发展近视。图 4显示了GBT模型的ROC曲线(10倍交叉验证均值和标准偏差),并突出显示曲线上的两个阈值点及其各自的灵敏度和精度值。在10%的阈值时,根据Youden指数的最佳阈值,GBT模型的敏感性为71%,精度为16%,而在20%的阈值下,该模型的灵敏度降低到56%,但精度增加到24%。

基于GBT分类器的模型3的ROC曲线(10倍交叉验证平均值和标准偏差)。
桌子 4根据最佳阈值介绍GBT(左侧)模型(左侧)模型的性能指标。与第一个和第二个模型一样,与RF模型相比,GBT模型的性能要好得多。
特征重要性
桌子 5呈现以减小顺序的每个模型的重要性得分(相对权重)。
遵循功能重要性分析,我们应用了逐步的功能消除过程来完善模型。从最不重要的功能开始,我们一次迭代地删除了一个功能并重新训练该模型,仅保留那些去除的功能不会降低预测性能。该过程导致排除了几个低限量变量,例如折射眼镜特征,从而确保最终模型既简化又可解释,而不会损害精度。
从桌子上可以看出 6,删除这些功能会对模型的性能产生一定的影响,在某些情况下甚至改善了性能。特别是表 6介绍了GBT模型的性能,该模型在删除功能后总体上取得了更好的性能。
桌子 7在逐步消除程序之后,介绍了其余功能及其对最终减少GBT模型的重要性得分。该表强调了每个预测因子对模型性能的相对贡献,得分较高,表明在分类中的影响更大。
讨论
在这项研究中,我们提供了一种基于ML的方法来识别患有近视的风险更高的儿童,并在开始前进行了更个性化的后续措施和积极主动的治疗。该方法仅依赖于常规儿童的眼检查结果,并补充了散植物信息,而无需特殊设备或其他检查。因此,除了常规眼检查期间获得的数据外,我们没有使用轴向长度,角膜曲率或任何其他测量值。
我们开发了三个用于预测近视的模型:一个人根据第一次访问的某个时候预测近视,另一种预测下一次访问中的近视,第三次预测近年近视是近年的近视。这些模型表明,仅基于常规的小儿眼科检查,我们就可以预测近视的敏感性高达77%,特异性高达92%。有趣的是,尽管预测下一次访问中近视的模型(模型2)在较大的数据集上进行了培训,但与根据第一次访问(模型1)预测近视的未来开始的模型,其对相同精度的敏感性较低。这可能是由于模型2中的阶级不平衡较大,因为在定义的随访间隔内发展近视的儿童比例低于模型1。因此,该模型在识别少数群体(发展近视的儿童)的模式方面面临更大的困难,从而导致灵敏度的降低。但是,尽管在敏感性方面取消了这种权衡,但模型2仍达到了更高的AUC,这表明该模型可以更好地区分不同分类阈值的近视和非侧型病例,并在考虑敏感性和特异性时提供了强大的总体预测信号。
重要的是要注意,我们的ML模型不会为照顾者提供传统的风险因素。取而代之的是,每个模型都根据历史数据提供了一个估计,提供了全面的风险评估,而无需参考特定风险因素。尽管与经典统计方法(例如逻辑回归或生存分析)相比,这似乎不容易解释,但ML模型超出了预定义的风险因素,并捕获了更广泛的变量之间的复杂关系,这些变量既建立又未探索。与关注单个风险因素的传统方法相比,这种全面的方法可以进行更准确的预测。我们确实使用特征重要性分析来识别模型中具有更大权重的变量,并且删除了不重量的变量,以简化模型而不牺牲预测精度。
我们的模型专注于在基于社区的主要诊所进行随访期间发展近视的患者,所有患者均由单个检查员进行检查。该子集由至少两次检查,最初被诊断出患有近视的人。While the models exhibit a relatively high number of false positives (precision of ~ 30%), meaning that we may monitor or treat patients who ultimately do not develop myopia, they enable us to use straightforward means and tools for more reliable patient classification.To draw a parallel with similar guidelines advocating for close monitoring and treatment of a broader group than strictly necessary, we can turn to other fields in ophthalmology.For example, ocular hypertension is treated even though the risk of developing glaucoma is only around 11%50。
Myopia is a common condition whose prevalence is on the rise and affecting younger populations51。In the pediatric population, myopia can impact quality of life and increase the risk of ocular morbidities later in life1,,,,2,,,,3,,,,4,,,,5。Our models aim to identify pre-myopic patients early, enabling timely intervention that may prevent or delay the onset of myopia and thereby reduce the likelihood of future complications4。
Over the past two decades, significant efforts have been directed towards discovering effective strategies to reduce the incidence of myopia.Among these, the use of diluted atropine eye drops has been the focus of many studies52and has become common practice in many parts of the world12,,,,13,,,,14,,,,16。This treatment has been shown to be successful to different degrees, but it does not eliminate myopia or stop progression completely.Even in studies that showed success, only a 50% success rate was achieved.In recent years, contact lenses and specially designed spectacle lenses were developed to try and address lower myopia progression.Here again, the success rate reported was around 50%15。Given this, the more aggressive caregivers advocate for treating children who are considered “pre-myopic†with atropine eye drops to prevent the development of myopia altogether14in addition to traditional behavioral recommendations53。
Several studies have sought to predict myopia development in children and establish links with key risk factors54including genetic predisposition, environmental influences, behavioral patterns, obstetric history, and existing comorbidities.O’Donoghue et al.55applied logistic regression to analyze associations between childhood myopia and various risk factors, including age, sex, body size, socioeconomic deprivation, parental myopia, and near work.However, they did not develop a formal predictive model or report AUC values.As a result, while their findings highlight critical risk factors for myopia onset, they do not offer a quantitative framework for individual risk prediction.This underscores the need for more advanced predictive models that not only identify risk factors but also offer actionable tools for early detection and intervention.
Zadnik et al.28showed that spherical equivalent was the single best predictive factor for myopia development.Here a discrete time survival analysis was used to design the prediction model.While discrete-time survival analysis provides valuable insights into time-dependent risk estimation, it may not capture complex, non-linear interactions between variables as effectively as machine learning (ML) approaches.
A recent study by Muti et al.25also employed discrete-time survival analysis to predict the onset of myopia using variables such as cycloplegic autorefraction, keratometry, ultrasonography, and parental myopia.Model performance was evaluated using the Concordance index, which assesses the discriminatory ability of the model but is not directly comparable to AUC used in machine learning binary classification models.The study highlights the utility of traditional statistical methods for estimating the probability of myopia onset based on known clinical variables.The results are good and show a high predictive rate (0.92).However, it does not incorporate more advanced machine learning techniques, which may capture complex interactions between risk factors more effectively.
Other studies have attempted to refine myopia prediction using different methodologies.刘等。37used Cox proportional hazard regression to develop a model for predicting myopia and pre-myopia in young children.They used ocular biometric parameters, including axial length and corneal curvature that were measured by IOL Master.Their results found that ocular axial length and corneal curvature examinations might prospectively help identify children susceptible to myopia.Wong et al.27used multivariable logistic regression to predict myopia onset in Chinese children, considering non-cycloplegic refraction, parental myopia, axial length, and relative accommodation.The model achieved an AUC of 0.74, which is lower than more recent machine learning-based approaches.The study demonstrates that incorporating multiple biological and familial factors can provide moderate predictive power for myopia onset.However, the reliance on non-cycloplegic refraction, which is less accurate than cycloplegic measurements, and the relatively modest AUC suggest that more sophisticated modeling techniques and additional variables could improve predictive accuracy.Saw et al.26used multiple linear regression models to analyze biometric changes in myopic children, focusing on axial length, anterior chamber depth, lens thickness, and vitreous chamber depth.The study reported a Concordance index of 0.91 but was limited to a one-year prediction window.The study underscores the importance of axial length and other biometric factors in myopia progression.Based on these studies tools have been developed that are now being marketed to try and help predict myopia progression54。Mutti et al.40investigated the predictive value axial length for future myopia development.The study suggests axial length changes have limited predictive value for determining future myopia risk.
Zhao等。36developed machine learning models using 15 years of cycloplegic refraction data from over 88,000 Chinese children to predict spherical equivalent (SE), myopia onset, and high myopia progression.Their approach leveraged data from two time points, specifically, SE measurements from the first and second visits, along with the annual myopia progression rate (AMPR) derived between these visits.While such longitudinal data are often available in tertiary care centers, our models take a different approach by relying solely on data from a single clinical visit.This makes our models more accessible and easier to implement in routine pediatric ophthalmology settings, particularly in community-based practices where long-term follow-up or specialized equipment may not be available.Despite this simplification, our models demonstrate strong predictive performance, highlighting their practical utility for early risk assessment and intervention.
Existing myopia prediction models have certain limitations.Some models are tailored to specific ethnic groups37,,,,38while others depend on measurements that may not be feasible in routine clinical practice26,,,,27,,,,36,,,,56。Additionally, many rely on traditional analytical methods26,,,,27,,,,55that may not fully capture complex interactions among predictive factors.In contrast, our approach builds on well-established risk factors for myopia, while also exploring previously unexamined variables to identify intricate interactions.By leveraging machine learning (ML), our models offer a more comprehensive predictive framework, uncovering relationships that conventional methods might overlook.Furthermore, the study was conducted in a country with a population characterized by substantial ethnic, cultural, and religious diversity.This diversity, combined with consistent access to care, makes the setting particularly suitable for studying pediatric eye health in a heterogeneous population and may enhance the relevance and comparability of the findings to other multi-ethnic or multicultural populations.
Our study introduces an ML-based tool that predicts myopia onset using data from routine pediatric eye exams, enhancing early risk detection without requiring specialized equipment.While the current model relies solely on standard eye examination results, its predictive accuracy could be improved by incorporating additional data, such as free-text obstetric histories, medical records, and family background.Moreover, since our dataset originates from a single clinic and examiner, future research will expand the study to multiple sources and extend follow-up periods to assess long-term model performance and precision.
This approach not only improves myopia risk assessment but also highlights AI’s transformative potential in preventive eye care.By integrating a broader spectrum of patient information, the tool promises a more comprehensive evaluation of risk factors, facilitating targeted interventions.Ultimately, this advancement represents a significant step toward proactive myopia management, aiming to reduce its prevalence and associated visual impairments through early and personalized care strategies.
数据可用性
The datasets analyzed during the current study are not publicly available due to ethics committee instructions but are available from the corresponding author upon reasonable request.
参考
Praveen, M. R., Vasavada, A. R., Jani, U. D., Trivedi, R. H. & Choudhary, P. K. Prevalence of cataract type in relation to axial length in subjects with high myopia and emmetropia in an Indian population.是。J. Ophthalmol。 145, 176–181e1 (2008).
PubMed一个 Google Scholar一个
Ha, A., Kim, C. Y., Shim, S. R., Chang, I. B. & Kim, Y. K. Degree of myopia and glaucoma risk: A Dose-Response Meta-analysis.是。J. Ophthalmol。 236, 107–119 (2022).
PubMed一个 Google Scholar一个
Leveziel, N. et al.Prevalence of macular complications related to myopia – Results of a multicenter evaluation of myopic patients in eye clinics in France.Acta Ophthalmol. 98, e245–e251 (2020).
PubMed一个 Google Scholar一个
Haarman, A. E. G. et al.The complications of myopia: A review and Meta-Analysis.Investig Ophthalmol.VIS。科学。 61, 49 (2020).
Recko, M. & Stahl, E. D. Childhood myopia: epidemiology, risk factors, and prevention.Mo Med. 112, 116–121 (2015).
Grzybowski, A., Kanclerz, P., Tsubota, K., Lanca, C. & Saw S.-M.A review on the epidemiology of myopia in school children worldwide.BMC Ophthalmol. 20, 27 (2020).
Wolffsohn, J. S., Whayeb, Y., Logan, N. S., Weng, R. & Group, I. M. I. A. IMI—Global trends in myopia management attitudes and strategies in clinical Practice—2022 update.Investig Ophthalmol.VIS。科学。 64, 6 (2023).
Lingham, G. et al.Time spent outdoors in childhood is associated with reduced risk of myopia as an adult.科学。代表。 11, 6337 (2021).
CAS一个 PubMed一个 PubMed Central一个 Google Scholar一个
Zhang, L. et al.Association between time spent outdoors and myopia among junior high school students.药品 99, e23462 (2020).
Pärssinen, O. & Kauppinen, M. Risk factors for high myopia: a 22-year followâ€up study from childhood to adulthood.Acta Ophthalmol. 97, 510–518 (2019).
PubMed一个 Google Scholar一个
Wu, P. C., Tsai, C. L., Wu, H. L., Yang, Y. H. & Kuo, H. K. Outdoor activity during class recess reduces myopia onset and progression in school children.眼科 120, 1080–1085 (2013).
PubMed一个 Google Scholar一个
Chia, A., Lu, Q. S. & Tan, D. Five-Year clinical trial on Atropine for the treatment of myopia 2 myopia control with Atropine 0.01% Eyedrops.眼科 123, 391–399 (2016).
PubMed一个 Google Scholar一个
Fang, P. C., Chung, M. Y., Yu, H. J. & Wu, P. C. Prevention of myopia onset with 0.025% Atropine in premyopic children.J. Ocul Pharmacol.ther。 26, 341–345 (2010).
CAS一个 PubMed一个 Google Scholar一个
Yam, J. C. et al.Effect of Low-Concentration Atropine Eyedrops vs placebo on myopia incidence in children.贾马 329, 472–481 (2023).
CAS一个 PubMed一个 PubMed Central一个 Google Scholar一个
Prousali, E. et al.Efficacy and safety of interventions to control myopia progression in children: an overview of systematic reviews and meta-analyses.BMC Ophthalmol. 19, 106 (2019).
Zadnik, K. et al.Efficacy and safety of 0.01% and 0.02% Atropine for the treatment of pediatric myopia progression over 3 years.JAMA Ophthalmol. 141, 990–999 (2023).
Vincent, S. J. et al.CLEAR - Orthokeratology.Contact Lens Anterior Eye。44, 240–269 (2021).
PubMed一个 Google Scholar一个
Malinowski, A. et al.A clinical study of the impact of soft contact lenses on the progression of myopia in young patients.临床Ophthalmol.(Auckl NZ)。16, 51–62 (2022).Google Scholar
一个 Lanca, C., Repka, M. X. & Grzybowski, A. Topical review: studies on management of myopia progression from 2019 to 2021.
Optom.VIS。科学。 100, 23–30 (2023).
PubMed一个 Google Scholar一个
Reid, J. E. & Eaton, E. Artificial intelligence for pediatric ophthalmology.Curr。意见。Ophthalmol. 30, 337–346 (2019).
PubMed一个 Google Scholar一个
Moraru, A. D., Costin, D., Moraru, R. L. & Branisteanu, D. C. Artificial intelligence and deep learning in ophthalmology - present and future (Review).经验。ther。医学 20, 3469–3473 (2020).
Bini, S. A., Artificial Intelligence, M. & Learning Deep learning, and cognitive computing: what do these terms mean and how will they impact health care??J. Arthroplast。33, 2358–2361 (2018).Google Scholar
一个 Yu, K. H., Beam, A. L. & Kohane, I. S. Artificial intelligence in healthcare.
纳特。生物。工程。 2, 719–731 (2018).
PubMed一个 Google Scholar一个
Jiang, F. et al.Artificial intelligence in healthcare: past, present and future.Stroke Vasc Neurol. 2, 230 (2017).
Mutti, D. O. et al.Predicting the onset of myopia in children by age, sex, and ethnicity: results from the CLEERE study.Optom.VIS。科学。 101, 179–186 (2024).
Saw, S. M. et al.Eye growth changes in myopic children in Singapore.br。J. Ophthalmol。 89, 1489 (2005).
CAS一个 PubMed一个 PubMed Central一个 Google Scholar一个
Wong, Y. L. et al.Prediction of myopia onset with refractive error measured using non-cycloplegic subjective refraction: the WEPrOM study.BMJ开放。Ophthalmol. 6, e000628 (2021).
广告一个 PubMed一个 PubMed Central一个 Google Scholar一个
Zadnik, K. et al.Prediction of Juvenile-Onset myopia.JAMA Ophthalmol. 133, 683–689 (2015).
Du, X. L., Li, W. B. & Hu, B. J. Application of artificial intelligence in ophthalmology.int。J. Ophthalmol。 11, 1555–1561 (2018).
Rahimy, E. Deep learning applications in ophthalmology.Curr。意见。Ophthalmol. 29, 254–260 (2018).
PubMed一个 Google Scholar一个
Scruggs, B. A., Chan, R. V. P., Kalpathy-Cramer, J., Chiang, M. F. & Campbell, J. P. Artificial intelligence in retinopathy of prematurity diagnosis.Transl Vis.科学。技术。 9, 5 (2020).
Murali, K., Krishna, V., Krishna, V. & Kumari, B. Application of deep learning and image processing analysis of photographs for amblyopia screening.Indian J. Ophthalmol. 68, 1407–1410 (2020).
Liu, X. et al.Localization and diagnosis framework for pediatric cataracts based on slit-lamp images using deep features of a convolutional neural network.PLOS一个。12, e0168606 (2017).
Cibis, G. W. Video vision development assessment (VVDA): combining the Brückner test with eccentric photorefraction for dynamic identification of amblyogenic factors in infants and children.反式。是。Ophthalmol.Soc。 92, 643–685 (1994).
CAS一个 PubMed一个 PubMed Central一个 Google Scholar一个
Brown, J. M. et al.Automated diagnosis of plus disease in retinopathy of prematurity using deep convolutional neural networks.JAMA Ophthalmol. 136, 803–810 (2018).
Zhao, J. et al.Development and validation of predictive models for myopia onset and progression using extensive 15-year refractive data in children and adolescents.J. Transl Med. 22, 289 (2024).
Liu, L. et al.Prediction of premyopia and myopia in Chinese preschool children: a longitudinal cohort.BMC Ophthalmol. 21, 283 (2021).
CAS一个 PubMed一个 PubMed Central一个 Google Scholar一个
Lin, H. et al.Prediction of myopia development among Chinese school-aged children using refraction data from electronic medical records: A retrospective, multicentre machine learning study.PLoS Med. 15, e1002674 (2018).
Tang, T. et al.A machine learning-based algorithm used to estimate the physiological elongation of ocular axial length in myopic children.Eye Vis. 7, 50 (2020).
Mutti, D. O. et al.The limited value of prior change in predicting future progression of Juvenile-onset myopia.Optom.VIS。科学。 99, 424–433 (2022).
Muralidharan, A. R. et al.Light and myopia: from epidemiological studies to Neurobiological mechanisms.ther。ADV。Ophthalmol. 13, 25158414211059250 (2021).
Scikit-learn Machine Learning in Python.https://scikit-learn.org/stable/
Imani, M., Beikmohammadi, A. & Arabnia, H. R. Comprehensive analysis of random forest and XGBoost performance with SMOTE, ADASYN, and GNUS under varying imbalance levels.技术 13, 88 (2025).
Breiman, L. Random forests.马赫。学习。 45, 5–32 (2001).
Biau, G. & Scornet, E. A random forest guided tour.测试 25, 197–227 (2016).
MathScinet一个 数学一个 Google Scholar一个
Natekin, A. & Knoll, A. Gradient boosting machines, a tutorial.正面。Neurorobotics。7, 21 (2013).Google Scholar
一个 Scikit-learn.
org。Feature importances with a forest of trees.https://scikit-learn.org/stable/auto_examples/ensemble/plot_forest_importances.html
Wang, J., Xu, M., Wang, H. & Zhang, J. Classification of Imbalanced Data by Using the SMOTE Algorithm and Locally Linear Embedding.8th Int.conf。信号过程。3, 1–4 (2006).3, 1–4 (2006).(2006)。
Berrar, D. Encyclopedia of Bioinformatics and Computational Biology.546–560 (2019).https://doi.org/10.1016/b978-0-12-809633-8.20351-8
Kass, M. A. et al.The ocular hypertension treatment study: A randomized trial determines that topical ocular hypotensive medication delays or prevents the onset of primary Open-Angle glaucoma.拱。Ophthalmol. 120, 701–713 (2002).
PubMed一个 Google Scholar一个
Holden, B. A. et al.Global prevalence of myopia and high myopia and Temporal trends from 2000 through 2050.眼科 123, 1036–1042 (2016).
PubMed一个 Google Scholar一个
Loughman, J. et al.Myopia outcome study of Atropine in children: Two-year result of daily 0.01% Atropine in a European population.Acta Ophthalmol. 102, e245–e256 (2024).
CAS一个 PubMed一个 Google Scholar一个
Jonas, J. B. et al.IMI prevention of myopia and its progression.Investig Ophthalmol.VIS。科学。 62, 6 (2021).
Gifford, K. L. et al.IMI – Clinical management guidelines report.Investig Opthalmology Vis.科学。 60, M184 (2019).
O’Donoghue, L. et al.Risk factors for childhood myopia: findings from the NICER study.Investig Ophthalmol.VIS。科学。 56, 1524–1530 (2015).
Zadnik, K. et al.Ocular predictors of the onset of juvenile myopia.Investig Ophthalmol.VIS。科学。 40, 1936–1943 (1999).
CAS一个 Google Scholar一个
道德声明
竞争利益
作者没有宣称没有竞争利益。
道德认可
Due to the retrospective nature of the study, the Helsinki committee at Rambam Health Care Campus, Haifa, Israel (RMB-D-0653-21) waived the need of obtaining informed consent.
附加信息
Publisher’s note
Springer Nature remains neutral with regard to jurisdictional claims in published maps and institutional affiliations.
权利和权限
开放访问This article is licensed under a Creative Commons Attribution-NonCommercial-NoDerivatives 4.0 International License, which permits any non-commercial use, sharing, distribution and reproduction in any medium or format, as long as you give appropriate credit to the original author(s) and the source, provide a link to the Creative Commons licence, and indicate if you modified the licensed material.您没有根据本许可证的许可来共享本文或部分内容的改编材料。The images or other third party material in this article are included in the article’s Creative Commons licence, unless indicated otherwise in a credit line to the material.If material is not included in the article’s Creative Commons licence and your intended use is not permitted by statutory regulation or exceeds the permitted use, you will need to obtain permission directly from the copyright holder.To view a copy of this licence, visithttp://creativecommons.org/licenses/by-nc-nd/4.0/。重印和权限
引用本文

Ron, Y., Ron, T., Fridman, N.
等。Predicting onset of myopic refractive error in children using machine learning on routine pediatric eye examinations only.Sci Rep15 , 30055 (2025).https://doi.org/10.1038/s41598-025-13990-5
已收到:
公认:
出版:
doi:https://doi.org/10.1038/s41598-025-13990-5