
Machine learning analysis reveals tumor heterogeneity and stromal-immune niches in breast cancer
作者:Li, Jun
Introduction
Breast cancer (BRCA) remains the most prevalent and lethal malignancy affecting women worldwide. As of 2020, it accounted for approximately 2.3 million new cases and 685,000 deaths globally, representing 24.5% of all new cancer diagnoses and 15.5% of all cancer-related deaths among women1. In the United States, BRCA has become the most commonly diagnosed cancer among women, with projections indicating it will constitute the largest number of new cancer cases across all types by 2023. It currently accounts for 31% of all female cancer diagnoses and ranks as the second leading cause of cancer-related mortality in women1,2. Clinically, breast cancer is stratified into distinct molecular subtypes—including Luminal A, Luminal B, HER2-enriched, and triple-negative—based on the expression patterns of estrogen receptor (ER), progesterone receptor (PR), human epidermal growth factor receptor 2 (HER2), and the proliferation marker Ki-67. These classifications are critical for guiding treatment decisions, as they reflect the disease’s inherent heterogeneity and complexity—factors that continue to pose major challenges despite significant therapeutic advancements3,4,5,6. Current standard treatments consist of surgical resection, radiation therapy, and endocrine therapy, often combined with neoadjuvant chemotherapy and targeted agents in high-risk patients. However, issues such as therapy resistance, tumor recurrence, and distant metastasis remain substantial barriers to long-term disease control7. In addition to therapeutic limitations, current diagnostic methodologies also exhibit notable shortcomings. Immunohistochemistry (IHC), although widely used for subtype classification, is limited by its invasiveness, interpretive variability, and suboptimal suitability for certain patient populations8,9. While gene expression profiling—such as PAM50-based intrinsic subtyping—offers enhanced molecular resolution, its clinical implementation is constrained by high costs and logistical hurdles9. Nevertheless, several prognostic gene signatures have recently been introduced into clinical practice, offering potential to improve diagnostic accuracy, risk stratification, and personalized treatment planning10,11. These advances underscore the urgent need for robust and accessible biomarkers to enhance early detection and clinical management of BRCA, aiming to alleviate its global health burden.
A growing body of evidence highlights the tumor microenvironment (TME) as a critical determinant of breast cancer progression, therapeutic resistance, and metastasis. The TME comprises a complex cellular milieu—including stromal, immune, and vascular cells—that is dynamically shaped by tumor-secreted cytokines, chemokines, and growth factors. These factors not only recruit surrounding cell populations but also reprogram their functions to promote a tumor-supportive niche3,12,13. This intricate microenvironment modulates cancer behavior, alters drug responsiveness, and contributes to immune evasion.
Among the various components of the TME, cancer-associated fibroblasts (CAFs) and tumor-associated neutrophils (TANs) play particularly pivotal roles. CAFs actively remodel the extracellular matrix, secrete pro-tumorigenic factors, and facilitate angiogenesis, thereby promoting tumor growth and metastatic potential14. TANs exhibit functional plasticity and can polarize into either pro-inflammatory/anti-tumorigenic or anti-inflammatory/pro-tumorigenic phenotypes in response to the surrounding cytokine milieu. Their direct interactions with cancer cells can induce the expression of oncostatin M (OSM), which—despite its antiproliferative role in certain contexts—has been implicated in promoting angiogenesis and metastasis in BRCA15,16.
Additionally, tumor-associated macrophages (TAMs) are strongly associated with poor prognosis and adverse clinical outcomes in breast cancer. TAMs support immune suppression, tumor growth, angiogenesis, and metastatic dissemination. Notably, they can also be recruited in response to chemotherapy, where they contribute to a pro-metastatic TME that undermines therapeutic efficacy17,18. These multifaceted interactions within the TME underscore the importance of developing therapeutic strategies that target not only tumor-intrinsic factors but also the supportive and adaptive components of the microenvironment.
In this study, we systematically investigated the multicellular ecosystem of breast cancer using single-cell and spatial transcriptomics. Our aim was to delineate cellular heterogeneity within the TME, uncover regulatory interactions, and identify candidate biomarkers for improved diagnosis and early intervention in breast cancer.
Results
Comprehensive single-cell atlas reveals cellular composition of the brca tumor microenvironment
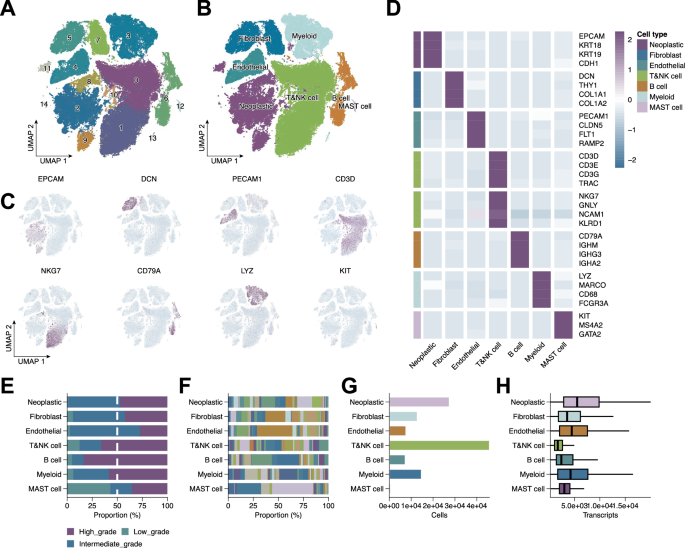
To dissect the cellular heterogeneity of BRCA, we performed scRNA-seq analysis, followed by unsupervised clustering and dimensionality reduction. This revealed 15 transcriptionally distinct cell clusters (Fig. 1A), with UMAP visualization delineating clear separation among major cell types (Fig. 1B). Cluster annotation based on canonical marker genes identified neoplastic epithelial cells (EPCAM, KRT18, KRT19, CDH1), fibroblasts (DCN, THY1, COL1A1, COL1A2), endothelial cells (PECAM1, CLDN5, FLT1, RAMP2), T cells (CD3D, CD3E, CD3G, TRAC), NK cells (NKG7, GNLY, NCAM1, KLRD1), B cells (CD79A, IGHM, IGHG3, IGHA2), myeloid cells (LYZ, MARCO, CD68, FCGR3A), and mast cells (KIT, MS4A2, GATA2) (Fig. 1D). Dot plots confirmed distinct marker gene expression per cluster (Fig. 1C), validating the annotation. Additional analyses characterized tumor grade distribution (Fig. 1E), patient contribution to each cluster (Fig. 1F), cell abundance (Fig. 1G), and total transcript counts (Fig. 1H), collectively delineating the BRCA TME.

A UMAP plot showing unsupervised clustering of all single cells, identifying 15 transcriptionally distinct clusters. B UMAP visualization of annotated major cell types. C UMAP feature plots showing expression of representative marker genes. D Heatmap displaying scaled expression of selected canonical marker genes across identified cell clusters. E Tumor grade distribution across cell types. F Contribution of individual patients to each cluster. G Relative abundance of each cell type. H Total transcript counts per cell type.
Stromal and myeloid subtypes exhibit distinct functional programs and grade-associated patterns
To refine characterization of stromal and myeloid cells, we extracted endothelial cells, fibroblasts, and myeloid populations and performed secondary clustering, identifying eight endothelial, ten fibroblast, and ten myeloid subclusters (Fig. 2B–D). Marker gene analysis revealed functional diversity (Fig. 2E, F). Fibroblast subsets expressing MYH11 were annotated as vascular smooth muscle cells (VSMCs), while those enriched in PDGFRA were identified as CAFs. Functional enrichment analyses of fibroblast subtypes revealed distinct biological roles (Fig. 2G–J). Notably, CAFs were enriched in low-grade tumors, implicating their involvement in early tumorigenesis (Fig. 2K, L).

A UMAP visualization of annotated major cell types. B–D UMAP plots of endothelial, fibroblast, and myeloid subclusters. E, F UMAP feature plots of representative marker genes per subcluster. G Feature plots showing expression of MYH11 and PDGFRA, used to identify VSMC and CAF, respectively. H Heatmap of functional enrichment scores for the ten fibroblast subclusters. I UMAP plot highlighting CAFs, pericytes, and VSMCs among the fibroblast compartment. J Bar plots of functional enrichment terms for highly variable genes in CAF and VSMC subclusters. K Proportional distribution of the ten fibroblast subclusters across low-, intermediate-, and high-grade tumors. L Tumor grade-specific abundance of CAFs, pericytes, and VSMCs visualized as grouped bar plots.
Spatial transcriptomics uncovers region-specific cell distribution and tumor-grade associations
We integrated spatial transcriptomic data from nine BRCA samples. CNV inference and cell-type deconvolution via inferCNV and CARD enabled tumor/non-tumor classification. A comprehensive spatial panel was generated for each sample, including H&E staining, CNV scores, cell-type composition, and cluster maps (Fig. 3A). Tumor and non-tumor cells formed five and three transcriptional subtypes, respectively (Fig. 3B–E), each with unique CNV and marker gene signatures. Spatial mapping showed tumor- and immune-enriched zones, with high-grade tumors displaying greater tumor cell density and intermediate-grade tumors showing higher immune cell content (Fig. 3F, G).

A Overview of spatial transcriptomics workflow integrating H&E imaging, CNV inference, and cell type deconvolution. B Heatmap of differentially expressed genes across five transcriptional subtypes of tumor cells. C t-SNE plots of tumor cell regions showing subclusters, inferred CNV scores, and deconvolved cell types. D Heatmap of differentially expressed genes across three transcriptional subtypes of non-tumor cells. E t-SNE plots of non-tumor cell regions displaying subclusters, CNV scores, and cell-type annotations. F Spatial maps showing the distribution of neoplastic cells, fibroblasts, endothelial cells, T/NK cells, B cells, myeloid cells, and mast cells in the BRCA2 spatial transcriptomics sample. G Heatmap depicting differences in cell-type composition across low-, intermediate-, and high-grade tumors in spatial transcriptomic data.
Tumor epithelial subpopulations exhibit transcriptional and developmental heterogeneity
Focusing on neoplastic epithelial cells, we identified seven transcriptionally distinct tumor subpopulations (Fig. 4A). SCGB2A2+ cells were preferentially enriched in low- and intermediate-grade tumors, but depleted in high-grade samples. These cells expressed SCGB2A2, PIP, TFF1, and AGR2, indicating luminal and secretory differentiation (Fig. 4B). Functional enrichment revealed distinct pathway associations (Fig. 4C). Pseudotime analysis suggested SCGB2A2+ cells occupy early differentiation states (Fig. 4D–G), with gene dynamics along the trajectory further supporting this (Fig. 4E, H).

A UMAP plot showing seven transcriptionally distinct subclusters of neoplastic epithelial cells. B Heatmap displaying marker gene expression across the seven tumor epithelial subpopulations. C Bubble plot showing Gene Ontology Biological Process (GOBP) enrichment analysis of differentially expressed genes among tumor subclusters. D Ridge plot showing pseudotime distribution of epithelial tumor cells, indicating dynamic transcriptional transitions. E Heatmap of gene expression dynamics along the pseudotime trajectory. F Pseudotime trajectory graph revealing bifurcating lineage paths among tumor epithelial cells. G Bar plot showing the proportion of each epithelial subpopulation across five inferred pseudotime states. H Scatter plots of selected genes (MITF, KIT, VIM, CCL2, C1R, STAT3) showing expression trends along pseudotime.
SCGB2A2+ neoplastic cells display distinct lipid metabolism and spatial localization
SCGB2A2+ tumor cells were enriched in low-grade tumors (Fig. 5A). Differential expression and MSigDB-based scoring revealed heightened lipid metabolic activity in these cells (Fig. 5B, C). Spatial expression of HOXB2 and fatty acid metabolism signatures confirmed localized enrichment (Fig. 5D, E), suggesting a unique metabolic phenotype associated with early-stage BRCA.

A Bar plot showing enrichment of SCGB2A2⁺ tumor cells across different tumor grades. B Heatmap of differentially expressed genes between SCGB2A2⁺ and non-SCGB2A2⁺ NEO cells. C Heatmap showing lipid metabolism-related pathway signature scores comparing SCGB2A2⁺ and non-SCGB2A2⁺ NEO cells. D Spatial maps of three spatial transcriptomics samples displaying expression of HOXB2 and fatty acid metabolism signature scores. E Violin plots showing the distribution of ABNORMAL_CIRCULATING_FATTY_ACID_CONCENTRATION and FATTY_ACID_BETA_OXIDATION pathway scores across four BRCA spatial transcriptomics samples (BRCA_1142243F, BRCA_CID4290, BRCA_CID4465, and BRCA0).
T and B lymphocyte subsets define immune landscape and relate to tumor grade and prognosis
Clustering of T and B lymphocytes identified 19 immune subpopulations (Fig. 6A, B). Low-grade tumors exhibited enrichment of CPB1 + CD4 + T cells (Fig. 6C). Differential expression and functional analysis revealed heterogeneity in cytokine signaling and cytotoxicity (Fig. 6D–G). Notably, C2 (GNLY + NKT) and C5 (IL7R + CD8 + ) cells displayed opposing functional signatures and were associated with differential cytotoxic and exhaustion scores (Fig. 6H). Lower C5 infiltration correlated with worse prognosis in TCGA-BRCA (Fig. 6I).

A UMAP plot showing 19 transcriptionally distinct T and B lymphocyte clusters. B Feature plots of representative marker genes used for lymphocyte subcluster annotation. C Bar plot showing the relative abundance of the 19 lymphocyte clusters across low-, intermediate-, and high-grade BRCA tumors. D Heatmap of immune-related gene expression across the 19 lymphocyte clusters, highlighting functional diversity. E Bar plot showing the grade-specific abundance of cluster C5 (IL7R⁺ CD8⁺ T cells). F Ridge plots displaying the expression of cytotoxic effector genes (GZMB, GZMH, PRF1, GNLY) in CD8⁺ T cell subsets. G Volcano plots of differentially expressed genes across selected lymphocyte subpopulations. H Violin plots comparing cytotoxicity and exhaustion scores among CD8⁺ T cell subtypes. I Kaplan–Meier survival analysis showing prognosis stratification based on C5 (IL7R⁺ CD8⁺) T cell abundance (high vs. low) using TCGA-BRCA data.
Myeloid subtypes exhibit divergent immunoregulatory programs and polarization states
Reclustering of myeloid cells yielded 12 subpopulations with distinct transcriptional and functional profiles (Fig. 7A–D). Pathway enrichment revealed diversity in immune modulation and inflammation (Fig. 7C). Low-grade tumors harbored a higher proportion of C1 cells (Fig. 7E). Pseudotime and polarization analyses showed bifurcated differentiation paths, with C3 enriched for M1 and C5 for M2 polarization (Fig. 7F–H).

A UMAP plot showing 12 transcriptionally defined myeloid cell subpopulations, including monocytes, macrophages, and dendritic cells. B Feature plots displaying the expression of representative marker genes across myeloid subclusters. C Heatmap of hallmark gene set enrichment scores across the 12 myeloid subtypes, illustrating functional heterogeneity. D Volcano plots of differentially expressed genes among selected myeloid subtypes. E Pie charts showing the distribution of each myeloid subtype across low-, intermediate-, and high-grade tumors. F Pseudotime trajectory analysis of macrophage differentiation states, suggesting bifurcating lineage paths. G UMAP plots showing the distribution of M1 and M2 macrophage signature scores across myeloid subclusters. H Violin plots comparing M1 and M2 polarization scores among the identified macrophage subpopulations.
Stromal subtypes demonstrate histology-dependent distributions and spatial localization
Reclustering stromal cells identified 14 subtypes (Fig. 8A), including CAFs, iCAFs, myoCAFs, and multiple endothelial lineages (Fig. 8D). Subtypes showed grade-specific distributions (Fig. 8B, C) and distinct gene signatures (Fig. 8E). Integration with spatial data demonstrated spatially compartmentalized stromal populations across histological subtypes (Fig. 8F).

A UMAP plot showing reclustering of stromal cells into 14 transcriptionally distinct subtypes. B UMAP plots of the 14 stromal subtypes stratified by tumor grade (low, intermediate, high). C Bar plot showing the proportional abundance of each stromal subtype across tumor grades. D Feature plots displaying expression of representative marker genes. E Heatmap of differentially expressed genes among the 14 stromal subtypes. F Spatial maps from spatial transcriptomics samples showing the localized distribution of fibroblasts and endothelial cells within tumor tissues.
Fibroblast subtype F3 associates with low-grade tumors and favors prognosis
Focused reclustering of fibroblasts identified subtype F3 as enriched in low-grade tumors (Supplementary Fig. 1A, B). EEF1A1 was overexpressed in high-grade fibroblasts and associated with better survival in TCGA-BRCA (Supplementary Fig. 1C, D). ssGSEA scoring and survival analysis revealed favorable prognosis in patients with low-grade-associated fibroblast gene expression (Supplementary Fig. 1E, F).
Low-grade-enriched stromal and immune subtypes engage in conserved ligand-receptor signaling
We identified F3_CXCR4 (fibroblast), M1_IGKC (myeloid), and E4_CLU (endothelial) as low-grade-enriched subtypes. NicheNet analysis predicted ligand-receptor signaling from these cells to the broader TME (Supplementary Fig. 2A–C), and shared ligands were identified (Supplementary Fig. 2D). CellChat analysis quantified signaling flux and directionality (Supplementary Fig. 2E–G), highlighting conserved ligand-receptor interactions among these subtypes (Supplementary Fig. 2F–H).
Spatial mapping validates localization of low-grade-enriched functional subtypes
Using spatial transcriptomic data, we validated the distribution of CLU, CXCR4, and IGKC as markers of E4_CLU, F3_CXCR4, and M1_IGKC, respectively (Supplementary Fig. 3A–C). CellTrek mapping confirmed spatial compartmentalization of these subtypes within tumor tissues (Supplementary Fig. 3D), supporting their biological relevance in early-stage BRCA.
Bulk RNA-Seq analysis confirms clinical relevance of low-grade-enriched subtypes
To validate the presence and clinical relevance of low-grade-enriched stromal-immune populations, we performed bulk RNA-seq deconvolution on TCGA-BRCA using BisqueRNA with our single-cell dataset as reference. This revealed the proportional abundance of major cell types—including five endothelial, seven fibroblast, and nine myeloid subtypes—alongside neoplastic, mast, and T/NK cells (Supplementary Fig. 4A). Focusing on three low-grade-enriched populations—F3_CXCR4 fibroblasts, M1_IGKC myeloid cells, and E4_CLU endothelial cells—we calculated a composite Score representing their summed abundance. This Score stratified tumors along clinical staging dimensions. Notably, patients with M0 status predominantly exhibited high Scores, while M1 patients (indicating metastasis) showed mostly low Scores, suggesting these cell types are depleted in metastatic disease (Supplementary Fig. 4B, left). Similarly, T1-stage patients (early primary tumors) were mainly enriched for high Scores, whereas T2–T4 stages were associated with low Scores, indicating reduced abundance of these stromal-immune populations in more advanced tumors (Supplementary Fig. 5B, right). Boxplot comparisons confirmed a significant inverse association between Score (and individual subtype abundance) and both pT and pM stages (Supplementary Fig. 4C). Further analyses revealed functional and molecular implications of this stratification: gene ontology analysis of tumors with high vs. low Scores showed enrichment for immune signaling and stromal remodeling pathways in high-Score samples (Supplementary Fig. 4D). Unsupervised clustering (k = 5) of TCGA-BRCA samples based on deconvolved subtype signatures revealed five molecular subgroups with distinct expression profiles (Supplementary Fig. 4E). Spatial transcriptomics via CARD further validated the localization of these cell types in tumor sections (Supplementary Fig. 4F), supporting their biological relevance in shaping the low-grade tumor microenvironment.
Enhanced CCL5 signaling and abundance of low-grade subtypes define low-grade tumor ecosystem
We observed greater T/NK cell abundance in low-grade tumors (Supplementary Fig. 5A). CellChat analysis revealed enhanced communication—particularly CCL5 signaling—between immune cells and low-grade-enriched subtypes in low-grade tumors (Supplementary Fig. 5B, C). Quantification confirmed enrichment of F3_CXCR4, M1_IGKC, and E4_CLU in low-grade tumors (Supplementary Fig. 5D–G).
Low-grade-enriched subtypes correlate with immunotherapy
Despite being enriched in low-grade tumors, the identified subtypes appeared paradoxically linked to immunotherapy non-responsiveness. Using the TIDE algorithm, we found that higher expression of CLU (E4_CLU marker) and CXCR4 (F3_CXCR4 marker) was significantly associated with predicted non-responder status (Supplementary Fig. 6A, B). Moreover, tumors with higher composite Scores—enriched in these low-grade-associated subtypes—also showed reduced predicted response to immune checkpoint blockade (Supplementary Fig. 6C). Further comparison between predicted responders and non-responders revealed significantly greater abundance of F3_CXCR4 fibroblasts, M1_IGKC myeloid cells, and E4_CLU endothelial cells in the non-responder group (Supplementary Fig. 6D–F).
Cell–cell communication networks reveal grade-specific signaling pathways in BRCA
To further dissect how intercellular signaling evolves with tumor progression, we mapped global ligand–receptor networks across tumor grades. High-grade tumors exhibited broader and more complex signaling connectivity compared to low-grade ones (Supplementary Fig. 7A, B). We identified MDK signaling as a major pathway upregulated in high-grade tumors, primarily secreted by fibroblasts and tumor epithelial cells (Supplementary Fig. 7C), potentially promoting proliferation and angiogenesis. Similarly, Galectin signaling—predominantly produced by myeloid and mast cells—was also enhanced in high-grade tumors (Supplementary Fig. 7D). Spatial transcriptomic analysis revealed differential expression of LGALS9-CD44 and LGALS9-HAVCR2 ligand–receptor pairs across tumor sections (Supplementary Fig. 7E), suggesting that Galectin-9–mediated signaling may facilitate immune suppression in advanced BRCA.
Discussion
In this study, we constructed a comprehensive multi-omic atlas delineating the cellular heterogeneity and spatial architecture of the breast cancer TME across tumor grades. Our integrative analysis combining single-cell RNA sequencing, spatial transcriptomics, and bulk RNA-seq deconvolution revealed distinct stromal and immune subpopulations preferentially enriched in low-grade tumors, including F3_CXCR4 fibroblasts, M1_IGKC myeloid cells, and E4_CLU endothelial cells. These subtypes exhibited unique functional programs and spatial compartmentalization, implicating their critical roles in shaping early tumor ecosystems. Interestingly, despite their association with favorable prognosis and low-grade status, these cell populations correlated with reduced predicted responsiveness to immune checkpoint blockade, suggesting a complex interplay between the TME composition and immunotherapy efficacy.
The TIME plays a pivotal role in shaping disease progression and clinical outcomes in BRCA19,20. Modulating the immunosuppressive aspects of the TIME to boost anti-cancer immune responses represents a key objective of contemporary cancer immunotherapy. Strategies targeting different components of the TIME, such as immune checkpoint molecules and regulatory immune cells, have been designed to augment the immune system’s capacity to detect and destroy cancer cells. These approaches have shown substantial efficacy across various cancer types, leading to the development of promising treatments like immune checkpoint inhibitors (ICIs) and adoptive cell therapies. The role of epigenetics in regulating immune responses, including immune cell differentiation, activation, and infiltration into tumors, has been particularly noted, suggesting that epigenetic reprogramming of the TIME could be a viable therapeutic approach21. Ongoing research and clinical trials are exploring this potential, aiming to harness these mechanisms for more effective cancer treatments22. Our study reveals distinct cellular behaviors in tumor cell subtypes and immune cells, specifically highlighting differences in gene expression and cellular functions that influence lipid metabolism and tumor dynamics. Separate analyses of myeloid and stromal cells provide insights into their unique identities and functional states, while the exploration of cell communication patterns offers a deeper understanding of the interactions within the tumor microenvironment.
HOX genes, including HOXB2, are crucial regulatory genes conserved across species, playing significant roles in embryonic development and cellular processes23. HOXB2 has been identified as a gene that functions variably as an oncogene or a tumor suppressor in various cancers, affecting tumor growth, progression, and metastasis24,25. It has been implicated in the tumorigenesis of multiple cancer types such as breast, lung, cervical, esophageal, glioblastoma, ovarian, and colorectal cancers26,27,28,29. In specific cancer contexts, such as triple-negative breast cancer (TNBC), HOXB2 levels are notably decreased, affecting cancer progression and prognosis negatively. A study identified the antisense RNA HOXB-AS1 as a guide molecule that facilitates the addition of the H3K4me3 mark by SMYD3 to the HOXB2 promoter region in non-TNBC, promoting HOXB2 expression. However, the low expression of HOXB-AS1 in TNBC leads to reduced HOXB2 levels, subsequently downregulating the ECM2 transcriptional network and MATN3, which are linked to more aggressive cancer progression, EMT-like characteristics, and poor prognosis30. In contrast, forced expression of HOXB2 in TNBC models suppresses invasive and migratory behaviors and inhibits tumor growth and metastasis in vivo31,32. Furthermore, HOXB2 downregulation correlates with poorer overall survival (OS) not only in breast cancer patients but also in those with other solid tumors. Notably, overexpression of HOXB2 has been associated with better prognostic outcomes. In breast cancer, specifically, lower HOXB2 expression levels have been significantly associated with higher grade tumors, suggesting its protective role against tumor aggressiveness32. Collectively, these findings underscore HOXB2 complex role in cancer biology, acting both as an oncogene and a tumor suppressor depending on the cancer type and cellular context, with a profound impact on cancer dynamics and therapeutic outcomes. In our study, among the seven subtypes of tumor cells, SCGB2A2 + NEO was found to be more abundant in medium-high-grade breast cancer than in low-grade breast cancer. Within this SCGB2A2⁺ subtype, cells with high HOXB2 expression exhibited significantly higher ABNORMAL_CIRCULATING_FATTY_ACID_CONCENTRATION scores than HOXB2-low malignant cells, suggesting a potential regulatory role of HOXB2 in fatty acid metabolism. Previous studies have indicated that the expression of HOX genes is associated with lipid accumulation during adipocyte differentiation. More specifically, HOXA5 has been shown to promote adipogenesis by increasing DNA methylation and inhibiting the PKA/HSL signaling pathway in mouse models. These findings collectively imply a potential mechanistic involvement of HOXB2 in regulating lipid metabolism. In addition, a large number of literatures have pointed out that abnormal fatty acid metabolism promotes the occurrence and development of tumors, and has become an important therapeutic target33,34,35. For instance, tumor-derived arachidonic acid has been shown to reprogram neutrophils toward an immunosuppressive phenotype and promote therapy resistance in TNBC.
We also explored the prognostic implications of immune subpopulations. IL7R⁺ CD8⁺ T cells, identified from single-cell data, were associated with a favorable prognosis in TCGA BRCA patients. IL7R is known to regulate T cell development, survival, and homeostasis through both membrane-bound and soluble isoforms36,37,38,39,40,41,42. Although IL7 signaling promotes proliferation in certain hematologic malignancies, it also plays vital roles in anti-tumor immunity43,44,45,46,47,48,49,50,51. As a result, IL7R-targeted therapies, including CAR-T cells and JAK/STAT inhibitors, have emerged as promising avenues in both autoimmune diseases and cancer immunotherapy52,53,54,55,56,57,58,59,60,61,62.
Furthermore, our spatial transcriptomic analysis identified the LGALS9–CD44 ligand–receptor pair as a key mediator in the GALECTIN signaling network, with broad expression across immune and tumor compartments. Galectin-9 (Gal-9), encoded by LGALS9, is a tandem-repeat-type galectin with immunomodulatory properties, particularly through binding to CD44 on regulatory T cells to enhance their stability and suppressive function63,64,65,66,67,68,69,70,71. Interestingly, recent studies have suggested that Gal-9 also possesses anti-metastatic properties in breast cancer by promoting tumor cell aggregation and reducing extracellular matrix adhesion, thereby inhibiting dissemination72,73. Our findings reinforce the emerging role of LGALS9–CD44 interactions in immune regulation and tumor suppression, and position them as potential therapeutic targets.
In summary, our study provides a comprehensive characterization of the BRCA tumor ecosystem across multiple cellular dimensions. By integrating single-cell and spatial transcriptomics, we uncovered critical regulators such as HOXB2, IL7R, and LGALS9, offering novel insights into tumor–immune–stromal interactions and potential avenues for targeted therapy.
This study is limited by its reliance on publicly available datasets and computational predictions without direct experimental validation. Key findings, including the functional roles of HOXB2 and LGALS9–CD44 signaling, require further confirmation through in vitro and in vivo experiments. Additionally, the modest spatial transcriptomics sample size and heterogeneity among datasets constrain the generalizability of our conclusions. Future work will focus on integrating additional multi-omics data and validating candidate targets in independent patient cohorts to strengthen clinical applicability and guide therapeutic development.
In summary, our integrative multi-omic analysis elucidates the complex cellular composition, functional states, and spatial organization of the BRCA tumor microenvironment. The identification of low-grade-enriched stromal and immune subtypes with distinct signaling profiles enhances our understanding of tumor progression and immune modulation. These findings provide a valuable framework for the development of tailored therapeutic strategies targeting the TME to improve clinical outcomes in breast cancer.
Methods
Data acquisition and preprocessing
Bulk RNA-sequencing data and matched clinical information for BRCA were obtained from TCGA via the UCSC Xena browser (https://xenabrowser.net). Samples lacking survival data were excluded, resulting in 1082 cases for downstream survival analyses. Raw counts were normalized to transcripts per million (TPM) and log2-transformed prior to analysis.
scRNA-seq datasets of BRCA primary tumors were retrieved from the Gene Expression Omnibus (GEO) database (GSE203612, GSE114725, GSE176078), encompassing 59 samples in total. Spatial transcriptomics data included nine primary tumor samples from GEO (GSE203612) and Zenodo (zenodo.4739739). All analyses were performed using R software (version 4.1.3) and relevant packages.
Single-cell RNA-seq data processing and quality control
Raw scRNA-seq data were processed with the Seurat package. Quality control criteria filtered cells with mitochondrial gene content exceeding 20%, unique molecular identifier (UMI) counts between 200 and 20,000, and detected gene numbers ranging from 200 to 6000. Data normalization was employed using Seurat’s NormalizeData function. The top 2000 highly variable genes were identified using FindVariableFeatures. To mitigate cell cycle effects, cell cycle scores (S.Score and G2M.Score) were regressed out during data scaling (ScaleData). Batch effects across datasets were corrected with Harmony integration. Dimensionality reduction was performed using UMAP and t-SNE, and clustering utilized the Louvain algorithm implemented in Seurat.
Cell type annotation and subclustering
Major cell populations were annotated based on canonical marker genes: epithelial cells (EPCAM, KRT18, KRT19, CDH1), fibroblasts (DCN, THY1, COL1A1, COL1A2), endothelial cells (PECAM1, CLDN5, FLT1, RAMP2), T cells (CD3D, CD3E, CD3G, TRAC), NK cells (NKG7, GNLY, NCAM1, KLRD1), B cells (CD79A, IGHM, IGHG3, IGHA2), myeloid cells (LYZ, MARCO, CD68, FCGR3A), and mast cells (KIT, MS4A2, GATA2). Separate subclustering of epithelial, stromal, and immune compartments was performed to explore intrapopulation heterogeneity, with marker genes used for refined subtype identification.
Copy number variation (CNV) analysis
To distinguish malignant epithelial subpopulations, inferCNV was applied using normal epithelial cells as a reference. CNV profiles were inferred to identify tumor-specific chromosomal alterations.
Pseudotime trajectory analysis
Monocle2 was employed for pseudotime ordering of epithelial cell subclusters, using the DDRTree algorithm for dimensionality reduction and default parameters, to infer developmental trajectories and differentiation states.
Transcription factor regulatory network analysis
SCENIC analysis was conducted to identify active transcription factor (TF) regulons within cell subpopulations. The workflow utilized RcisTarget and GRNBoost motif databases, with AUCell scoring quantifying regulon activity across cells.
Spatial transcriptomics processing and deconvolution
Spatial transcriptomic datasets were quality-controlled and normalized using the SCT transform method. An average of ~2466 spots per sample was analyzed, with mean UMI counts ~9594 and mitochondrial content ~4.3%. Cell-type deconvolution for each spot was performed using the conditional autoregression-based deconvolution (CARD) algorithm, leveraging single-cell-derived cell-type annotations to predict spot-level cellular compositions.
Cell–cell communication analysis
Intercellular communication networks were inferred using the CellChat package. Normalized expression matrices were input to construct CellChat objects, followed by the identification of expressed ligand-receptor pairs and signaling pathways with default parameters. Communication probabilities and pathway-specific interactions were computed, and aggregated networks were visualized to reveal grade-dependent signaling alterations.
Statistical analysis
Statistical analyses and visualizations were conducted in R (v4.1.3). Pearson correlation assessed relationships between continuous variables. Categorical comparisons employed chi-square tests, while Wilcoxon rank-sum or Student’s t tests were used for continuous data, depending on normality. Optimal cutoff points for survival analysis were determined using the survminer package. Kaplan–Meier survival curves and Cox proportional hazards regression models were generated with the survival package, with two-sided p values < 0.05 considered statistically significant.
Data availability
The datasets used in this study are publicly available. Bulk RNA-sequencing data for BRCA were obtained from TCGA via UCSC Xena (https://xenabrowser.net). scRNA-seq data were retrieved from GEO (accession numbers: GSE203612, GSE114725, GSE176078). Spatial transcriptomics data are available from GEO (GSE203612) and Zenodo (zenodo.4739739). All data used in the study are fully accessible within this article.
Code availability
The code used for the analysis in this study is available upon reasonable request.
References
Sung, H. et al. Global Cancer Statistics 2020: GLOBOCAN estimates of incidence and mortality worldwide for 36 cancers in 185 countries. CA Cancer J. Clin. 71, 209–249 (2021).
Siegel, R. L., Giaquinto, A. N. & Jemal, A. Cancer Statist. CA Cancer J. Clin. 74, 12–49 (2024).
Li, C. J. et al. The molecular mechanism of epithelial-mesenc hymal transition for breast carcinogenesis. Biomolecules 9, 476 (2019).
Tzeng, Y. T., et al. Integrated analysis of pivotal biomarker of LSM1, immune cell infiltration and therapeutic drugs in breast cancer. J. Cell Mol. Med. 26, 4007–4020 (2022).
Müller, V. et al. Epidemiology, clinical outcomes, and unmet needs of patients with human epidermal growth factor receptor 2-positive breast cancer and brain metastases: a systematic literature review. Cancer Treat. Rev. 115, 102527 (2023).
Gluz, O. & Graeser, M. Molecular profiling in Early ER + breast cancer to aid systemic therapy decisions. Curr. Oncol. Rep. 25, 491–500 (2023).
Tzeng, Y. T. et al. Breast cancer organoids derived from patients: a platform for tailored drug screening. Biochem Pharm. 217, 115803 (2023).
Hammond, M. E. et al. American Society of Clinical Oncology/College of American Pathologists guideline recommendations for immunohistochemical testing of estrogen and progesterone receptors in breast cancer. J. Clin. Oncol. 28, 2784–2795 (2010).
Nielsen, T. O. et al. Assessment of Ki67 in breast cancer: updated recommendations from the International Ki67 in Breast Cancer Working Group. J. Natl. Cancer Inst. 113, 808–819 (2021).
Cardoso, F. et al. 70-gene signature as an aid to treatment decisions in early-stage breast cancer. N. Engl. J. Med. 375, 717–729 (2016).
Qian, Y. et al. Prognostic cancer gene expression signatures: current status and challenges. Cells 10, 648 (2021).
Jézéquel, P. et al. Identification of three subtypes of triple-negative breast cancer with potential therapeutic implications. Breast Cancer Res. 21, 65 (2019).
Pollard, J. W. Tumour-educated macrophages promote tumour progression and metastasis. Nat. Rev. Cancer 4, 71–78 (2004).
Barriga, V. et al. The complex interaction between the tumor micro-environment and immune checkpoints in breast cancer. Cancers 11, 1205 (2019).
Queen, M. M. et al. Breast cancer cells stimulate neutrophils to produce oncostatin M: potential implications for tumor progression. Cancer Res. 65, 8896–8904 (2005).
Treffers, L. W. et al. Neutrophils in cancer. Immunol. Rev. 273, 312–328 (2016).
Gelsomino, L. et al. Leptin signaling contributes to aromatase inhibitor resistant breast cancer cell growth and activation of macrophages. Biomolecules 10, 543 (2020).
Hughes, R. et al. Perivascular M2 Macrophages Stimulate Tumor Relapse after Chemotherapy. Cancer Res. 75, 3479–3491 (2015).
de Vicente, J. C. et al. Lectin-like transcript-1 (LLT1) expression in oral squamous cell carcinomas: prognostic significance and relationship with the tumor immune microenvironment. Int. J. Mol. Sci. 25, 4314 (2024).
Lin, S. et al. Single-cell transcriptomics reveal distinct immune-infiltrating phenotypes and macrophage-tumor interaction axes among different lineages of pituitary neuroendocrine tumors. Genome Med. 16, 60 (2024).
Tien, F. M. et al. Epigenetic remodeling of the immune landscape in cancer: therapeutic hurdles and opportunities. J. Biomed. Sci. 30, 3 (2023).
Yin, J. et al. Epigenetic modulation of antitumor immunity and immunotherapy response in breast cancer: biological mechanisms and clinical implications. Front. Immunol. 14, 1325615 (2023).
Pearson, J. C., Lemons, D. & McGinnis, W. Modulating Hox gene functions during animal body patterning. Nat. Rev. Genet 6, 893–904 (2005).
Shah, N. & Sukumar, S. The Hox genes and their roles in oncogenesis. Nat. Rev. Cancer 10, 361–371 (2010).
Bhatlekar, S., Fields, J. Z. & Boman, B. M. HOX genes and their role in the development of human cancers. J. Mol. Med.92, 811–823 (2014).
Inamura, K. et al. HOXB2, an adverse prognostic indicator for stage I lung adenocarcinomas, promotes invasion by transcriptional regulation of metastasis-related genes in HOP-62 non-small cell lung cancer cells. Anticancer Res. 28, 2121–2127 (2008).
Gonzalez-Herrera, A. et al. Increased expression of HOXB2 and HOXB13 proteins is associated with HPV infection and cervical cancer progression. Asian Pac. J. Cancer Prev. 16, 1349–1353 (2015).
Xu, F. et al. Epigenetic induction of tumor stemness via the lipopolysaccharide-TET3-HOXB2 signaling axis in esophageal squamous cell carcinoma. Cell Commun. Signal 18, 17 (2020).
Dongre, A. & Weinberg, R. A. New insights into the mechanisms of epithelial-mesenchymal transition and implications for cancer. Nat. Rev. Mol. Cell Biol. 20, 69–84 (2019).
Oh, J. H. et al. The homeoprotein HOXB2 limits triple-negative breast carcinogenesis via extracellular matrix remodeling. Int J. Biol. Sci. 20, 1045–1063 (2024).
Yu, H. Y. & Pan, S. S. MiR-202-5p suppressed cell proliferation, migration and invasion in ovarian cancer via regulating HOXB2. Eur. Rev. Med. Pharm. Sci. 24, 2256–2263 (2020).
Boimel, P. J., Cruz, C. & Segall, J. E. A functional in vivo screen for regulators of tumor progression identifies HOXB2 as a regulator of tumor growth in breast cancer. Genomics 98, 164–172 (2011).
Blücher, C. & Stadler, S. C. Obesity and breast cancer: current insights on the role of fatty acids and lipid metabolism in promoting breast cancer growth and progression. Front Endocrinol.8, 293 (2017).
Madak-Erdogan, Z. et al. Free fatty acids rewire cancer metabolism in obesity-associated breast cancer via estrogen receptor and mTOR signaling. Cancer Res. 79, 2494–2510 (2019).
George Warren, W. et al. The emerging role of fatty acid binding protein 5 (FABP5) in cancers. Drug Discov. Today 28, 103628 (2023).
Jiang, Q. et al. Cell biology of IL-7, a key lymphotrophin. Cytokine Growth Factor Rev. 16, 513–533 (2005).
Iwata, M. et al. Functional interleukin-7 receptors (IL-7Rs) are expressed by marrow stromal cells: binding of IL-7 increases levels of IL-6 mRNA and secreted protein. Blood 100, 1318–1325 (2002).
Al-Rawi, M. A. et al. Aberrant expression of interleukin-7 (IL-7) and its signalling complex in human breast cancer. Eur. J. Cancer 40, 494–502 (2004).
Fernandez-Botran, R. Soluble cytokine receptors: basic immunology and clinical applications. Crit. Rev. Clin. Lab Sci. 36, 165–224 (1999).
Fernandez-Botran, R., Crespo, F. A. & Sun, X. Soluble cytokine receptors in biological therapy. Expert Opin. Biol. Ther. 2, 585–605 (2002).
Lundström, W. et al. Soluble IL7Rα potentiates IL-7 bioactivity and promotes autoimmunity. Proc. Natl. Acad. Sci. USA 110, E1761–E1770 (2013).
Lee, B. & Hong, C. The role of soluble common gamma chain in autoimmune disease. Anat. Cell Biol. 48, 10–15 (2015).
Lundmark, F. et al. Variation in interleukin 7 receptor alpha chain (IL7R) influences risk of multiple sclerosis. Nat. Genet. 39, 1108–1113 (2007).
Todd, J. A. et al. Robust associations of four new chromosome regions from genome-wide analyses of type 1 diabetes. Nat. Genet. 39, 857–864 (2007).
McKay, F. C. et al. Haplotypes of the interleukin 7 receptor alpha gene are correlated with altered expression in whole blood cells in multiple sclerosis. Genes Immun. 9, 1–6 (2008).
Crawley, A. M., Faucher, S. & Angel, J. B. Soluble IL-7R alpha (sCD127) inhibits IL-7 activity and is increased in HIV infection. J. Immunol. 184, 4679–4687 (2010).
Park, S. L. et al. p27KIP1 is involved in ERK1/2-mediated MMP-9 expression via the activation of NF-κB binding in the IL-7-induced migration and invasion of 5637 cells. Int J. Oncol. 44, 1349–1356 (2014).
Chen, D. et al. Interleukin-7 biology and its effects on immune cells: mediator of generation, differentiation, survival, and homeostasis. Front Immunol. 12, 747324 (2021).
Delgado-Martin, C. et al. JAK/STAT pathway inhibition overcomes IL7-induced glucocorticoid resistance in a subset of human T-cell acute lymphoblastic leukemias. Leukemia 31, 2568–2576 (2017).
Ribeiro, D. et al. STAT5 is essential for IL-7-mediated viability, growth, and proliferation of T-cell acute lymphoblastic leukemia cells. Blood Adv. 2, 2199–2213 (2018).
Barata, J. T. et al. Activation of PI3K is indispensable for interleukin 7-mediated viability, proliferation, glucose use, and growth of T cell acute lymphoblastic leukemia cells. J. Exp. Med 200, 659–669 (2004).
Shum, T. et al. Constitutive signaling from an engineered IL7 receptor promotes durable tumor elimination by tumor-redirected T cells. Cancer Discov. 7, 1238–1247 (2017).
Zhao, Z. et al. Engineered IL-7 receptor enhances the therapeutic effect of AXL-CAR-T cells on triple-negative breast cancer. Biomed. Res Int 2020, 4795171 (2020).
Huang, B. et al. B7-H3 specific T cells with chimeric antigen receptor and decoy PD-1 receptors eradicate established solid human tumors in mouse models. Oncoimmunology 9, 1684127 (2020).
Noh, K. E. et al. TGF-β/IL-7 Chimeric switch receptor-expressing CAR-T cells inhibit recurrence of CD19-positive B cell lymphoma. Int. J. Mol. Sci. 22, 8706 (2022).
Yasunaga, M. Antibody therapeutics and immunoregulation in cancer and autoimmune disease. Semin Cancer Biol. 64, 1–12 (2020).
Penaranda, C. et al. IL-7 receptor blockade reverses autoimmune diabetes by promoting inhibition of effector/memory T cells. Proc. Natl. Acad. Sci. USA 109, 12668–12673 (2012).
Hartgring, S. A. et al. Blockade of the interleukin-7 receptor inhibits collagen-induced arthritis and is associated with reduction of T cell activity and proinflammatory mediators. Arthritis Rheum. 62, 2716–2725 (2010).
Yasunaga, M., Manabe, S. & Matsumura, Y. Immunoregulation by IL-7R-targeting antibody-drug conjugates: overcoming steroid-resistance in cancer and autoimmune disease. Sci. Rep. 7, 10735 (2017).
Akkapeddi, P. et al. A fully human anti-IL-7Rα antibody promotes antitumor activity against T-cell acute lymphoblastic leukemia. Leukemia 33, 2155–2168 (2019).
Senkevitch, E. et al. Inhibiting Janus Kinase 1 and BCL-2 to treat T cell acute lymphoblastic leukemia with IL7-Rα mutations. Oncotarget 9, 22605–22617 (2018).
Maude, S. L. et al. Targeting JAK1/2 and mTOR in murine xenograft models of Ph-like acute lymphoblastic leukemia. Blood 120, 3510–3518 (2012).
Oda, Y. et al. Soluble lactose-binding lectin from rat intestine with two different carbohydrate-binding domains in the same peptide chain. J. Biol. Chem. 268, 5929–5939 (1993).
Barondes, S. H. et al. Galectins. Structure and function of a large family of animal lectins. J. Biol. Chem. 269, 20807–20810 (1994).
Yasinska, I. M. et al. The Tim-3-Galectin-9 Pathway and Its Regulatory Mechanisms in Human Breast Cancer. Front. Immunol. 10, 1594 (2019).
Chen, Z. et al. The role of Tim-3/Galectin-9 pathway in T-cell function and prognosis of patients with human papilloma virus-associated cervical carcinoma. Faseb J.35, e21401 (2021).
Seifert, A. M. et al. Detection of pancreatic ductal adenocarcinoma with galectin-9 serum levels. Oncogene 39, 3102–3113 (2020).
Yuan, F. et al. Molecular and clinical characterization of Galectin-9 in glioma through 1027 samples. J. Cell Physiol. 235, 4326–4334 (2020).
Nakajima, R. et al. Possible therapeutic applicability of galectin-9 in cutaneous T-cell lymphoma. J. Dermatol Sci. 96, 134–142 (2019).
Wdowiak, K. et al. Increased serum levels of Galectin-9 in patients with chronic lymphocytic leukemia. Oncol. Lett. 17, 1019–1029 (2019).
Wu, C. et al. Galectin-9-CD44 interaction enhances stability and function of adaptive regulatory T cells. Immunity 41, 270–282 (2014).
Irie, A. et al. Galectin-9 as a prognostic factor with antimetastatic potential in breast cancer. Clin. Cancer Res. 11, 2962–2968 (2005).
Yamauchi, A. et al. Galectin-9, a novel prognostic factor with antimetastatic potential in breast cancer. Breast J. 12, S196–S200 (2006).
Acknowledgements
This work was supported by the Guangdong Basic and Applied Basic Research Foundation (Regional Joint Fund - Regional Cultivation Project, Grant No. 2023A1515140039), the Research Cultivation and Innovation Fund of Huizhou First Hospital (Key Cultivation Project Grant No. 2024ZD002; Youth Cultivation Project Grant Nos. 2024QN001 and 2024QN004), and the Huizhou Science and Technology Research and Development Program (Grant No. 2024CZ010001).
Ethics declarations
Competing interests
The authors declare no competing interests.
Additional information
Publisher’s note Springer Nature remains neutral with regard to jurisdictional claims in published maps and institutional affiliations.
Supplementary information
Rights and permissions
Open Access This article is licensed under a Creative Commons Attribution-NonCommercial-NoDerivatives 4.0 International License, which permits any non-commercial use, sharing, distribution and reproduction in any medium or format, as long as you give appropriate credit to the original author(s) and the source, provide a link to the Creative Commons licence, and indicate if you modified the licensed material. You do not have permission under this licence to share adapted material derived from this article or parts of it. The images or other third party material in this article are included in the article’s Creative Commons licence, unless indicated otherwise in a credit line to the material. If material is not included in the article’s Creative Commons licence and your intended use is not permitted by statutory regulation or exceeds the permitted use, you will need to obtain permission directly from the copyright holder. To view a copy of this licence, visit http://creativecommons.org/licenses/by-nc-nd/4.0/.
About this article

Cite this article
Kuang, J., Zhong, G., Zhao, L. et al. Machine learning analysis reveals tumor heterogeneity and stromal-immune niches in breast cancer. npj Digit. Med. 8, 565 (2025). https://doi.org/10.1038/s41746-025-01967-7
Received:
Accepted:
Published:
DOI: https://doi.org/10.1038/s41746-025-01967-7